INVESTOR PRESENTATION - Spartan Delta Corp. (SDE: TSX) (as of September 1, 2021) August 31, 2021 - 9th Annual Energy Conference

Page created by Ken Harmon
 
CONTINUE READING
INVESTOR PRESENTATION - Spartan Delta Corp. (SDE: TSX) (as of September 1, 2021) August 31, 2021 - 9th Annual Energy Conference
INVESTOR PRESENTATION
Spartan Delta Corp. (SDE: TSX) (as of September 1, 2021)

August 31, 2021
INVESTOR PRESENTATION - Spartan Delta Corp. (SDE: TSX) (as of September 1, 2021) August 31, 2021 - 9th Annual Energy Conference
SPARTAN DELTA - THE VALUE PROPOSITION
 Building a Sustainable Energy Company With Industry Leading Returns

                Experienced                         First Class                                Sustainable                           Two Core
                 Leadership                           Assets                                    Platform                           Operating Areas
              record of efficient capital       Montney and Deep Basin,                   with a top decile liability                  yielding consistently
                discipline and value             two of Canada’s most                         rating and newly                       improving economies of
                      creation                       prolific plays                        constructed facilities                              scale

Acquisitions have built the platform;                                                     2022E Return On Average Capital Employed(1)
Focus is now on integration and execution                                     25%

 ▪ Double digit organic growth                                                20%
 ▪ Double digit Free Funds Flow      Yield(1)
                                                                              15%
 ▪ Best in class Return on Average Capital Employed(1)
 ▪ Corporate Payout Ratio(1) < 70%                                            10%

 ▪ 25+ years of inventory in two of Canada’s most economic plays
                                                                                5%
 ▪ $350MM+ of owned infrastructure with capacity to grow
                                                                                0%
                                                                                         SDE
                                                                                     Source: Peters & Co. “E&P Overview Tables” as of August 31, 2021. Peers include AAV, ARX, BIR,
                                                                                     CPG, ERF, NVA, PEY, POU, TOU, TVE and WCP.

            August 31, 2021                                                                                                                                                           2
                                                           1)    See Non-GAAP Measures in Disclaimers
INVESTOR PRESENTATION - Spartan Delta Corp. (SDE: TSX) (as of September 1, 2021) August 31, 2021 - 9th Annual Energy Conference
SPARTAN DELTA CORPORATE STRATEGY
Building a Sustainable Energy Company
                                                      CONCENTRATED ASSET BASE

                 DEEP BASIN                                                                                MONTNEY
 ▪ Highly economic development within a wide                                                 ▪ Largest producer and acreage holder in
   range of commodity prices                                                                   the oil window of the Montney
 ▪ Dominant deep cut infrastructure position                                                 ▪ Organically funded growth engine
 ▪ Material Free Funds Flow(1) generation                                                    ▪ Drill ready inventory with scale and
                                                                                               repeatability

 SUSTAINABLE ENERGY COMPANY                                                                  SHAREHOLDER RETURN DRIVEN
 ▪ Strong Indigenous partnerships                                                            ▪ Building a diversified Free Funds Flow(1)
                                                                                               stream to return value to shareholders
 ▪ Gender diverse leadership and workforce
                                                                                             ▪ Organic growth supplemented by
 ▪ Top-decile liability ratio with a proactive
                                                                                               opportunistic acquisitions
   approach to environmental responsibilities
                                                                                             ▪ Disciplined use of leverage

    ESG LEADERSHIP                                                                                              ROI

            August 31, 2021                                                                                                                3
                                                 1)   See Non-GAAP Measures in Disclaimers
INVESTOR PRESENTATION - Spartan Delta Corp. (SDE: TSX) (as of September 1, 2021) August 31, 2021 - 9th Annual Energy Conference
STRATEGIC EXECUTION
“We are what we repeatedly do. Excellence, then, is not an act, but a habit.” - Aristotle

  STRATEGIC OBJECTIVES            SINCE JUNE 2020                                               LOOKING FORWARD

 Capitalize on generational    Deep Basin portfolio was acquired for                          Focus on select tuck-in opportunities
 acquisition opportunities     less than 1x realized NOI (1)                                  within our two core development areas

 Grow to 100,000 BOE/d in      250 BOE/d(2) to 62,500 BOE/d(3) in 14                          Organic growth through scale and
 2-3 years                     months                                                         repeatability of the Montney

 Build a diversified but       Concentrated development in the Deep                           Capitalize on development and
 concentrated portfolio        Basin and the Montney                                          operating synergies to drive down costs

 Total Return Model: FCF(1)    ~28% organic growth while generating                           2022: Org growth ~12%, FCF yield 18%(1)
 plus >10% organic growth      ~$75 million of Free Funds Flow(1)                             2023: Org growth ~11%, FCF yield 28%(1)

 Build a sustainable energy    Proactive ARO program, strong First                            Evaluate technologies and implement
 company                       Nation partnerships and ESG targets                            practices to augment current targets

           August 31, 2021                                                                                                              4
                                  1)   See Non-GAAP Measures in Disclaimers
                                  2)   12% crude oil, 7% NGLs, and 82% natural gas
                                  3)   17% oil, 3% condensate, 18% NGLs and 62% natural gas
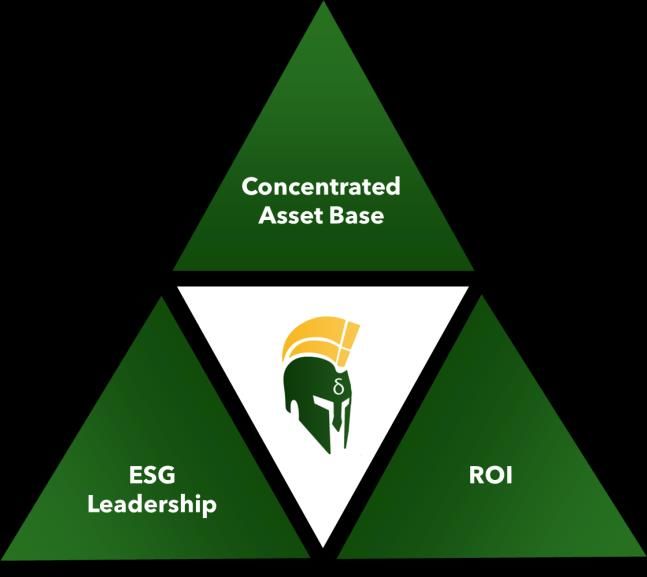
INVESTOR PRESENTATION - Spartan Delta Corp. (SDE: TSX) (as of September 1, 2021) August 31, 2021 - 9th Annual Energy Conference
COMPANY OVERVIEW
 Spartan Delta Corp. (SDE:TSX)(3)

Capitalization (as at August 30, 2021)                                                                                                                                                                         62,500 boe/d(10)
                                                                                                                                                                                                       from two core development areas
Spartan Delta Corp.                                                                          TSX (3)                       SDE

                                                                                                                                                                                                         MONTNEY:
Share Price(1)                                                                                 $/sh                        4.36
                                                                                                                                                                                                              ▪ Largest producer and land holder
Market Capitalization (basic) (1)                                                             $MM                         641.7                                                                                 in the Montney oil window
                                                                                                                                                                                                              ▪ Deep inventory of development
Common Shares Outstanding (basic)                                                              MM                         147.2                                                                                 opportunities
                                                                                                                                                                                                              ▪ Growth engine for the next
Net Debt (pro forma Sep. 2, 2021) (2)                                                         $MM                          492                                                                                  decade

Estimated YE 2021 Net Debt (Surplus) (2)                                                      $MM                          483                                                                           DEEP BASIN:
                                                                                                                                                                                                              ▪ Cretaceous Oil and Liquids-Rich
Management & Board Ownership (basic)                                                             %                          10                                                                                  Gas focus

Dilutive Instruments                                                                                                                                                                                          ▪ Low decline and material free
                                                                                                                                                                                                                cash flow generation
   Warrants, ITM Options and Share Awards                                                      MM                          22.1                                              Calgary,                         ▪ Dominant infrastructure position
                                                                                   (4)         MM                           6.5                                              Alberta
   Zero Coupon Convertible Note (maximum issuance)
   Dilutive Proceeds                                                                          $MM                          30.1
Fully Diluted Shares Outstanding                                                               MM                         175.8

                                                                                         MAJOR CORPORATE MILESTONES

 Fourth Quarter, 2019                              Second Quarter, 2020                                 Fourth Quarter, 2020                               First Half, 2021                                     Third Quarter, 2021
 Recapitalization of Return                        Acquisition of Deep Basin core                       Commenced drilling in the Deep                     5 strategic acquisitions                             Acquisition of Velvet Energy Inc.,
 Energy Inc., with production of                   area, adding ~25,000 boe/d of                        Basin, adding over 10,000 boe/d                    established our Montney core                         in the oil-weighted Montney,
 250 boe/d in Alberta(5)                           production(6)                                        of initial production(7)                           area adding 10,000 boe/d of                          adding ~20,600 boe/d of
                                                                                                                                                           production(8)                                        production(9)

                   August 31, 2021                                                                                                                                                                                                                              5
                   1)       Share price as at closing on August 30, 2021   4)   Assumes maximum issuance at conversion of $7.67/sh   7)   6% condensate, 23% NGLs, and 71% natural gas                  10)       17% crude oil, 3% condensate, 18% NGLs, and
                   2)       See “Non-GAAP Measures” in Disclaimers         5)   12% crude oil, 7% NGLs, and 82% natural gas          8)   23% crude oil, 4% condensate, 8% NGLs, and 65% natural gas              62% natural gas
                   3)       As of September 1, 2021                        6)   7% condensate, 23% NGLs, and 70% natural gas         9)   42% crude oil, 14% NGLs, and 44% natural gas
INVESTOR PRESENTATION - Spartan Delta Corp. (SDE: TSX) (as of September 1, 2021) August 31, 2021 - 9th Annual Energy Conference
VELVET ACQUISITION SUMMARY
Acquisition Positions Spartan as the Dominant Player in Canada’s Montney Oil Window
      ASSET FEATURES                                 ACCRETIVE METRICS
                                                                                                                                BC AB

                                                                                                                                            Flatrock: Undeveloped Resource Potential
                                                                                                                                            • No production or reserves
         20,600     boe/d(1)                                $751.5 Million                                                                  • Emerging oil weighted property

              (44% Liquids)                                  Total consideration                                     Flatrock

                                                                                                                                                             Pouce: Development & Growth
              >280,000                                                  2.8x                                                                                 • 1,200 boe/d (350 bbl/d oil)(3)
                                                                                                                                                             • Low risk organic growth potential
           Net Montney acres                          2022 Net Operating Income(4)(7)

                 >700                                              $36,083
        Net Montney    locations(3)                             Per flowing boe                                                    Pouce Coupe

          140.0 MMBoe                                                $14.47
             1P Reserves(2)(3)                               1P F&D (incl FDC)(3)

                                                                                                                                                                                                Gold Creek: Core Property
              $1.15 BN                               2022 >35%, 2023 ~50%                                                                                                                       • 16,750 boe/d (6,100 bbl/d oil)(3)
                                                                                                                                                                                                • Complements SDE Gold Creek
               1P NPV10(3)                                     CFPS (4) accretion
                                                                                                                                                                          GRANDE PRAIRIE

      $1.2 BN of tax pools                                      2023 ~20%
           (>$600MM NCLs(5))                                  FCFPS (4) accretion
                                                                                                                                                                         Gold Creek
▪   Pro forma Spartan will have 450,000 net Montney acres (703 sections)(6)
▪   Montney oil development economics drive corporate level returns in excess of 30% at strip
    pricing                                                                                                                              Karr: Development & Growth
                                                                                                                                         • 2,650 boe/d (2,150 bbl/d oil)(3)
▪   Wells drilled to date in Karr are amongst the top 5 Montney oil wells(8) in the basin since 2015                                     • Top Montney Oil Wells in the Basin
                                                                                                                                                                                                Karr
▪   Spartan will benefit from Velvet’s delineation, well design experimentation and operational
    learning curve
▪   Full infrastructure solution in place in Gold Creek and Karr through a land dedication with no                                                                                                 Simonette
    take or pay commitments                                                                                                                 Spartan Montney Lands
                                                                                                                                             Velvet Montney Lands
▪   Development plan supported by over $30 million of geoscience data

              August 31, 2021                                                                                                                                                                                                         6
                                                1)     Comprised of 42% crude oil, 14% NGLs and 44% natural gas 4)        See Non-GAAP Measures in Disclaimers                             7)      3.4x after financial instruments
                                                2)     See appendix for additional Velvet reserves information  5)        Non-Capital Losses                                               8)      Based on 2-year cumulative oil
                                                3)     See Oil and Gas Advisories in Disclaimers                6)        Acreage includes Montney rights outside of the map limits
SPARTAN PRO FORMA
Enhancing the Value Proposition for Spartan Shareholders

                          PRO FORMA ATTRIBUTES
                                                                                                                                                        ▪ Pro Forma Spartan will hold a dominant
                                                                                                                                                          position in two core areas with industry
                                                                                                                               Asset Quality              leading economics; land 580,000 net acres;
                                                                                                                                                          >1,500 drilling locations(4)

     ~$0.7 B                              ~$1.2 B                            70 mboe/d
 Market Capitalization(2)               Enterprise Value(2)                    2022E Production(1)                                                      ▪ Spartan maintains an attractive valuation
                                                                                                                               Value                      while delivering peer leading organic growth,
                                                                                                                                                          a robust free cash flow yield and a
                                                                                                                               Proposition                sustainable, ESG conscious operating
                                                                                                                                                          platform
   $434 mm                              $134 mm                                     $1.0 billion enterprise value
                                                                                                                                                          • Larger free float enhancing share liquidity

         12%                                  18%                                     30%                                                               ▪ Accretive on 2022 CFPS(3) (35%) and 2023
2022E Organic Growth(1)(6)             2022E FCF Yield(1)(2)(3)              2022E Total Return(2)(3)                                                     CFPS(3) (50%) and FCFPS(3) (20%)
                                                                                                                               Accretion &
                                                                                                                               Sustainability ▪ Creates  a pro forma asset portfolio capable
                                                                                                                                                of delivering sustainable Total Shareholder
                                                                                                                                                            Return(3) ≥30%

                     August 31, 2021                 1)    Mid point of guidance seen on slide 10 with product breakdown
                                                                                                                                                                                                                       7
                                                                                                                                             4)   See Oil and Gas Advisories in Disclaimers
                                                     2)    Calculated at $4.36 per SDE share and 167MM treasury stock fully diluted shares   5)   Consisting of 17% oil, 3% condensate, 18% NGLs and 62% natural gas
                                                     3)    See Non-GAAP Measures in Disclaimers                                              6)   Growth versus current production estimate of 62,500 boe/d
DEEP BASIN OVERVIEW
Robust Economics and Infrastructure Footprint Underpin Free Funds Flow Engine
                                                                                                                                                                                                     SDE O’Chiese Nees-Ohpawaganu’ck 10-09
Deep Basin Asset Characteristics:                                                                                                                                                                        230mmscf/d Deep Cut (25% WI)

 ▪ Top quality resource of delineated liquids-rich Spirit River                                                                                               CVE Sand Creek
                                                                                                                                                                75 mmscf/d
                                                                                                                                                                                                                                   CVE Alder
                                                                                                                                                                                                                                  75 mmscf/d
   and condensate-rich Cardium gas development                                                                                                                    (9.6% WI)
                                                                                                                                                                                                                                      (20% WI)

 ▪ Significant owned and operated strategic infrastructure in
   place to grow production with minimal incremental capital
                                                                                                                   Spartan Working Interest Gas Plant
 ▪ Attractive netback driven by low operating costs and                                                            Third Party Gas Plant

   deep-cut liquid recovery                                                                                        Spartan Compressor Station / Battery
                                                                                                                   Spartan Lands
                                                                                                                   Ferrier Acquisition

 ~34,500 boe/d
  Current production(1)                 6 mo. Payout(5)
                                        Average actual payout of
 ~45,000 boe/d                           winter ‘20/21 drilling
 Drill to fill infrastructure                  campaign
         capacity(1)                                                                                                                                             Ferrier Tuck-in Acquisition:
                                                                                                                                                              ▪     $34.9 MM Net consideration
                                                                                                                                                              ▪     ~2,100 boe/d(6) (25% liquids); 19 Mmboe 2P
                                                                                                                                                                    Reserves(5)(7)

 ~$1 Bln(2)(5)                           ~$130MM(3)                                                                                                           ▪
                                                                                                                                                              ▪
                                                                                                                                                                    Will be redirected into Spartan operated infrastructure
                                                                                                                                                                    Transaction unlocks 12 high impact locations(5)
 Total Proved NPV10                     2022 Asset level FCF
                                                                                                                                                              ▪     2022 NOI $25MM(3)(4), Production 3,700 boe/d(4)(8)

                                                                                                                                                                  Southern Deep Basin:
                                                                                                                                                             ▪     Hydrocarbon charged column of stacked sand targets
                                                                                                                                                             ▪     Southern deep basin area characterized by shallower
                                                                                                                                                                   drilling depths (~2,400m) and higher liquids yields
                                                                                                                                                                   (~30% with access to deep cut plant)

               August 31, 2021 1)    Consisting of 1% oil, 4% condensate, 25% NGLs, and 70% natural gas       4)   Includes 1 pooled well into undeveloped section of SDE land   7)   Management Estimate
                                                                                                                                                                                                                                             8
                                2)   As at July 1, 2021 Spartan Mid-Year Reserve Update                       5)   See Oil and Gas Advisories in Disclaimers                     8)   Consisting of 4% condensate, 23% NGLs and 73%
                                3)   See Non-GAAP Measures in Disclaimers and guidance price deck on slide 31 6)   Consisting of 5% condensate, 24% NGLs and 71% natural gas          natural gas
MID-YEAR RESERVE EVALUATION (PRE-VELVET)
Completed to Incorporate H1 2021 Acquisitions

▪   Spartan completed an independent qualified reserves evaluation effective July 1, 2021

▪   Excludes Velvet reserves which can be found in the prospectus and the appendix

▪   Completed six acquisitions in H1 2021 prior to Velvet which have been incorporated into a Spartan mid-year reserves update

▪   Reserve book is in line with Spartan current business plan; manageable capital expenditures and development with significant free
    cash flow

                                                      2020 and H1 2021
                                                   acquisition consideration

                                                          $272MM
                                   50%                                                                           22%
                                 of PDP NPV10(1)                                                               of 1P NPV10(1)

                                        Oil               Natural Gas                              NGL's                    Total   NPV10
Reserves Category
                                      (MMbbl)                (Bcf)                                (MMbbl)                 (MMboe)   ($MM)

Proved Developed Producing              2.8                   338                                       22.7                81.9    $547

Total Proved                            18.1                  774                                       49.4               196.5    $1,249

Total Proved + Probable                 28.8                1,100                                       69.5               281.8    $1,758

               August 31, 2021                                                                                                               9
                                                     1)     See Oil and Gas Advisories in Disclaimers
2021 & 2022 DEVELOPMENT OUTLOOK
Maintaining Strong Free Funds Flow while Advancing Selected Growth Projects
                                                                                             BC      AB
MONTNEY
28,000 boe/d (current)(1)
$290 – $340 MM 2021 & 2022 capital
28-36 wells to be drilled
▪   450,000 net acres
▪   > 1,075 net drilling locations identified (28% booked) (3)(4)
▪   Self-Funding Growth Core Area
▪   Development drilling focus with selected growth and
    step out projects
▪   Integration and optimization across Montney portfolio

                 FLATROCK
                  Emerging oil asset awaiting resolution of the
                  BC Supreme Court cumulative impacts
                  judgment prior to delineation.

                 POUCE COUPE
                 3-4 wells                                                                                                                                                                        DEEP BASIN
                 Modest growth via development drilling.                                                                                                                                          34,500 boe/d (current)(2)
                 Gradual buildout of additional Spartan
                                                                                                                                                                                                  $135 - $185MM 2021 & 2022 capital
                 owned infrastructure.
                                                                                                                                                                                                  29-41 wells to be drilled
                 GOLD CREEK                                                                                                                                                                       ▪    130,000 net acres
                 22-27 wells                                                                                                                                                                      ▪    > 425 net drilling locations (21% booked)(4)
                 Grow into existing infrastructure with development                                                                                                                               ▪    Drill to Fill Spartan 10-9 Deep Cut
                 pads. Infrastructure optimization via debottlenecking                                                                                                                            ▪    Free Cash Flow Engine
                 projects. Maximize free funds flow.

                 KARR
                 3-4 wells
                 Grow asset via development drilling.

                 SIMONETTE
                  1-2 wells
                  Test optimized well design and placement to improve
                  economics while increasing throughput of Spartan
                  infrastructure.

                   August 31, 2021                                                                                                                                                                                                                  10
                                                1)    Consisting of 35% oil, 15% NGLs, and 50% natural gas                 3)   All wells extended reach (≥ 2500m HZ), booked wells as per IQRE well spacing, unbooked wells at 350m well spacing
                                                2)    Consisting of 1% oil, 4% condensate, 25% NGLs, and 70% natural gas   4)   See Oil and Gas Advisories in Disclaimers
FINANCIAL SUSTAINABILITY
       Low Leverage and Strong Funds Flow Across a Range of Commodity Prices

                                                       2021                                                                                                                                  2022                                                            FCF
      $500                                                                                                        $500                                                                                                    $70                               $182
                                                                                                                                           $70                          $3.75                                  (Guidance) $60              $134             $134
                                                                                                                                                          $434          $3.25
      $400                                                                                                        $400                     $60                                                                            $50                               $79
                                                                                                                                                                        $2.75
                                                                                                                                           $50
                                                                                                                                                                                                         $300
$MM

      $300                                                                                               $76 $300
                                                                                                                                                                                                       Growth &
                               $251                                                                                                                                                                   Discretionary
                                                                        $175                                      $200
      $200
                                                                       Growth

      $100                                                                                                        $100                                                                                Sustaining (2)
                                                                    Sustaining(2)

                                                                                                                                       WTI US$/bbl                    AECO C$/GJ
         -                                                          Maintenance                                         -                                                                            Maintenance

                      AFF                 AFF                         Capital                  Free Funds Flow                          AFF                 AFF                                        Capital                  Free Funds Flow
              (Oil Sens. +/- $10) (Gas Sens. +/- $0.50)                                                                         (Oil Sens. +/- $10) (Gas Sens. +/- $0.50)                                                                       Guidance

                                                           OIL PRICE SENSITIVITIES                                                          GUIDANCE (3)                                           GAS PRICE SENSITIVITIES
                                                       LOW OIL                                   HIGH OIL                                                                                     LOW GAS                                  HIGH GAS
                                                       - US$10/bbl                               + US$10/bbl                                                                                      - $0.50/GJ                              + $0.50/GJ
      Bechmark Prices                            2021(1)             2022                   2021(1)            2022                     2021(1)               2022                      2021(1)              2022                 2021(1)            2022
      WTI                    US$/bbl             $62                 $50                    $70                $70                      $66                   $60                       $66                  $60                  $66                $60
      AECO                    C$/GJ             $3.45               $3.25                  $3.45              $3.25                    $3.45                 $3.25                     $3.24                $2.75                $3.66              $3.75
      Metrics (5)
      AFF Change               $MM               ($10)              ($56)                   $8                $47                       $251                  $434                       ($8)               ($35)                  $8               $33
      Payout                    %                 72%                79%                    67%                62%                       70%                   69%                       72%                 75%                   68%               64%
      Free Funds Flow          $MM               $67                $79                    $85                $182                      $76                   $134                      $68                 $99                   $84               $168
                (4)
      FCF Yield                 %                 9%                 11%                    12%                25%                       10%                   18%                        9%                 14%                   12%               23%
      Exit Net Debt            $MM               $493               $414                   $475               $293                      $483                  $349                      $491                $392                  $475              $308
      D/AFF                     x                 nmf               1.1x                     nmf              0.6x                        nmf                 0.8x                          nmf             1.0x                    nmf             0.7x

                     August 31, 2021                                                                                                                                                                                                                          11
                                       1)   FY2021 price shown; H1 2021 as per realized actuals, H2 2021 guidance pricing shown on slide 31 and price sens. +/- applied to H2 2021 prices    4)      At $4.36 per common share on treasury stock FD basis
                                       2)   Sustaining capital is the capital required to maintain 62,500 boe/d, the estimated production in September 2021                                  5)      See Non-GAAP Measures in Disclaimers
                                       3)   At mid-point production guidance
THREE YEAR DEVELOPMENT PLAN
Total Return Focused Model of Organic Growth and Free Funds Flow Generation

                                                                                                                                                                                      Liquids

                % liquids shown in bar chart                                                                                                                                          Liquids
                                                                                                                        Liquids

        August 31, 2021                                                                                                                                                                                              12
                                         1)    See Non-GAAP Measures in Disclaimers                   3)   2022 Production growth calculate as 2022 mid-point guidance vs. September 2021 estimate of 62,500 boe/d
                                         2)    At $4.36 per common share on treasury stock FD basis   4)   See additional guidance price deck details on slide 31
RISK MANAGEMENT
Velvet Acquisition Adds a Diversified Risk Management Portfolio(1)

                                                                                                                                          Hedging
                                                                                                                                         Utilization

  Downside protection on a portion of crude production for                                         AECO Basis positions provide diversification to Henry Hub
  the next 10 months provides insulation against possible 4th                                      natural gas prices, safeguarding against structural or supply-
  wave of COVID-19 demand recovery delays                                                          led push back of Canadian exports to the United States

                                                                                                   Consistent with acquisition of the Deep Basin, a percentage
  Crude upside fully unlocked in H2 2022 as balance sheet
                                                                                                   of the acquired volumes have hedges in place to mitigate
  normalizes to management target of 0.5x - 1.0x D/CF
                                                                                                   risk of the near-term use of the balance sheet

           August 31, 2021                                                                                                                                          13
                                      1)   See additional risk management disclosure on slide 25
INDIGENOUS PARTNERSHIPS
Committed to Sustainable and Responsible Resource Development

O’Chiese and Sunchild First Nations
 ▪ Spartan has a partnership with the O’Chiese and Sunchild First Nations
   based on responsible development of oil & gas resources on First Nation       Spartan Supported Community Programs
   lands
        • Spartan prioritizes First Nation owned and operated business with
          respect to its operations
                                                                                        Youth                          Education
        • Spartan has created a socio-economic plan for First Nation              Attendance record and              Student Program &
          Partners focused on youth, education and elders                       grade performance awards            Scholarships for adults
                                                                                 Assistance towards lunch         choosing to continue their
                                                                                         programs                         education
Leading Environmental Stewardship on First Nation Lands
 ▪ Spartan, together with the O’Chiese First Nation, have created an industry
   leading Abandonment & Reclamation Program to protect Indigenous lands
   for future generations                                                                               Elders
                                                                                                Host an Elders led event in
        • The ARO program outlines and commits Spartan to timely                                   Red Deer to discuss
          abandonment & reclamation of all wells on the O’Chiese First                           community related ideas
                                                                                                    and opportunities
          Nation lands
        • Spartan has targeted to abandon 80% of inactive wells on the
          O’Chiese First Nation lands by the end of 2023

            August 31, 2021                                                                                                                    14
SPARTAN’S SUSTAINABLE DEVELOPMENT GOALS
Spartan is Committed to Meeting the Needs of the Present, While Protecting the Future

                               Focus Since Inception in 2020

    Environmental                                Gender                   Management &                   Acquired Velvet assets
     Stewardship                                 Diversity                   Board                         include an industry
    Top Decile Liability Ratio              Female Workforce:              Ownership                     leading water recycling
     88 Wells Abandoned                   22% Senior Management             10% of Common Shares                 project
   Carbon Credit Generation                   46% Workforce                Top Decile in Peer Group
                                                                                                      Water reuse percentage (2019)
                                                                                                       53% vs. peer average of 10%
                                   New Targets Set in 2021

                                                         80% of inactive
                      50% Reduction
                              Vented Methane                 wells
                             Emissions by 2025                abandoned on First
                                                             Nations land by 2025                     Spartan Inaugural ESG Report
                                                                                                       http://esg.spartandeltacorp.com

    Spartan supports the 17 Sustainable Development Goals adopted by Canada and all United Nations members to create a
     more sustainable future. Spartan will continue to identify ways to support the UN SDGs as we grow our ESG program.

           August 31, 2021                                                                                                               15
INVESTOR HIGHLIGHTS
Platform for Sustainable Organic Growth and Free Funds Flow(1) Generation

          Experienced team with a record of efficient capital discipline and value creation through consolidation

   Dominant position in two core areas, the Montney and Deep Basin, yielding some of Canada’s most prolific economics

         The Deep Basin with robust economics and infrastructure footprint is Spartan’s Free Funds Flow(1) engine

Post Velvet Acquisition, Spartan is the dominant player in Canada’s Montney oil window providing growth for the next decade

    Financial sustainability with prudent leverage and strong Adjusted Funds Flow(1) across a range in commodity prices

                  Three-Year development Plan focused on organic growth and Free Funds Flow(1) generation

                            Sustainable company with a clean operating platform and no liability overhang

                            Indigenous partnerships for sustainable and responsible resource development

                                                      Best in class 2022E ROACE (21%)(1)(2)

          August 31, 2021                                                                                                 16
                                         1)   See Non-GAAP Measures in Disclaimers
                                         2)   Source: Peters & Co. “E&P Overview Tables” as of August 31, 2021.
APPENDIX

August 31, 2021              17
SECOND QUARTER 2021 HIGHLIGHTS
 Optimization of Production and Cost Reductions Generate Material Free Funds Flow

Actuals                                    Q2 2021        Q1 2021                   FY 2020
Crude Oil                           %        5%             2%                          1%
Condensate                          %        5%             4%                          4%

Natural Gas Liquids (NGLs) (1)      %       19%            22%                         26%

Natural Gas                         %       71%            72%                         69%

Average Production                 boe/d   39,638         31,914                    15,421

Operating Expenses                 $/boe    5.56           5.06                        6.11

Transportation                     $/boe    1.62           1.34                        1.36

Royalties                           %       10.8%          12.6%                      9.0%

Operating Netback                  $/boe    16.89          14.28                       8.46

G&A                                $/boe    1.33           1.22                        1.64
Interest                           $/boe    0.01           0.12                        0.21

Adjusted Funds Flow (2)            $MM      53.0           34.6                        32.5

Capital Expenditure (before A&D)   $MM       9.4           19.3                        16.8

Well Count                           #        -              4                           4

Free Funds Flow (2)                $MM      43.6           15.3                        15.7

Exit Net Debt (Surplus) (2)        $MM     (131.7)         (98.3)                      12.3

                 August 31, 2021                                                                             18
                                                     1)          See Oil and Gas Advisories in Disclaimers
                                                     2)          See Non-GAAP Measures in Disclaimers
DEEP BASIN DEVELOPMENT
 Re-emerging as an Industry Leading Play
 Material Free Funds Flow Driven by Low Sustaining Capital:                                                                Spirit River and Cardium Type Wells(3)

   ▪ Existing infrastructure drives attractive full cycle economics while
     the asset remains in drill to fill mode
   ▪ Low sustaining capital(2) of $40-45MM at 34,500 boe/d(4) driven
     by decline rate of ~24% and capital efficiency of ~$5,000/boe/d
   ▪
AREA MONTNEY MAP
Spartan’s Positioning in the Montney Fairway
                           Kelt

                                  Flatrock

                                             Leucrotta

                                                                          Tourmaline
                                                             Arc

                                             Arc         Pouce
                                                            Birchcliff                 Kelt

                                             Ovintiv

                                                                            Advantage

                                                                         CNRL
                                                                                                     Kelt
                                                                                                          Grande
                                                                                                          Prairie
                                                                                              Pipestone

                                                                                Gold Creek
                                                                                              NuVista
                                                                                                               Shell
                                                                                                                    CNRL

                                                                                                              Paramount

                                                                                                                                   Cenovus

                                                                                                                       Karr
                                                                                                                           Arc         Whitecap

                                                                                                            Whitecap   Simonette
                                                                                                                                                  Kiwetinohk
                                                                                                                                 XTO

         August 31, 2021                                                                                                                                       20
THE MONTNEY OIL WINDOW
 Largest Semi-Contiguous Position in the Up-Dip Light Oil Montney Fairway

▪ ~450,000 net acres (703 sections)(2) of ~95% WI Crown
  Montney lands
                                                                                           Flatrock

▪ Lands reside within the volatile oil to black oil window and
  exhibit light oil characteristics with an average of ~40° API

                                                                                                                     Pouce Coupe
▪ Over 1,075 net identified drilling locations with 281 net
  locations currently booked by McDaniels in Spartan plus the
  Velvet reserves(1)

▪ Recent activity at Gold Creek and Karr demonstrate industry
  leading results

▪ Pouce Coupe low risk development drilling with room to
  expand Spartan owned infrastructure

                                                                                                                                   Gold Creek
▪ Simonette asset has existing base production and
  infrastructure; opportunity to test optimized well design to
  improve economics
                                                                                                                                                Karr

▪ Flatrock presents compelling future development potential                                                                                     Simonette
                                                                                                         BC AB
  with advantageous surface conditions and proximity to
  existing infrastructure                                                    VELVET
                                                                             SPARTAN

             August 31, 2021                                                                                                                                21
                                                                  1)   See Oil and Gas Advisories in Disclaimers
                                                                  2)   Acreage includes Montney rights not shown on the map
VELVET RESERVES SUMMARY
Mid-Year Reserve Update By Velvet Energy (July 1, 2021)(1)

▪   Velvet completed an independent qualified reserves evaluation effective July 1, 2021 (McDaniel)

▪   Spartan FDC model will be applied in YE 2021 Reserves update

                                        Oil                  Natural Gas                            NGL's      Total               NPV10
    Reserves Category
                                      (MMbbl)                   (bcf)                              (MMbbl)   (MMboe)               ($MM)

    Proved Developed Producing           8.8                          80                             4.8      26.9                   $388

    Total Proved                        52.7                         409                            19.2      140.0                 $1,147

    Total Proved + Probable             79.4                         685                            31.1      224.6                 $1,790

               Volumes                                              Values                                     1P by Product Type

               PDP     1P      2P                                 PDP        1P       2P                        Oil    NGLs   Natural Gas

             August 31, 2021                                                                                                                 22
                                                  1)   See Oil and Gas Advisories in Disclaimers
VELVET ASSET QUALITY: GOLD CREEK
Sustainable Development - YoY Improvement in Well Results
▪    Asset base delineated at Velvet’s expense starting in 2015                                                                                                          Gold Creek Well Performance(1)
                                                                                                                                             1,000
▪    Consistent improvement in costs and performance                                                                                                                                                             2020 McDaniels 2P Type Curve
                                                                                                                                                                                                                 386mbbl oil, 2.5bcf & 104mbbl NGLs
▪    2020+ wells averaged 1.2 year payout(3) at average oil price of                                                                                                                                             900mboe total reserves (3)

                                                                                                                          Oil Rate (bbl/d)
                                                                                                                                                                                           2020+
     US$56/bbl WTI on 2,350m HZ length                                                                                                        100                             2019
                                                                                                                                                                    2018

▪    Spartan identified improvement opportunities:
        1. Increase horizontal lengths (target of 3300m from historical                                                                        10
            ~2500m)
         2. Evaluate wider well spacing to further improve single well
            returns                                                                                                                             1
                                                                                                                                                     0             100              200              300                         400
         3. Leverage Velvet’s historical execution learning curve to                                                                                                            Cumulative Oil (mbbl)
            deliver reduced well cost                                                                                                                    2020 McDan GC 2P                    2018                    2019            2020+
                                                                                                                                                                                             16 wells                17 wells        9 wells

    Realized Actuals from 2020 & 2021 YTD Drilling Campaign

          Average well payout
                                                                               Average IP30
             1.2 years                                                      690 bbl/d
         at US$56/bbl WTI                                                  2,350m HZ length
      Weighted Average price to Payout

        132% IRR &
                                                                     $7.1MM DCET
     $7.3MM NPV10(2)

               August 31, 2021                                                                                                                                                                                                                 23
                                 1)   Performance normalized to 2500m horizontal length for all wells                                                                    3)     See Oil and Gas Advisories in Disclaimers
                                 2)   Based on realized actuals to date and then August 23, 2021 strip pricing go forward; See Non-GAAP Measures in Disclaimers
VELVET ASSET QUALITY: KARR AND POUCE COUPE
       Additional Development Assets
                                                             KARR                                                                                                                POUCE COUPE
       ▪             Two wells with long term production data; currently flowing back three                                          ▪                 Proven development drilling with low-cost structure (both opex and
                     new wells                                                                                                                         capex)

       ▪             Both producing wells are amongst the top five Montney oils wells drilled                                        ▪                 Ability to gradually expand Spartan infrastructure with moderate asset
                     in the basin since 2015 (2-year cum.)                                                                                             growth

       ▪             High oil weighting and low decline rate for Montney development

                                                                                                                                                                           Pouce Coupe Oil Performance
                                                                                                                                                     1,000

                                                   Karr Well Performance

                                                                                                                                  Oil Rate (bbl/d)
                                                                                                                                                       100
        1000                                                                                 16-17 normalized
                                                                                             to 2500m

                                                                                                                                                                 McDaniels 2P Pouce Oil Type Curve
                                                                                                                                                        10       277 mbbl oil, 2.9bcf & 37mbbl NGLs
                                                                                             16-17 actuals
                                                                                             1750m HZ stim                                                       797 mboe (1)
                   100
Oil Rate (bbl/d)

                                                                                                                                                         1
                                                                                                                                                             0              100               200                300             400
                                                                                                                                                                                      Cumulative Oil (mbbl)
                                        McDaniels 2P Karr Type Curve
                                        608 mbbl oil, 1.8bcf & 73mbbl NGLs                                                                  10,000
                   10                                                                                                                                                                  Gas Performance
                                        981 mboe (1)                                                                          Gas Raet (mcf/d)
                                                                                                                                                     1,000

                    1                                                                                                                                 100
                         0        100        200       300       400         500     600      700            800
                                                        Cumulative Oil (mbbl)                                                                          10
                             McDaniels Karr 2P                               16-17 scaled to 2500m                                                           0               1                2                  3               4
                                                                                                                                                                                    Cumulative Gas (bcf)
                             100/09-17-064-02W6/00 (2468m HZ)                100/16-17-064-02W6/00 (1750m HZ)
                                                                                                                                                                 Pouce Coupe Oil McDaniels 2P            100/05-24-079-11W6/00
                                                                                                                                                                 100/10-18-079-10W6/00                   100/08-23-079-11W6/00

                                    August 31, 2021                                                                                                                                                                                  24
                                                                                                                   1)   See Oil and Gas Advisories in Disclaimers
MARKETING & RISK MANAGEMENT
High Torque To Improving Fundamentals of Both Oil and Natural Gas

Summary of Net Positions(1)
                                                    Oil and Condensates
                  US$ WTI Swaps                   US$ MSW - WTI Swaps                            US$ C5 - WTI Swaps
             Volume                             Volume                                        Volume
Period                       US$/bbl                            US$/bbl                                        US$/bbl
             (Bbl/d)                            (Bbl/d)                                       (Bbl/d)
Q3 2021       6,337          $47.74              4,000           ($4.71)                       1,000            ($2.26)
Q4 2021        5,250           $49.69             4,000                 ($4.71)                 1,000                 ($2.26)
Q1 2022        4,750           $49.71                -                      -                      -                      -
Q2 2022        4,000           $49.74                -                      -                      -                      -

                                                          Natural Gas
             US$ NYMEX - AECO 7A Basis
                                                US$ NYMEX Swaps - Short                       US$ NYMEX Swaps - Collar
                   Swaps - Short
              Volume                            Volume                                        Volume             Floor - Ceiling
Period                      US$/Mmbtu                               US$/Mmbtu
            (Mmbtu/d)                         (Mmbtu/d)                                     (Mmbtu/d)            (US$/Mmbtu)
Q3 2021       56,630           ($1.09)          26,630                  $2.66                 30,000              $2.70 - $2.90
Q4 2021       85,000           ($1.09)           28,370                 $2.82                  39,946             $2.65 - $3.09
Q1 2022       85,000           ($1.13)           25,000                 $2.94                  45,000             $2.63 - $3.16
Q2 2022       85,000           ($1.13)           25,000                 $2.70                  30,000             $2.70 - $2.90
Q3 2022       85,000           ($1.13)           25,000                 $2.70                  30,000             $2.70 - $2.90
Q4 2022       85,000           ($1.15)           25,000                 $2.86                  10,109             $2.70 - $2.90
Q1 2023       85,000           ($1.13)           26,389                 $2.83                      -                      -
Q2 2023       85,000           ($1.09)           10,000                 $2.65                      -                      -
Q3 2023       85,000           ($1.08)           10,000                 $2.65                      -                      -
Q4 2023       85,000           ($1.08)           10,000                 $2.65                      -                      -

▪    Percentages hedged, excludes AECO Basis positions – which represent diversification to NYMEX Henry Hub on approximately 30-40%
     of natural gas production

             August 31, 2021                                                                                                                                                                           25
                                  1)     Summary does not include offsetting short/long positions which carry a financial impact of US$2.2 million for the period September through December of 2021
ANALYST COVERAGE & CONTACT INFORMATION

Institution                        Analyst                  EXECUTIVE OFFICE                         STOCK EXCHANGE LISTING(1)

ATB Capital Markets                Patrick O’Rourke         Spartan Delta Corp.                      The TSX Exchange
                                                            500, 207 – 9th Avenue SW                 Trading Symbol: SDE
                                                            Calgary, Alberta T2P 1K3
BMO Capital Markets                Ray Kwan                                                          INVESTOR INFORMATION
                                                            P: 403 265 8011
                                                            W: www.spartandeltacorp.com              Visit our website
Cormark Securities                 Garett Ursu
                                                                                                     W: www.spartandeltacorp.com
                                                            TRANSFER AGENT                           or contact
Desjardins Capital Markets         Chris MacCulloch                                                  Investor Relations
                                                            Odyssey Trust Inc.
                                                                                                     E: IR@spartandeltacorp.com
                                                            1230 – 300 - 5th Avenue SW
Eight Capital                      Phil Skolnick            Calgary, Alberta T2P 3C4                 CORPORATE CALENDAR
                                                            P: 587 885 0960
Haywood Capital Markets            Christopher Jones                                                 November 9, 2021
                                                            AUDITORS
                                                                                                     Third Quarter 2021 Results
National Bank Financial            Dan Payne
                                                            PricewaterhouseCoopers LLP
                                                            Calgary, Alberta
Paradigm Capital                   Adam Gill
                                                            ENGINEERING CONSULTANTS
Peters & Co. Limited               Dan Grager
                                                            McDaniel & Associates Consultants Ltd.
                                                            Calgary, Alberta
Raymond James                      Jeremy McCrea
                                                            LEGAL COUNSEL
Scotia Capital                     Cameron Bean
                                                            Stikeman Elliott LLP
Stifel - FirstEnergy               Cody Kwong               Calgary, Alberta

TD Securities                      Aaron Bilkoski

                 August 31, 2021                                                                                                  26
                                                       1)     As of September 1, 2021
MANAGEMENT TEAM & BOARD OF DIRECTORS
 MANAGEMENT TEAM
       Richard McHardy
                                  ➢   Former President, CEO and co-founder of Spartan Energy, Spartan Oil and Spartan Exploration
  Executive Chairman & Director
        Fotis Kalantzis
                                  ➢   Former SVP and co-founder of Spartan Energy, Spartan Oil and Spartan Exploration
    President, CEO & Director
         Geri Greenall
                                  ➢   Former CFO and co-founder, Camber Capital Corp., former Portfolio Manager & Chief Compliance Officer, Canoe Financial
              CFO
        Thanos Natras
                                  ➢   Former Geoscience Manager, Spartan Energy, former VP Exploration, Arcan Resources
         VP Exploration
         Craig Martin
                                  ➢   Former Manager D&C, Spartan Energy and Spartan Oil
         VP Operations
          Randy Berg
                                  ➢   Former VP Land, Spartan Energy, former VP Business Development & Land, Renegade Petroleum
            VP Land
        Mark Hodgson
                                  ➢   Former VP Operations, Obsidian Energy, former VP New Ventures & Country Manager, Bankers Petroleum
   VP Corporate Development
        Brendan Paton
                                  ➢   Former Manager Engineering, Spartan Delta, former Production Engineer, Shell Canada
         VP Engineering
         Ashley Hohm
                                  ➢   Former VP Finance, Kelt Exploration, former Manager Financial Reporting, Celtic Exploration
     VP Finance & Controller

 INDEPENDENT BOARD OF DIRECTORS
                                  ➢   Former Director of Spartan Energy, Spartan Oil, and Spartan Exploration  former President, Cypress Energy; Chairman &
      Donald Archibald
                                      CEO, Cequel Energy; President & CEO, Cyries Energy
                                  ➢   Former Director of Spartan Energy, Spartan Oil and Spartan Exploration  former Chairman, President & CEO, Big Horn
       Reg Greenslade
                                      Resources, Enterra Energy, Enterra Energy Trust, JED Oil; President & CEO, Tuscany International Drilling
                                  ➢   Founder and a principal of KO Capital Advisors  former Vice Chairman & Co-Head Energy Investment Banking, GMP
       Kevin Overstrom
                                      FirstEnergy
                                  ➢   Former SVP, Corporate and Business Development, Crescent Point Energy  Director of Southern Energy Corp., and Equinor
     Tamara MacDonald
                                      Canada
                                  ➢   Former Chairman & CEO, New Age (African Global Energy) Ltd.  former Executive Director & Officer, Marathon Oil and
        Steve Lowden
                                      Premier Oil

     Elliot S. Weissbluth         ➢   Former Chairman, Hightower Inc.  former Founder, Director & President, U.S. Fiduciary

           August 31, 2021                                                                                                                                     27
DISCLAIMER
Forward Looking Statements                                                                                         from forecasts due to changes in interest rates, oil differentials, exchange rates and the timing
▪      Certain information included in this presentation constitutes forward-looking information under             of expenditures and production additions. In addition, Spartan cautions that current global
       applicable securities legislation. Forward looking information typically contains statements with           uncertainty with respect to the spread of the COVID-19 virus and COVID-19 variant viruses
       words such as "anticipate", "believe", "expect", "plan", "intend", "estimate", "propose", "project"         and their effect on the broader global economy may have a significant negative effect on
       or similar words suggesting future outcomes or statements regarding an outlook. Forward-                    Spartan. While the precise impact of the COVID-19 virus and associated variant viruses on
       looking information in this presentation may include, but is not limited to, statements about:              Spartan remains unknown, rapid spread of the COVID-19 virus and associated variant viruses
       corporate strategy, objectives, strengths and focus of Spartan; the intentions of management                may have a material adverse effect on global economic activity, and can result in volatility and
       and Spartan with respect to its growth strategy and business plan, including production                     disruption to global supply chains, operations, mobility of people and the financial markets,
       increases and the timing thereof; Spartan's expectations regarding its 2021/2022 drilling                   which could affect interest rates, credit ratings, credit risk, inflation, business, financial
       program, including the location of wells, scheduled drilling dates and the timing of expected               conditions, results of operations and other factors relevant to Spartan. Please refer to the
       pay out from such wells; the scale and repeatability of Spartan's drilling inventory; Spartan's             Spartan's most recent Annual Information Form and MD&A for additional risk factors relating to
       intentions to maintain balance sheet flexibility to allow Spartan to take advantage of future               Spartan, which can be accessed either on Spartan's website at www.spartandeltacorp.com or
       opportunities; Spartan's acquisition and consolidation strategy and targets; expected benefits              under the Company's profile on www.sedar.com. Readers are cautioned not to place undue
       from recent acquisitions, including the Velvet Acquisition; Spartan plans to deliver strong                 reliance on this forward-looking information, which is given as of the date hereof, and to not
       operational performance and reduce debt; Spartan's production forecasts; Spartan 2021-2022                  use such forward-looking information for anything other than its intended purpose. Spartan
       guidance and budget, Spartan’s 2022-2024 Three Year Plan including anticipated capital                      undertakes no obligation to update publicly or revise any forward-looking information, whether
       expenditures and Spartan's ability to fund capital expenditures through operating activities;               as a result of new information, future events or otherwise, except as required by law.
       Spartan's cost-cutting measures and the results thereof; Spartan's use of new technologies;             ▪   The forward-looking information contained in this presentation is made as of the date hereof
       Spartan's ESG initiatives, including sustainability targets and Spartan's ability to meet such              and Spartan undertakes no obligation to update publicly or revise any forward-looking
       targets; predictions regarding commodities pricing and industry fundamentals, including natural             information, whether as a result of new information, future events or otherwise, unless required
       gas demand and supply, and the effectiveness of Spartan's risk management strategies in                     by applicable securities laws. The forward looking information contained in this presentation is
       respect thereof; the availability and quantity of tax pools; the continuation of Spartan's strategic        expressly qualified by this cautionary statement.
       partnerships, and expected benefits therefrom. Statements relating to "reserves" are also               ▪   FOFI. This presentation contains future-oriented financial information and financial outlook
       deemed to be forward looking statements, as they involve the implied assessment, based on                   information (collectively, "FOFI") about Spartan's prospective results of operations, production,
       certain estimates and assumptions, that the reserves described exist in the quantities                      working capital, capital efficiency, sustaining capital, capital expenditures, enterprise value,
       predicted or estimated and that the reserves can be profitably produced in the future.                      recycle ratio, payout, operating netback, share price, investment yield, net debt (surplus),
▪      The forward-looking statements contained in this presentation are based on certain key                      adjusted free funds flow, free funds flow, NPV10, NOI, IRR, return of capital, operating costs,
       expectations and assumptions made by Spartan, including expectations and assumptions                        cost reductions and components thereof, all of which are subject to the same assumptions,
       concerning the performance of Spartan's management team and board, the success of future                    risk factors, limitations and qualifications as set forth in the above paragraphs. FOFI contained
       drilling, development and completion activities, the performance of existing wells, the                     in this presentation was approved by management of the date of this presentation and was
       performance of new wells, the availability and performance of facilities and pipelines, the                 provided for the purpose of providing further information about Spartan's anticipated future
       geological characteristics of Spartan's properties, the successful application of drilling,                 business operations. Spartan disclaims any intention or obligation to update or revise any
       completion and seismic technology, prevailing weather and break-up conditions and access to                 FOFI contained in this presentation, whether as a result of new information, future events or
       drilling locations, commodity prices, price volatility, price differentials and the actual prices           otherwise, unless required pursuant to applicable law. Readers are cautioned that the FOFI
       received for products, royalty regimes and exchange rates, the application of regulatory and                contained in this presentation should not be used for purposes other than for which it is
       licensing requirements, the availability of capital, labour and services, Spartan's ability to              disclosed herein.
       complete planned capital expenditures within budgeted cost estimates, the ability to market oil         ▪   Third Party Information. Certain information contained herein has been obtained from
       and gas successfully, Spartan's ability to integrate assets and employees acquired through                  published sources prepared by independent industry analysts and third-party sources
       acquisitions and the creditworthiness of industry partners.                                                 (including industry publications, surveys and forecasts). While such information is believed to
▪      Although Spartan believes that the expectations and assumptions on which the forward-                       be reliable for the purpose used herein, none of the directors, officers, owners, managers,
       looking statements are based are reasonable, undue reliance should not be placed on the                     partners, consultants, shareholders, employees, affiliates or representatives assumes any
       forward-looking statements because Spartan can give no assurance that they will prove to be                 responsibility for the accuracy of such information. Some of the sources cited in this
       correct. Since forward-looking statements address future events and conditions, by their very               presentation have not consented to the inclusion of any data from their reports, nor has
       nature they involve inherent risks and uncertainties. Actual results could differ materially from           Spartan sought their consent.
       those currently anticipated due to a number of factors and risks. These include, but are not
       limited to, stock market volatility, risks associated with the oil and gas industry in general (e.g.,
       operational risks in development, exploration and production; the uncertainty of reserve
       estimates; the uncertainty of estimates and projections relating to production, costs and
       expenses and health, safety and environmental risks), incorrect assessment of the value of
       acquisitions, failure to complete or realize the benefits of acquisitions, constraint in the
       availability of services, commodity price and exchange rate fluctuations, actions of OPEC and
       OPEC+ members, changes in legislation (including but not limited to tax laws, royalty regimes
       and environmental legislation), adverse weather or break-up conditions and uncertainties
       resulting from potential delays or changes in plans with respect to exploration or development
       projects or capital expenditures. Production forecasts are directly impacted by commodity
       prices and the actual timing of our capital expenditures. Actual results may vary materially

                   August 31, 2021                                                                                                                                                                               28
DISCLAIMER CONT’D
Oil and Gas Advisories                                                                                                 scenarios, which helps assess Spartan's ability to generate value.
▪       BOE Disclosure. The term barrels of oil equivalent ("boe") may be misleading, particularly if       ▪          "Finding and development (F&D) cost" is the sum of capital expenditures incurred in the
        used in isolation. A BOE conversion ratio of six thousand cubic feet of natural gas to barrels of              period and the change in future development capital ("FDC") required to develop reserves.
        oil equivalence is based on an energy equivalency conversion method primarily applicable at                    F&D cost per BOE is determined by dividing current period net reserve additions into the
        the burner tip and does not represent a value equivalency at the wellhead. All BOE                             corresponding period's F&D cost. Readers are cautioned that the aggregate of capital
        conversions in this presentation are derived from converting gas to oil in the ratio mix of six                expenditures incurred in the year, comprised of exploration and development costs and
        thousand cubic feet of gas to one barrel of oil.                                                               acquisition costs, and the change in estimated FDC generally will not reflect total FD&A costs
▪       Product Types. Throughout this presentation, "crude oil" or "oil" refers to light and medium                   related to reserves additions in the year.
        crude oil product types as defined by NI 51-101. Condensate is a natural gas liquid as defined      ▪          "NPV10" is the anticipated net present value of the future net operating income after capital
        by National Instrument 51-101 – Standards of Disclosure for Oil and Gas Activities ("NI 51-                    expenditures, discounted at a rate of 10% (before tax).
        101"). References to "natural gas liquids" or "NGLs" throughout this presentation comprise          ▪          Type Curves. The reservoir engineering and statistical analysis methods utilized is broad and
        pentane, butane, propane, and ethane, being all NGLs as defined by NI 51-101 other than                        can include various methods of technical decline analyses, and reservoir simulation all of
        condensate, which is disclosed separately because the value equivalency of condensate is                       which are generally prescribed and accepted by the COGE Handbook and widely accepted
        more closely aligned with crude oil. References to "natural gas" or "gas" relates to                           reservoir engineering practices. These type curves were generated by McDaniel, an
        conventional natural gas.                                                                                      independent qualified reserves evaluator. These type curves incorporate the most recent data
▪       Reserves Disclosure. All reserves information in this press release relating to: (i) Spartan’s                 from actual well results and would only be representative of the specific drilled locations. There
        mid-year reserves update were prepared by McDaniel & Associates Consultants Ltd.                               is no guarantee that Spartan will achieve the estimated or similar results derived therefrom.
        ("McDaniel") effective as of July 1, 2021 (the "Spartan Mid-Year Report"); and (ii) the Velvet      ▪          Drilling Locations / Inventory. This presentation discloses drilling inventory in three categories:
        Assets were prepared by McDaniel for Velvet, effective July 1, 2021 (the "Velvet Report"), in                  (i) proved locations; (ii) probable locations; and (iii) unbooked locations. Proved locations and
        accordance with NI 51-101 and the COGE Handbook. The estimates of reserves for the                             probable locations are derived from the Spartan Mid-Year Report and the Velvet Report and
        Ferrier Acquisition is an internal estimate made by the Company and may not reflect the same                   account for drilling locations that have associated proved and/or probable reserves, as
        confidence level as estimates of reserves and future net revenue for all of Spartan's                          applicable. Unbooked locations are internal estimates based on our prospective acreage and
        properties. All reserve references in this presentation are "Company share reserves".                          an assumption as to the number of wells that can be drilled per section based on industry
        Company share reserves are the applicable company's total working interest reserves before                     practice and internal review. Unbooked locations do not have attributed reserves or resources.
        the deduction of any royalties and including any royalty interests payable to the company. It       ▪          Unbooked locations have been identified by management as an estimation of our multi-year
        should not be assumed that the present worth of estimated future amounts presented in the                      drilling activities based on evaluation of applicable geologic, seismic, engineering, production
        tables above represents the fair market value of the reserves. There is no assurance that the                  and reserves information. There is no certainty that we will drill all unbooked drilling locations
        forecast prices and costs assumptions will be attained, and variances could be material. The                   and if drilled there is no certainty that such locations will result in additional oil and gas
        recovery and reserve estimates of the crude oil, natural gas liquids and natural gas reserves                  reserves, resources or production. The drilling locations on which we drill wells will ultimately
        provided herein are estimates only and there is no guarantee that the estimated reserves will                  depend upon the availability of capital, regulatory approvals, seasonal restrictions, oil and
        be recovered. Actual crude oil, natural gas and natural gas liquids reserves may be greater                    natural gas prices, costs, actual drilling results, additional reservoir information that is obtained
        than or less than the estimates provided herein. All evaluations and summaries of future net                   and other factors. While certain of the unbooked drilling locations have been de-risked by
        revenue are stated prior to the provision for interest, debt service charges or general and                    drilling existing wells in relative close proximity to such unbooked drilling locations, other
        administrative expenses and after deduction of royalties, operating costs, estimated well                      unbooked drilling locations are farther away from existing wells where management has less
        abandonment and reclamation costs and estimate future capital expenditures.                                    information about the characteristics of the reservoir and therefore there is more uncertainty
▪       Oil and Gas Metrics. This presentation contains metrics commonly used in the oil and natural                   whether wells will be drilled in such locations and if drilled there is more uncertainty that such
        gas industry which have been prepared by management, such as "development capital", "F&D                       wells will result in additional oil and gas reserves, resources or production.
        costs", "operating netback", "recycle ratio", "payout", "F&D costs" and "NPV10". These terms
        do not have a standardized meaning and may not be comparable to similar measures
        presented by other companies, and therefore should not be used to make such comparisons.
        Management uses these oil and gas metrics for its own performance measurements and to                                                                             Tota l          Proved          Proba bl e       Unbooked
        provide shareholders with measures to compare our operations over time. Readers are                                                                             Loca ti ons      Loca ti ons      Loca ti ons      Loca ti ons
        cautioned that the information provided by these metrics, or that can be derived from the
        metrics presented in this presentation, should not be relied upon for investment or other           Ferri er Acqui s i ti on                                        12                3                3                 6
        purposes.                                                                                           Spa rta n Deep Ba s i n (s pi ri t ri ver + ca rdi um)          419              62                20              337
▪       "Development capital" means the aggregate exploration and development costs incurred in
                                                                                                            Spa rta n Montney                                               353              60                17              275
        the financial year on reserves that are categorized as development. Development capital
        excludes capitalized administration costs.                                                          Vel vet Montney (Vendor booki ngs )                             732              159               45              528
▪       "Undeveloped F&D costs" are calculated as the sum of development capital, divided by the            Tota l Montney *                                               1085              60                17              1007
        undeveloped reserves at the proved undeveloped and proved plus probable undeveloped
                                                                                                            * Note: Spartan has not updated reserves since the Velvet acquisition and thus wells booked by the vendor have not been
        levels.
▪       "Operating netback" see "Non-GAAP Measures".                                                        included in Spartans Proved or Probable location count and are included in the unbooked category until a reserves update has
▪       "Recycle ratio" is measured by dividing operating netback by F&D cost per boe for the year.         been complete.
▪       "Payout" is achieved when revenues, less royalties, production and transportation costs are
        equal to the total capital costs associated with drilling, completing, equipping and tying in a
        well. Management considers payout an important measure to evaluate its operational
        performance and capital allocation processes. It demonstrates the return of cash flow and
        allows Spartan to understand how a capital program is funded under different operating

                   August 31, 2021                                                                                                                                                                                                       29
DISCLAIMER CONT’D
Non-GAAP Measures                                                                                             where "Market Capitalization" is defined as the total number of common shares outstanding
▪     This presentation contains certain financial measures, as described below, which do not have            multiplied by the price per share at a given point in time.
      standardized meanings prescribed by IFRS or Generally Accepted Accounting Principles                ▪   "EV/DACF" is the enterprise value divided by the debt adjusted cash flow and is used as a
      ("GAAP"). As these non-GAAP financial measures are commonly used in the oil and gas                     measurement of the value of the company.
      industry, the Company believes that their inclusion is useful to investors. The reader is           ▪   "Sustaining / maintenance capital" is the estimated capital required to bring on new
      cautioned that these amounts may not be directly comparable to measures for other                       production which offsets the natural decline of the existing production and keeps the year-
      companies where similar terminology is used. The non-GAAP measures used in this                         over-year production flat.
      presentation, represented by the capitalized and defined terms outlined below, are used by          ▪   "Capital efficiency" is the amount spent to add an additional barrel a day of production to a
      Spartan as key measures of financial performance and are not intended to represent operating            company's annual exit production.
      profits nor should they be viewed as an alternative to cash provided by operating activities, net   ▪   "Internal rate of return (IRR)" is the discount rate required to arrive at an NPV equal to zero.
      income or other measures of financial performance calculated in accordance with IFRS.                   Rates of return set forth in this presentation are for illustrative purposes. There is no guarantee
▪     "Operating Income (Loss)" abbreviated as "NOI" is calculated by deducting operating and                 that such rates of return will be achieved in the future.
      transportation expenses from total revenue, after realized gains or losses on commodity price       ▪   “Payout Ratio” is the ratio derived from total capital expenditures net of acquisitions and
      derivative financial instruments. Total revenue is comprised of oil and gas sales, net of               divestitures divided by Adjusted Funds Flow.
      royalties, plus processing and other revenue. The Company refers to Operating Income (Loss)         ▪   “Total Return” or “Total Shareholder Return” is calculated as the sum of Free Funds Flow
      expressed per unit of production as an "Operating Netback". "Run Rate NOI" is calculated                Yield and YoY Production Growth.
      based on annualized production and Operating Netback figures. Where a non-IFRS or IFRS              ▪   “Return On Average Capital Employed” is calculated as unhedged cash flow less Peters
      measure in this presentation is qualified by the words "run rate", it represents the "pro forma"        estimate of required capital spending to maintain flat production volumes YoY, expressed as a
      figure as adjusted to give effect to the Acquisitions. Spartan considers Run Rate NOI as an             percentage of capital employed. Capital employed is defined as average shareholder’s equity
      important measure to illustrate how the Corporation would have performed if the Acquisitions            excluding impairment plus net debt.
      had been consummated at the start of the period.                                                    ▪   US Disclaimer. This presentation is not an offer of the securities for sale in the United States.
▪     "Funds from Operations" is calculated as cash provided by (used in) operating activities                The securities have not been registered under the U.S. Securities Act of 1933, as amended,
      before changes in non-cash working capital.                                                             and may not be offered or sold in the United States absent registration or an exemption from
▪     "Adjusted Funds from Operations" is calculated by adding back transaction costs on                      registration. This presentation shall not constitute an offer to sell or the solicitation of an offer
      acquisitions and settlements of decommissioning obligations to Funds from Operations.                   to buy nor shall there be any sale of the securities in any state in which such offer, solicitation
      Adjusted Funds from Operations can also be calculated by deducting general and                          or sale would be unlawful.
      administrative and interest expenses (net of interest income) from Operating Income (Loss).
      Spartan's "Corporate Netback" is equal to Adjusted Funds from Operations expressed per
      unit of production.
▪     "Adjusted Funds Flow (AFF)" is calculated by deducting settlements of decommissioning
      obligations and lease payments from Adjusted Funds from Operations. The Company believes
      Adjusted Funds Flow is an appropriate metric to compare relative to Net Debt because it
      reflects the net cash flow generated from routine business operations and because Spartan
      does not include lease liabilities in its definition of Net Debt (Surplus).
▪     "Free Funds Flow (FCF)" is calculated as Adjusted Funds Flow less total net capital
      expenditures, excluding acquisitions. Spartan believes Free Funds Flow provides an indication
      to investors and Spartan shareholders of the amount of funds the Company has available for
      future capital allocation decisions.
▪     “Asset Level FCF” is calculated as the NOI generated by a specific asset less the total net
      capital expenditures allocated to the specific asset.
▪     “Free Funds Flow (FCF) Yield” is calculated as Adjusted Funds Flow less total net capital
      expenditures, excluding acquisitions divided by the Company’s Market Capitalization using 167
      million treasury stock fully diluted shares outstanding.
▪     “Adjusted Funds Flow Per Share (CFPS)” and “Free Funds Flow Per Share (FCFPS)” is
      used to estimate accretion on Adjusted Funds Flow(CF) and Free Funds Flow(FCF) and are
      calculated based on 167 million treasury stock fully diluted shares outstanding at the end of
      the period.
▪     "Net Debt (Surplus)" includes bank debt, net of Adjusted Working Capital. "Adjusted
      Working Capital" is calculated as current assets less current liabilities, excluding derivative
      financial instrument assets and liabilities and lease liabilities. As at December 31, 2020 and
      2019, the Adjusted Working Capital deficit (surplus) includes cash and cash equivalents,
      accounts receivable, prepaid expenses and deposits, accounts payable and accrued liabilities
      and the current portion of decommissioning obligations. Spartan uses Net Debt (Surplus) as a
      measure of the Company's financial position and liquidity, however it is not intended to be
      viewed as an alternative to other measures calculated in accordance with IFRS.
▪     "Enterprise value" is calculated as the Market Capitalization of the Company plus Net Debt,

                  August 31, 2021                                                                                                                                                                               30
PRICE DECK DETAILS
 August 31, 2021 guidance update pricing & 3-year plan pricing

 All guidance, forecasts and economics are based on the following budget price deck (unless otherwise stated):

                                                                  H2 2021                2021                    2022   2023     2024
Benchmark Prices
AECO Gas                                    C$/GJ                 $3.98                 $3.45                $3.25      $2.75    $2.75
WTI                                        US$/bbl                $70.62                $66.21               $60.00     $60.00   $60.00
Edmonton Cond Differential                 US$/bbl                ($0.80)               ($0.22)              $1.00      $1.00    $1.00
Edmonton Cond.                              C$/bbl                $89.52                $83.14               $75.52     $75.52   $75.52
Edmonton Oil Differential                  US$/bbl                $3.91                 $4.03                $4.00      $4.00    $4.00
Edmonton Oil                                C$/bbl                $83.61                $77.82               $71.68     $71.68   $71.68
Conway Propane                             US$/Gal                $1.10                 $0.99                $0.90      $0.90    $0.90
FX                                         US$/C$                  1.253                 1.251                1.280      1.280    1.280
NYMEX Gas                                US$/MMBTu                $4.07                 $3.86                $3.42      $2.97    $2.92
NYMEX AECO Basis                         US$/MMBtu                 0.72                  0.85                 0.74       0.71     0.66

               August 31, 2021                                                                                                            31
ABBREVIATIONS

 AECO           Alberta Energy Company “C” Meter Station of the NOVA Pipeline System
 ARO            Asset Retirement Obligations
 b              Basic shares outstanding
 bbl; bbl/d     barrel; barrels per day
 bcf; bcf/d     Billion cubic feet of natural gas; billion cubic feet per day of natural gas
 boe; boe/d     Barrels of oil equivalent; barrels of oil equivalent per day
 cf/d           cubic feet per day of natural gas
 DCET           Drill, complete, equip and tie-in capital cost
 ESG            Environmental, Social and Governance
 EUR            Estimated ultimate recovery (see disclaimers)
 EV/DACF        Enterprise value divided by the debt adjusted cash flow (see disclaimers)
 F&D            Finding and development cost per barrel of oil equivalent (see disclaimers)
 f.d.           Fully diluted shares outstanding
 FCF            Free Cash Flow (see disclaimers)
 FX             Exchange rate: US Dollars divided by Canadian Dollars
 G&A            General and administrative expense
 GJ             Gigajoules
 IFRS           International Financial Reporting Standards as issued by the International Accounting Standards Board (“IASB’)
 IRR            Internal rate of return percentage (see disclaimers)
 LMR            Liability Management Rating (Alberta)
 M or m         Thousand
 MM or mm       Million
 NGLs           Natural Gas Liquids
 NOI            Net Operating Income (see disclaimers)
 NPV10          Net Present Value with a discount rate of 10% (see disclaimers)
 PDP            Proved Developed Producing Reserves
 SDE            Trading symbol for Spartan Delta Corp. common shares on the TSX Venture Exchange
 TP             Total Proved Reserves
 TV             Total Value or Total Net Consideration
 WTI            West Texas Intermediate Oil Price (US$/bbl)

         August 31, 2021                                                                                                         32
You can also read