Investor Relations May 2021

Page created by Willie Castillo
 
CONTINUE READING
Investor Relations May 2021
Investor Relations
May 2021
Investor Relations May 2021
Forward-Looking Statements
This presentation contains “forward-looking statements” within the meaning of the federal securities laws. All statements other than statements of historical facts are
forward-looking statements. Forward-looking statements include information concerning the impact of the COVID-19 pandemic on our industry, our dealer customers and
our results of operations, our business strategies, strategic alternatives, plans and objectives, market potential, outlook, trends, future financial performance, planned
operational and product improvements, potential strategic transactions, liquidity, including draws from our revolving credit facility, expense management and other
matters and involve known and unknown risks that are difficult to predict. As a result, our actual financial results, performance, achievements, strategic actions or prospects
may differ materially from those expressed or implied by these forward-looking statements. These statements often include words such as “believe,” “expect,” “project,”
“anticipate,” “outlook,” “intend,” “strategy,” “plan,” “estimate,” “target,” “seek,” “will,” “may,” “would,” “should,” “could,” “forecasts,” “mission,” “strive,” “more,” “goal” or similar
expressions. Forward-looking statements are based on our current expectations, beliefs, strategies, estimates, projections and assumptions, based on our experience in the
industry as well as our perceptions of historical trends, current conditions, expected future developments, current developments regarding the COVID-19 pandemic and
other factors we think are appropriate. Such forward-looking statements are necessarily based upon estimates and assumptions that, while considered reasonable by the
Company and its management based on their knowledge and understanding of the business and industry, are inherently uncertain. These statements are expressed in
good faith and we believe these judgments are reasonable. However, you should understand that these statements are not guarantees of strategic action, performance or
results. Our actual results and strategic actions could differ materially from those expressed in the forward-looking statements. Given these uncertainties, forward-looking
statements should not be relied on in making investment decisions. Comparisons of results between current and prior periods are not intended to express any future trends,
or indications of future performance, unless expressed as such, and should only be viewed as historical data. Whether or not any such forward-looking statement is in fact
achieved will depend on future events, some of which are beyond our control.

Forward-looking statements are subject to a number of risks, uncertainties and other important factors, many of which are beyond our control, that could cause our actual
results and strategic actions to differ materially from those expressed in the forward-looking statements contained in this presentation. For a detailed discussion of many of
these and other risks and uncertainties, see our Annual Report on Form 10-K, our Quarterly Reports on Form 10-Q, our Current Reports on Form 8-K and our other filings with
the Securities and Exchange Commission, available on our website at investor.cars.com or via EDGAR at www.sec.gov. All forward-looking statements contained in this
presentation are qualified by these cautionary statements. You should evaluate all forward-looking statements made in this presentation in the context of these risks and
uncertainties. The forward-looking statements contained in this presentation are based only on information currently available to us and speak only as of the date of this
presentation. We undertake no obligation, other than as may be required by law, to update or revise any forward-looking or cautionary statements to reflect changes in
assumptions, the occurrence of events, unanticipated or otherwise, or changes in future operating results over time or otherwise.

The forward-looking statements in this presentation are intended to be subject to the safe harbor protection provided by the federal securities laws.
Investor Relations May 2021
Definitions: Non-GAAP Financial Measures
This presentation discusses Adjusted EBITDA, Adjusted EBITDA Margin, and Free Cash Flow. These financial measures are not prepared in accordance with generally
accepted accounting principles in the United States (“GAAP”). These financial measures are presented as supplemental measures of operating performance because we
believe they provide meaningful information regarding our performance and provide a basis to compare operating results between periods. In addition, we use Adjusted
EBITDA as a measure for determining incentive compensation targets. Adjusted EBITDA also is used as a performance measure under our credit agreement and includes
adjustments such as the items defined below and other further adjustments, which are defined in the credit agreement. These non-GAAP financial measures are frequently
used by our lenders, securities analysts, investors and other interested parties to evaluate companies in our industry. For a reconciliation of the non-GAAP measures
presented in this presentation to their most directly comparable financial measure prepared in accordance with GAAP, see “Non-GAAP Reconciliations” below.

Other companies may define or calculate these measures differently, limiting their usefulness as comparative measures. Because of these limitations, these non-GAAP
financial measures should not be considered in isolation or as substitutes for performance measures calculated in accordance with GAAP. Definitions of these non-GAAP
financial measures and reconciliations to the most directly comparable GAAP financial measures are presented in the tables below.

We define Adjusted EBITDA as net income (loss) before (1) interest expense, net, (2) income tax (benefit) expense, (3) depreciation, (4) amortization of intangible assets, (5)
stock-based compensation expense, (6) unrealized mark-to-market adjustments and cash transactions related to derivative instruments, and (7) certain other items, such
as transaction-related costs, severance, transformation and other exit costs and write-off and impairments of goodwill, intangible assets and other long-lived assets.

Transaction-related costs are certain expense items resulting from actual or potential transactions such as business combinations, mergers, acquisitions, dispositions,
spin-offs, financing transactions, and other strategic transactions, including, without limitation, (1) transaction-related bonuses and (2) expenses for advisors and
representatives such as investment bankers, consultants, attorneys and accounting firms. Transaction-related costs may also include, without limitation, transition and
integration costs such as retention bonuses and acquisition-related milestone payments to acquired employees, in addition to consulting, compensation and other
incremental costs associated with integration projects.

We define Free Cash Flow as net cash provided by operating activities less capital expenditures, including purchases of property and equipment and capitalization of
internal-use software and website development costs.
Investor Relations May 2021
Who We Are
Investor Relations May 2021
Our Mission
Driving The Future
Of Automotive Retail

Become the largest digital automotive
marketplace and platform powering innovative
solutions and frictionless omni-channel
experiences for buyers and sellers
Investor Relations May 2021
At the Heart of our Business is a
                                                           Vibrant Marketplace
    Consumer Challenges                                                         The Solution                                                                                       Dealer Challenges
•    Too many options                                                           •     600MM annual visits²                                                                         •   Growing customer
•    Price opacity & distrust                                                                                                                                                          expectations
                                                                                •     3.7MM new & used vehicle listings²
•    Inconvenient,                                                                                                                                                                 •   Inefficient advertising
                                                                                •     Trusted, objective editorial content
     broken shopping experience                                                                                                                                                    •   Disruption from
                                                                                •     Price transparency & comparisons
•    Gaps in online-to-offline                                                                                                                                                         online dealers
                                                                                •     10MM+ vehicle, dealership & salesperson reviews
     experience                                                                                                                                                                    •   Too many
                                                                                                                                                                                       disparate solutions

                                                                          1500+                         42K+ Multiple
                                                                          models/trims
                                                                                                        Dealers¹                Automotive                     30+
                                                                                                                                  Digital                       OEMS
                                                                           per year                                             Destinations

                                                                                 We’re here to make car-buying simple

          125.8K independent US car dealerships per 2020 Borrell Automotive Advertising Outlook report, and 16.6K franchised dealers per National Automobile Dealers Association
          ²As of Full Year/Q4 2020
Investor Relations May 2021
Our Strategy                                                         Traffic
Traffic   Dealers   Vehicle Listings   More Traffic   More Dealers

A flywheel of dealers driving vehicle listings, vehicle
listings driving traffic & data, traffic & data attracting           Flywheel
dealers defines our digital solutions platform
Investor Relations May 2021
CARS is more than
just a marketplace
CARS enables local retail & helps dealers stay
at the center of the automotive ecosystem

Dealer Challenges

● Growing customer expectations
● Too many disparate “solutions”
● Inefficient advertising strategy and spending
● Disruption from online dealers
Investor Relations May 2021
Durable Brand and Subscription Based Model
                                   Yields Strong Recurring Revenue
                                                                       Overview                                                       Revenue mix1                                Target partners

                                             •   18K+ dealer customers list new and used
                                                 inventory on Cars.com on a subscription basis
   Direct                                    •   Solutions include Dealer Inspire website
     ●   Cars.com                                products, FUEL in market video and
         Dealer Inspire
                                                                                                                                            85%
     ●
                                                 DealerRater review platform
     ●   Dealer Rater
         Conversations                       •   Targeting market leading franchised dealers,
     ●
     ●   FUEL                                    dealer groups and independent dealers
                                                                                                                                                                                      42K+2
                                                                                                                                                                                     Dealers
                                             •   Monthly ARPD of $2,2641

                                                                                                                                                                                                      $548mm
                                             •   Nearly all OEMs as well as auto adjacent                                                                                                             2020 Revenue
                                                 companies advertise with CARS
   National                                  •   Long-term relationships cultivated
   Advertising                                   with target partners
                                                                                                                                             13%
     ●   Cars.com                            •   Solutions range from performance marketing
         Fuel
     ●                                           to value-add solutions like lead generation,                                                                                           OEMs
                                                 CPO programs and FUEL in market video

Note: 2% of revenue is related to “Other Revenue” which consists of data-driven solutions and revenue partnerships; 1 Q4 2020;
2 25.8K independent US car dealerships in 2019 per 2020 Borrell Automotive Advertising Outlook report, and 16.6K franchised dealers as of June YTD 2020 per National Automobile Dealers Association
Investor Relations May 2021
CARS Extending Beyond the Marketplace
           Durable, Category Leading Brand Supporting a 20+ Year History of Innovative Solutions

                                                                                                                                              2021

                                                                                                                 2020
                                                                                                                                             • Will complete tech
                                                                                                                                               replatforming
                                                                                       2019                      • Launches FUEL In-           which will allow for
                                                                                                                   Market Video                nimble product
                                                                                                                                               development
                                                               2018                   • Completes all
                                                                                        affiliate conversions;   • Repositions the
                                                                                                                   business on a             • Will support a
                                                                                        dealers served
                                                                                                                   growth trajectory           frictionless end-to-
                                          2017                • Acquires Dealer         by direct sales team
                                                                Inspire,                                                                       end transaction
                                                                a disruptive,         • Selected by GM           • Accelerates online          from search to
                            2016                                innovative digital      as semi-exclusive          selling tools and           signature for both
                                          Cars.com spins                                                           support for dealers         our customers and
                                                                solutions provider      website provider
                                          off as a publicly                                                        affected by COVID-19        consumers
                                                                                        available to GMs
           2014                           traded company
                            Acquires                          • Launches Cars           4,000+ dealers
                                          under ticker                                                           • Refinances capital
                            DealerRater                         Social, and AI Chat
                                          NYSE: CARS                                                               structure, increasing
1998       Classified                                                                 • Launches
                                                              • Accelerates             AutoCorrected              flexibility for organic
           Ventures sells
                                                                transition of           and Roxanne                and inorganic
           Cars.com to
Cars.com                                                        former affiliates                                  investments
           Gannett, Inc.
founded                                                         McClatchy & tronc
CARS at a Glance
                               Our Company Today: Scaled Dealer Solutions Platform with Unparalleled Brand

                                                                  $548MM                                                   $156MM                  / 28%                      $122MM
                                                                         FY 2020                                                      FY 2020                                     FY 2020
                                                                         Revenue                                                Adj. EBITDA / margin                           Free cash flow
  CARS
  has scale
                                                                    600MM                                                           18,372                                  Nearly all
                                                                      FY 2020 visits                                              Dealer customers⁶                        of OEMs are customers

  CARS is                                                               ~85%                                                         10MM                                         73%
  influential                                                  Visitors plan to purchase
                                                                    within 6 months1
                                                                                                                                         reviews                           of our traffic is organic2

                                                                                                                                           #1
  CARS is the                                                               #1                                                                                                       #1
  gold standard                                                    Brand awareness3
                                                                                                                              Top downloaded online
                                                                                                                              auto marketplace app4
                                                                                                                                                                        Highest rated mobile platform5

Note: See the appendix for a reconciliation of Non-GAAP financial measures.
1 CARS internal data as of June 2020; 2 Q4 2020: Direct + App + SEO; 3 Millward Brown as of December 2020; total brand awareness shown among CARS’ competitive set;
4Downloads versus peers, per App Annie as of December 2020; 5 CARS has the highest Apple App Store rating among peers at 4.8/5.0 as of October 2020 ⁶As of 12/31/2020
Investment Highlights
             01. Significant Headroom in Large and Fragmented Addressable Market

             02. Leading Brand¹ with Strong Organic Traffic

            03. Well Positioned to Benefit from Accelerating Shift to Digital Automotive Solutions

            04. Resilient Business Model With Attractive Free Cash Flow Profile and Strong Balance Sheet

            05. Experienced Management Team

            06. Well Positioned to Lead into the Future of Digital Automotive Buying

¹Millward   Brown as of December 2020; total brand awareness shown among CARS’ competitive set
01

Significant
Headroom in Large
Addressable Market
Dealer TAM2
Significant
Headroom in Large                                                                                                               42k                                     26k                                      16k

Addressable Market
    ●     With over 40k dealerships in the
          U.S. we have ample room to
          continue to grow our customer base

    ●     Our large dealer base provides us
          a platform to sell new products & solutions

                                                                                                                            All auto                             Independent                               Franchised
    ●     Dealers typically subscribe to multiple                                                                         dealerships                             dealerships                              dealerships
          marketplaces in order to maximize the
          visibility of their inventory                                                                                       Current CARS penetration1

1   12/31/2020; 2 25.8K independent US car dealerships in 2019 per 2020 Borrell Automotive Advertising Outlook report, and 16.6K franchised dealers as of June YTD 2020 per National Automobile Dealers Association

                                                                                                                                                                                                                         14
Car Ownership Trends Remain Durable
                                                     Strong Demand for Car Ownership

                        SAAR: New Vehicle Sales (in millions)                         New Vehicle Sales, Unadjusted (in millions)

Source: U.S. Bureau of Economic Analysis                                Source: U.S. Bureau of Economic Analysis

                                                                                                                                    15
Dealers Spend 4X More on Digital Solutions2
Tapping into
More than Just
Advertising Budgets
                                                                                                                 2,500,000

                                                                                                                 2,000,000
WE CAPTURE LESS THAN 2%
OF U.S. AUTO ADVERTISING                                                                                          1,500,000

● $33B is spent in Automotive Advertising                                                                         1,000,000

     in the U.S. growing at 2% CAGR1
                                                                                                                   500,000

● $21B is spent in Digital,
                                                                                                                              0
     projected to grow at a 4% CAGR1
                                                                                                                                    Advertising: $0.6M   Digital Marketing: $2.3M

                                                                                                          ●   Typical dealer spends ~4x more on digital marketing services
                                                                                                              than advertising
                                                                                                          ●   Average Dealer Spends $2.9M/year

1. Based on Borrell Outlook 2020; 2 Based on Borrell Outlook 2020; Average spending for U.S. car dealer with 135 employees
02

Leading Brand
with Strong
Organic Traffic
Strong Brand Drives Marketing Efficiencies
                                           We Spend Half as Much in Advertising as our Largest Competitor

                                                                                                74% of Traffic Generated Organically
                Cars.com is #1 in total brand awareness1
                                                                                                      Q1 2021 CARS Traffic Breakdown

                                                                                                         PAID            DIRECT
                                                                                                         26%             26%

                                                                                                        APP              SEO
                                                                                                        22%              26%

1   Millward Brown as of August 2020; total brand awareness shown among CARS’ competitive set

                                                                                                                                       18
Strong Brand Supports Traffic Growth
           Record 600MM visits in 2020

                Cars.com Total Traffic

 600MM

 400MM
                                                   14%
                                                   CAGR

 200MM

         2017         2018           2019   2020

                                                          19
03

Well Positioned to Benefit
From Accelerating Shift to
Digital Automotive Solutions
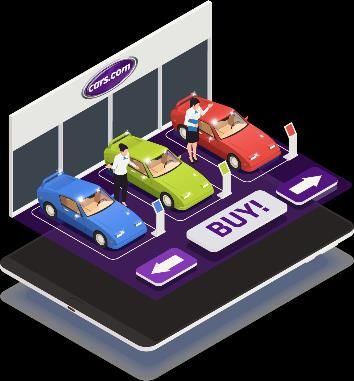
Solutions Connect Car Shoppers with Dealers
                        We Help our Customers, OEMs and Dealers, Reach Their Customers, Car Shoppers

Marketplace              Cars Social             FUEL-IMV                DealerRater              Dealer Inspire         Conversations          Online Shopper
Listings                                                                                          Websites
                         Allows dealers to       Delivers video ads to   Allows local car                                Powerful A.I.          Provides consumers
                         power their own         local in-market         shoppers to discover,    Award winning,         messaging platform     with advanced payment
Customized marketing
                         dynamic social ads      shoppers on their       meet and recommend       custom designed        that centralizes       options, resulting in
and customer                                                                                      website platforms
acquisition solutions    leveraging Cars.com’s   device of choice        a dealership’s team,     supporting highly      customer               higher intent, higher
                         pure, first-party       leveraging Cars.com’s   improving our            personalized digital   communication,         quality and faster-to-
                         audience data           pure, first-party       customers’ reputations   campaigns              improves quality and   close leads for dealers.
                                                 audience data           and building authentic                          speed of response
                                                                         relationships                                   time, and decreases
                                                                                                                         operating costs

                        DISCOVER & SHOP                                                             CONNECT                                              BUY
Dealer Inspire Growth Supported by OEM Partnerships

                Dealer Inspire Website Customers

                                                   Achieved

                                                   4,700
                                                    Website
                                                   Customers

                                                               22
Dealer Inspire Growth Supported by OEM Partnerships

               Conversations™ Units Live (Online Chat)                                  Online Shopper™ Units Live (Digital Retailing)

                                                                   27%
                                                                Penetration*                                                          20%
                                                                                                                                    Penetration*
   1,250                                                                       1,000

              25%
   1,000   Penetration*
                                                                                750
                                                                                          14%
                                                                                       Penetration*
    750

                                                                                500

    500

                                                                                250
    250

      0                                                                           0
              12/31/19      3/31/20      6/30/20      9/30/20      12/31/20               12/31/19    3/31/20   6/30/20   9/30/20      12/31/20

* Penetration rates calculated as units/website customers

                                                                                                                                                   23
MAXIMIZE ROI ON
                                                       IN-MARKET SHOPPERS
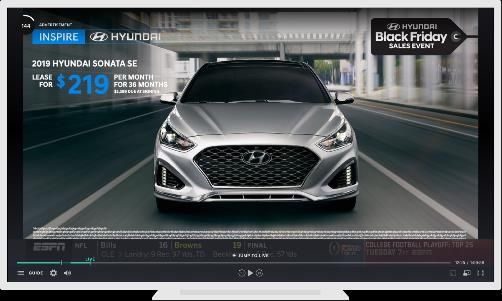
FUELing Future Growth and                                At any given time, a small

ARPD through New Products
                                                       percentage of households in a
                                                     market are serious about buying a
                                                    car — but we know who they are. By
                                                     leveraging audience data from the
                                                          most popular automotive
             Unlock the power of in-market video     marketplace, FUEL ads only target
             and unprecedented audience targeting           in-market shoppers
                                                                                               LAUNCH A FUEL
                                                                                             AUDIENCE TAKEOVER
• Subscription-like model connecting dealers                                             We reach the target audience across
  directly to in-market shoppers through a                                               the devices and platforms they watch
                                                                                                  video on every day.
  customized video marketing platform                                                       FUEL analyzes the ad frequency
                                                                                           needed to move the needle in the

• Launched in February 2020                                                               market, and takes over screens until
                                                                                           shoppers in the area can’t think of
                                                                                              anywhere else to buy a car
CARS’ Innovative Solutions Promote At-Home Shopping
                                Supporting consumers desire to shop when, where & how they want to shop

Home Delivery &
Virtual Appointment                                                                                Conversations
• Making dealer inventory                                                                       • Advanced messaging solution instantly
 accessible for home delivery                                                                     connects customers to dealers 24/7
                                                                                                • Seamless texting between dealer
                                                                                                  and customer, desktop and mobile,
                                                                                                  and tracked in the dealer’s CRM

                                                             Keeping Sellers
                                                            Selling in a Socially
                                                             Distanced World
         Online Shopper                                                                          OEM Partnerships

• Seamless end-to-end                                                                          • OEMs working directly with CARS
   digital retailing solution                                                                     editorial teams to deliver the most
                                                                                                  relevant content in real time
• Enables saving, customizing
   and comparing payments for                                                                  • Support for virtual test drives, real-time
   online listings in minutes                                                                     incentives, and shopper guidance

                                                                                                                                              25
04

Resilient Business
Model With Attractive
Free Cash Flow Profile
and Strong Balance Sheet
Substantial Liquidity and Financial Flexibility

                       Recurring         •   Subscription model
                        revenue          •   Diversified customer base
                                                                                            With our significant
                                                                                            cash flow, we plan to
                                         •   Asset Light
                                                                                          • Invest in internal innovation
                       Strong free       •   Minimal working capital needs
                        cash flow                                                         • De-lever our balance sheet
                                         •   Low cash taxes due to tax-deductible
                                             intangible amortization, NOL & tax credits   • Pursue opportunistic
                                                                                            M&A to accelerate growth

                                         •   $145mm term loan and $400mm notes1
                    Flexible and solid   •   $54mm cash1 & $230mm undrawn on
                      balance sheet          revolving credit facility1
                                         •   2.9x net leverage1

1   As of 3/31/21

                                                                                                                            27
Recurring Subscription Revenue From Diversified Customer Base

                                   Revenue Mix                                                              No One Customer Drives the Business1

                                   $548mm
                                   2020 Revenue                                                             5%                          25%

                          Includes marketplace
                                                                                                       5% of CARS dealers           25% of CARS dealers
                     subscriptions and digital solutions                                                  (~1,000 dealers)              (~5,000 dealers)

                                                                                                       Generate ~20% of             Generate ~60% of
                   Non-recurring 15%                Subscriptions 85%
                                                                                                        CARS Revenue                 CARS Revenue

1   Based on total number of dealers invoiced over the course of the twelve months ended August 2020

                                                                                                                                                           28
Attractive Free Cash Flow Profile
                                                       Free Cash Flow conversion rate of 78% for Full Year 2020
                                                                                                    $ in Millions

                                    $40.0                                                                                                       120%

                                    $35.0                                                                                                       100%

                                    $30.0
                                                                                                                                                80%
                                    $25.0

                                    $20.0                                                                                                       60%

                                     $15.0
                                                                                                                                                40%
                                     $10.0
                                                                                                                                                20%
                                      $5.0

                                          $-                                                                                                    0%
                                                       Q1                Q2                Q3        Q4       Q1         Q2        Q3     Q4
                                                      2019              2019              2019      2019     2020       2020      2020   2020
                                                                                  Free Cash Flow           % of Adjusted EBITDA

Reconciliations of non-GAAP financial measures can be found in the appendix of this presentation.

                                                                                                                                                       29
05

Experienced
Management Team
Led by an Experienced, Diverse Leadership Team

  Alex Vetter            Sonia Jain                Doug Miller            Jim Rogers            D.V. Williams          Joe Chura
Chief Executive        Chief Financial            Chief Revenue           Chief Legal           Chief People         Co-Founder /
    Officer                Officer                   Officer                Officer                Officer        CEO of Dealer Inspire

      Jandy Tomy                  Dean Evans                   Marita Thomas                Fred Lee            Brooke Skinner Ricketts
     Vice President,               Executive               Chief Communications         Chief Technology        Chief Experience Officer
       Treasurer                 Vice President                    Officer                   Officer
Driving Long-term Value Creation through ESG
                                  CARS has made significant progress on various Environmental, Social and
                                Governance initiatives with plans to continue momentum into 2021 and beyond
                 Environmental                                                         Social                                     Governance

●   Online marketplace business model                                 ●   Established DE&I metrics tied to           ●   Added ESG oversight by
    created to replace environmentally                                    Executive Compensation program                 Nominating & Governance Committee
    disruptive print products                                         ●   Established partnerships with NAMAD1       ●   Established DE&I metrics to influence
●   Transitioning to AWS cloud in 2021 will                               and Women in Auto to further                   the CARS Executive Team’s
    reduce energy footprint                                               representation in the industry                 compensation
●   Offering tools to help shoppers filter for                        ●   Monitoring employee satisfaction with      ●   Committed to increased Board diversity
    hybrids and electric vehicles                                         biannual surveys that garner over 80%      ●   Implemented best practices for our
●   Recycling programs are in place to                                    employee participation                         Board of Directors, including:
    reduce waste                                                      ●   Reshaped talent acquisition practices to        ● 90% Board independence
                                                                          further encourage diverse hiring                ● 100% independent committees
                                                                      ●   Increased career development &
                                                                          training by at least 25%, including
                                                                          offering Unconscious Bias training
                                                                          quarterly
                                                                      ●   Established Employee Resource Groups
                                                                          & mentorship program

     1 NAMAD:   National Association of Minority Automobile Dealers
                                                                                                                                                                  32
06

Well Positioned to
Lead into the Future
Of Digital Automotive Buying
2021 Strategy: Building Blocks for Our Future

Best-in-Class Brand   Product Solutions to   Efficient Technology   Industry-Leading
  and Consumer        Help Customers Sell     Systems to Speed          Sales and
    Experience             More Cars               Innovation       Customer Support

                        SUSTAINABLE MARKET LEADERSHIP
Financial
Snapshot
KPIs: Dealer Customers and Monthly ARPD Trends
                        Multiple Levers to Grow Revenue

   Dealer Customers                                       Average Monthly ARPD

                                                                       COVID
               COVID
                                                                       impact
               impact

                                                                                 36
Revenue and Adjusted EBITDA performance
                                                                                              Financials Strengthening
$ in millions

                                         Revenue                                                                                    Adjusted EBITDA

 $180                                                                                                    $60                                                              40%
                                                                                                                                                                          35%
  160                                                                                                     50
                                                                                                                                                                          30%
  140                                                                                                     40
                                                                                                                                                                          25%

  120                                                                                                     30                                                              20%

                                                                                                                                                                          15%
  100                                                                                                     20
                                                                                                                                                                          10%
   80                                                                                                     10
                Q1                     Q2                       Q3                     Q4                                                                                 5%
                                                                                                           0                                                              0%
                                           2019             2020
                                                                                                                Q1     Q2     Q3      Q4     Q1       Q2     Q3     Q4
                                                                                                               2019   2019   2019    2019   2020     2020   2020   2020

                                                                                                                             Adj. EBITDA           % of Revenue
  Reconciliations of non-GAAP financial measures can be found in the appendix of this presentation.

                                                                                                                                                                                37
Q1 2021    Q2 2020

Strong                                                            TOTAL LIQUIDITY1                                                $283.7MM   $217.3MM

Liquidity                                                         CASH FLOWS FROM OPERATING ACTIVITIES                            $50.4MM    $28.9MM

Position
and Free                                                          FREE CASH FLOW                                                  $44.1MM    $23.1MM

Cash Flow                                                         CASH                                                            $53.7MM    $187.3MM

Q1 2021
                                                                  DEBT                                                            $545.0MM   $799.7MM

                                                                  NET LEVERAGE                                                      2.9x       3.7x

1. Includes cash plus availability under revolving credit facility.

Reconciliations of Non-GAAP financials measures to the relevant GAAP measure can be found in the appendix of this presentation.
Investment Highlights
              01. Significant Headroom in Large and Fragmented Addressable Market

             02. Leading Brand¹ with Strong Organic Traffic

             03. Well Positioned to Benefit from Accelerating Shift to Digital Automotive Solutions

             04. Resilient Business Model With Attractive Free Cash Flow Profile and Strong Balance Sheet

             05. Experienced Management Team

             06. Well Positioned to Lead into the Future of Digital Automotive Buying

¹Millward   Brown as of December 2020; total brand awareness shown among CARS’ competitive set
Appendix
Non-GAAP
Reconciliations
(unaudited and in thousands)
Non-GAAP
Reconciliations
(unaudited and in thousands)
2019 Q1    2019 Q2   2019 Q3   2019 Q4   2020 Q1   2020 Q2   2020 Q3   2020 Q4   2021 Q1
                               Net cash provided by operating activities $ 38,389 $ 12,366 $ 29,795 $ 20,934 $ 28,892 $ 28,737 $ 39,237 $ 41,750 $ 50,362
                               Purchase of property and equipment      (3,363)   (5,991)   (6,055)   (5,848)   (5,755)   (2,970)   (3,878)   (4,109)   (6,219)

Non-GAAP
                               Free Cash Flow                        $ 35,026 $ 6,375 $ 23,740 $ 15,086 $ 23,137 $ 25,767 $ 35,359 $ 37,641 $ 44,143
                               % of Adjusted EBITDA                       91%       15%       52%       38%       66%      111%       72%       78%       92%

Reconciliations
(unaudited and in thousands)
Definitions: Key Metrics
Traffic. Traffic is fundamental to our business. Traffic to the CARS network of websites and mobile apps provides value to our
advertisers in terms of audience, awareness, consideration and conversion. In addition to tracking traffic volume and sources, we
monitor activity on our properties, allowing us to innovate and refine our consumer-facing offerings. Traffic is defined as the number
of visits to CARS desktop and mobile properties (responsive sites and mobile apps), measured using Adobe Analytics. Traffic does
not include traffic to Dealer Inspire websites. Traffic provides an indication of our consumer reach. Although our consumer reach
does not directly result in revenue, we believe our ability to reach in-market car shoppers is attractive to our dealer customers and
national advertisers.

Average Monthly Unique Visitors ("UVs"). Growth in unique visitors and consumer traffic to our network of websites and mobile
apps increases the number of impressions, clicks, leads and other events we can monetize to generate revenue. We define UVs in a
given month as the number of distinct visitors that engage with our platform during that month. Visitors are identified when a user
first visits an individual CARS property on an individual device/browser combination or installs one of our mobile apps on an
individual device. If a visitor accesses more than one of our web properties or apps or uses more than one device or browser, each
of those unique property/browser/app/device combinations counts toward the number of UVs. UVs do not include Dealer Inspire
UVs. We measure UVs using Adobe Analytics.

Dealer Customers. Dealer Customers represent dealerships using our products as of the end of each reporting period. Each
physical or virtual dealership location is counted separately, whether it is a single-location proprietorship or part of a large,
consolidated dealer group. Multi-franchise dealerships at a single location are counted as one dealer.

Average Revenue Per Dealer ("ARPD"). We believe that our ability to grow ARPD is an indicator of the value proposition of our
products. We define ARPD as Dealer revenue, excluding digital advertising services, during the period divided by the monthly
average number of Dealer Customers during the same period.
You can also read