Investor Update September 2020 - Repsol
←
→
Page content transcription
If your browser does not render page correctly, please read the page content below

Investor Update

September 2020

                  0
Disclaimer
ALL RIGHTS ARE RESERVED
© REPSOL, S.A. 2020
Repsol, S.A. is the exclusive owner of this document. No part of this document may be reproduced (including photocopying), stored, duplicated, copied, distributed or introduced into a retrieval
system of any nature or transmitted in any form or by any means without the prior written permission of Repsol, S.A.
This document contains statements that Repsol believes constitute forward-looking statements which may include statements regarding the intent, belief, or current expectations of Repsol
and its management, including statements with respect to trends affecting Repsol’s financial condition, financial ratios, results of operations, business, strategy, geographic concentration,
production volume and reserves, capital expenditures, costs savings, investments and dividend payout policies. These forward-looking statements may also include assumptions regarding
future economic and other conditions, such as future crude oil and other prices, refining and marketing margins and exchange rates and are generally identified by the words “expects”,
“anticipates”, “forecasts”, “believes”, estimates”, “notices” and similar expressions. These statements are not guarantees of future performance, prices, margins, exchange rates or other events
and are subject to material risks, uncertainties, changes and other factors which may be beyond Repsol’s control or may be difficult to predict. Within those risks are those factors and
circumstances described in the filings made by Repsol and its affiliates with the Comisión Nacional del Mercado de Valores and with any other supervisory authority of those markets where the
securities issued by Repsol and/or its affiliates are listed.
This document mentions resources which do not constitute proved reserves and will be recognized as such when they comply with the formal conditions required by the system
“SPE/WPC/AAPG/SPEE Petroleum Resources Management System” (SPE-PRMS) (SPE – Society of Pretroleum Engineers).
Repsol does not undertake to publicly update or revise these forward-looking statements even if experience or future changes make it clear that the projected performance, conditions or events
expressed or implied therein will not be realized.
This document does not constitute an offer or invitation to purchase or subscribe shares, pursuant to the provisions of the Royal Legislative Decree 4/2015 of the 23rd of October approving the
recast text of the Spanish Securities Market Law and its implementing regulations. In addition, this document does not constitute an offer to purchase, sell, or exchange, neither a request for an
offer of purchase, sale or exchange of securities in any other jurisdiction.
In October 2015, the European Securities Markets Authority (ESMA) published the Guidelines on Alternative Performance Measures (APM), of mandatory application for the regulated information
to be published from 3 July 2016. The information and breakdowns relative to the APMs used in this presentation are included Annex I “Alternative Performance Measures” of the consolidated
Management Report corresponding to the fiscal year 2019 and on the Repsol’s website.
The information contained in the document has not been verified or revised by the Auditors of Repsol.

                                                                                                                                                                                                      1
1.   Company overview
2.   Resilience plan 2020
3.   Highlights 2Q20
4.   Net zero emissions 2050
5.   Upstream
6.   Industrial
7.   Commercial and Renewables
8.   Outlook 2020
9.   Historic data book
1 Company overview
New business segments aligned with strategic vision
Company overview

  Upstream                      Industrial                     Commercial and
  Hydrocarbon Exploration       •   Refining                   Renewables
  and Production                •   Chemicals                  •   Mobility
                                •   Trading                    •   Lubricants
                                •   Wholesale & Gas trading    •   LPG
                                •   Repsol Peru                •   Power & Gas

     Yield & Focus                   Yield & Tier1                 Profitable growth

                 New segments
New business segments           alignedmulti-energy
                      reflect Repsol’s  with our renewed
                                                    and strategic vision
                 ESG-ready approach
                                                                                       4
Repsol: a unique, integrated global position
      Company Overview
                        Upstream                                                                                        Industrial                                                                              Commercial and Renewables

               Upstream                                                              Refining                                            Chemical                                                            Mobility                    Power & Gas

                        Production1                                                          Refineries                                    Total production                                                    Service stations              Installed
                        709 Kboe/d                                                               6                                            capacity2                                                            >4,900               generation capacity
                                                                                                                                          ~4.7 Millions tons                                                                                  ~ 3 GW
                 Proved reserves1                                                   Refining capacity                                                                                                         >1,000 (operated)
                    ~2.1 Bboe                                                        1 Million bbl/d                                     Synthetic Rubber                                                                                Project pipeline4
                     66% gas                                                                                                             One of the largest                                                                 Clients           ~ 2 GW
                                                                                        Top quartile                                      producers in the                                                                 10 Million
                    4 areas                                                            position among                                          world                                                                                       Retail clients
               North America,                                                          European peers                                                                                                                                       > 1 Million
                Latin America,
                Europe, Africa                                                       Largest coking
              Asia, Russia, RoW3                                                   capacity in Europe

                 Yield & Focus                                                                                   Yield & Tier1                                                                                                  Profitable growth
1. As of 31/12/2019. Production in 1H20 675 kboe/d 2. Base Chemicals ~2.5 Millions tons/y and Derivative Chemicals ~2.2 Millions tons/y. 3 Rest of the World. 4. Joint Venture with Ibereólica in Chile is not included.
                                                                                                                                                                                                                                                              5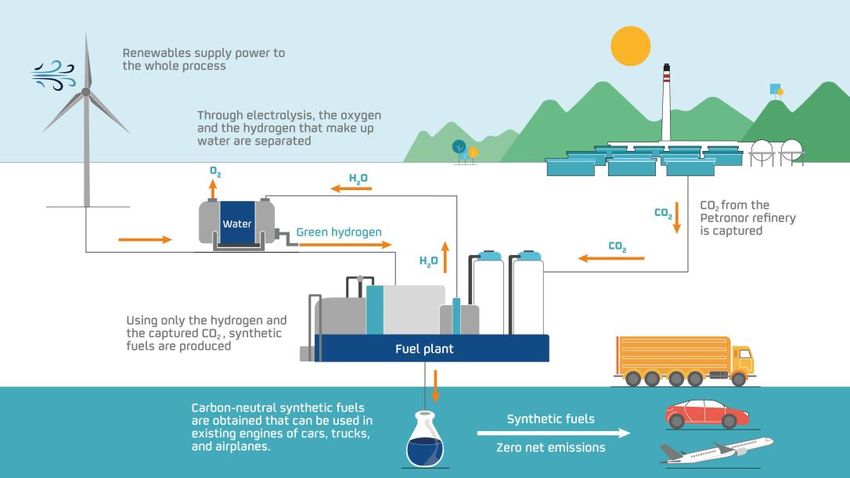
Worldwide presence
   Company Overview

           8.2%

                        Sacyr
     91.8%
                        Free Float

                                     Upstream   Industrial / Commercial & Renewable   Both
  23% of retail shareholders
32% of institutional shareholder
base managed under ESG criteria

                                                                                             6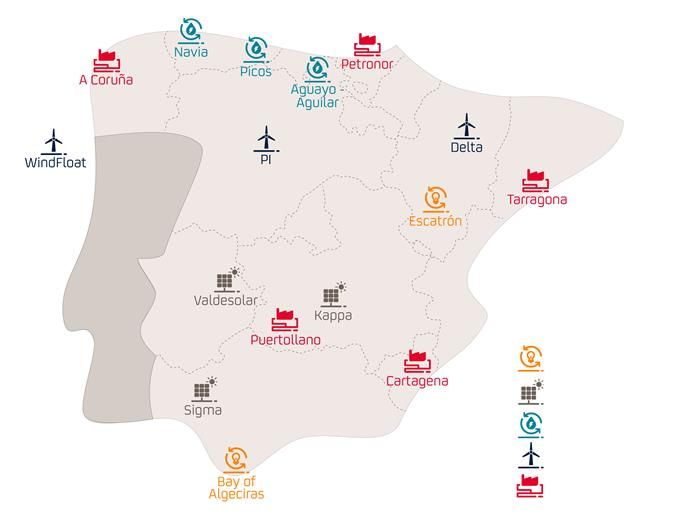
Integrated model and portfolio flexibility to withstand crisis
 Company Overview

       Tier-1 Resilience Plan that stands out in          2020 self-finance commitment to face the
                       the sector                             crisis: Net Debt flat vs. Dec’2019

          Sustainable multi-energy project:
                                                               Industry leading dividend yield
         decarbonization strategy reaffirmed
   •    Reduce Carbon Intensity indicator by 3% in 2020
   •    7.5 GW low carbon generation target by 2025
   •    Reduce CO2 emissions in all businesses

  Repsol is a renowned resilient leader to navigate through down
                              cycles
Priorización del valor frente al volumen, con una activa gestión del portafolio y flexibilidad
             de inversiones, generando caja en escenarios de precios retadores                       7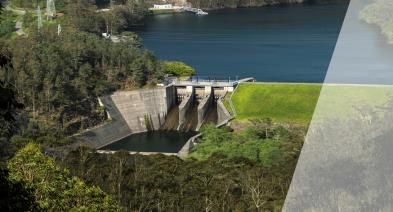
Increasing shareholder remuneration and full buyback of scrip
Company Overview

                                                     Dividend per share based on disbursement year

                                                        CAGR +8%
 €/share
        0.80 (1)                                                                                            0.95 (1)                        1.00 (1)
                                                                           0.90 (1)                                                                                   Historic cash dividend
                                     Buybacks
                                                                                                                                                                      Historic scrip dividend

                                                                                                                                                                     Scrip dividend + buybacks

              0.19

              2017                                                           2018                            2019                            2020

     Buyback program in 2019:

                   71.4 M shares of capital reduction                                                  Share capital of 1,527.4 M shares as of the end of 2019

 (1) The fixed price guaranteed by Repsol for the bonus share rights awarded under the “Repsol Flexible Dividend” program was 0.761 €/s in 2017, 0.873 €/s in 2018, 0.916 €/s in 2019 and       8
 0.916 €/s in 2020.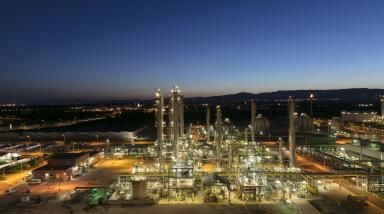
2 Resilience plan 2020
Resilience Plan delivering above original targets
Resilience plan 2020

                                         Original target   1H20 captured   New 2020 estimate
                       Opex savings         €350 M           > €250 M           €450 M
Delivering above
original targets       Capex savings       €1,000 M          > €550 M          €1,100 M

                       WC optimization      €800 M           > €300 M           €800 M

 Self-financed Resilience Plan 2020 expected to exceed the €2.2 Bn
                  of initially targeted cash savings

                                                                                               10
Solid financial position that covers debt maturities until 2030
Resilience plan 2020
• 2 senior bonds for €1.5 Bn issued in April
Reinforced liquidity position and • 2 new perpetual subordinated bonds for €1.5 Bn issued in June
financial strength • Repurchase of €0.6 Bn of the €1 Bn perpetual subordinated
bond NC 2021 issued in 2015
• ~€1.6 Bn increase in committed credit lines during 1H20
As of Jun. 2020
(Billion €)
9.8 Debt Maturities
Total liquidity covers 2.43x debt
maturities until March 2030, Available 3.4
Commited
without need of refinancing Credit Lines 6.3
3.3 2.8 4.7
Liquidity as of June 2020 2021-2024 2025 and beyond
2020
Rating S&P Fitch Moody’s
BBB BBB Baa2
Stable outlook Stable outlook Negative outlook
With these measures, and in the current conditions, net debt by
the end of 2020 will remain in line compared to Dec’2019 113 Highlights 2Q20
Upstream: immediate response to the COVID-19 crisis through
instant capex flexibility and opex efficiencies
Highlights 2Q20

                                                                       Instant capex flexibility
Upstream production                                                    (M€ accrued investments)
(kboed)                                                                         562
                                                                                                  -62%
            -46
                           -41          38           -5
                                                                                                         214

                                                                               2Q19                      2Q20
   694
                                                                640

                                                                       Unit opex reduction
                                                                       ($/boe net opex)
                                                                                9.0               -12%
  2Q19    Europe &    Latin America    North    Asia, Russia    2Q20                                     7.9
           Africa                     America   & Rest of the
                                                   World
                                                                               2Q19                      2Q20

                                                                                                                13
Industrial businesses impacted by COVID-19
Highlights 2Q20
• All refineries remained operational • Higher international margins
Refining during the crisis offset by lower prices and
Premium in the CCS unit Chemicals
• 3.0 $/bbl Refining margin narrow naphtha-propane
margin despite adverse indicator Resilience through differential
scenario and lower the crisis
• 69.9 % distillation utilization • IQOXE1 back onstream in May
utilization
• 82.4 % conversion utilization
Trading • Leveraged on volatility and Peru • Stronger refining margins
Strong second quarter contango Solid performance y-o-y
1. Third party highly integrated with Repsol’s chemical operations in Tarragona.
14Mobility getting back to normal, while progress in Low Carbon continues
Highlights 2Q20
• Service Stations: 48% sales Lubricants,
Mobility decrease 2Q20 vs. 2Q19 • Higher margins foster robust
Asphalts and performance in both
• Gasoline and diesel demand
Specialties & businesses
recovery: ~10-15% below 2019
level in July LPG
• Kerosene demand remains very • 64,000 net new customers
weak: ~80% below 2019 level in Gas & Power
(+6% YTD)
July
• “A label”: highest environmental
certification for the electricity
Fuel demand monthly variation in Spain 2020 vs. 2019
(Mm3)
marketed by Repsol
March April May June • 3 renewable power generation
projects under construction
Delta: 335 MW
-20%
-28% Kappa: 127 MW
-45%
Valdesolar: 264 MW
-61%
Source:
CLH
152Q20 results
Highlights 2Q20
Results (€ Million) Q2 2020 Q1 2020 Q2 2019 1H 2020 1H 2019
Upstream -141 90 323 -51 646
Industrial 8 288 177 296 448
Commercial and Renewables 42 121 128 163 265
Corporate and Others -167 -52 -131 -219 -244
Adjusted Net Income -258 447 497 189 1,115
Net Income -1,997 -487 525 -2,484 1,133
• €1,289 M post-tax impairment in the Upstream following reduced price assumptions for 2020 and
2021:
(Real terms 2020) 2020 2021 Avg. 2020-2050
Brent ($/bbl) 43 49 59.6
HH ($/Mbtu) 2 2.7 3.3
• Inventory effect: €-0.3 Bn
164 Net zero emissions 2050
Strategy towards achieving net zero emissions in 2050
Net zero emissions 2050
New emissions reduction objectives of Carbon Our challenge:
Intensity Indicator1
Lead the Energy transition in line
2025
2030
with the objective of the Paris
-10% Agreement to limit the increase in
-20% 2040 global temperature to bellow 2ºC
-40% 1st oil & gas company:
Carbon Intensity Indicator: to support the Kyoto Protocol
to align with the Paris Agreement
g CO2/MJ to assume net zero emissions ambition by 2050
Supply Energy (MJ) with the lowest 2050
possible emissions (CO2) Sustainability embedded in decision making
Management and Employees remuneration linked to
Net zero emissions in delivery of Sustainability targets
2050
1. 2016 baseline
Repsol will be a net zero emissions Company with in 2050, a pioneer in the
Priorización
sector in settingdel
thisvalor frente al volumen, con una activa gestión del portafolio y flexibilidad
objective
1. Baseline 2016
de inversiones, generando caja en escenarios de precios retadores 18Natural gas and energy efficiency as main levers
Net zero emissions 2050
1 Natural Gas role
2 Energy efficiency
3 Low Carbon
4 Technological
developments
64% of our production Reduce our Energy Generation and Capture, usage and storage
Consumption and GH commercialization of of CO2
emissions renewable electric Energy.
71% of our reserves Net zero emissions
3 million tons reduction of 7.5 GW installed capacity solutions (e-fuels, Green
Committed to reducing CO2 eq for the 2018–2025 by 2025 Hydrogen and NCS1)
the intensity of methane period
emissions Internal CO2 Price deck R+D in Repsol Tech Lab
The first Energy Company to that will guide and
prioritize its investments Collaboration with our
issue a Green Bond to invest
partners (OGCI)
in Energy efficiency
Repsol will contribute with determination to achieve a more decarbonized
economy and planet
19
1. NCS: Natural Climate SolutionsUpstream: cash generator in challenging price scenarios
Net zero emissions 2050
Upstream
Portfolio improvement Capex and Exploration Energy Transition
Assets Unconventional investment flexibility Emission reductions
Geographical concentration and short cycle projects Methane: 25% in 2025
Ability to generate cash in low price Optimization of investments in ongoing Routine Flaring: 50% in 2025
scenarios projects, declining assets and and 100% in 2030
Low capital intensity abandonment activities
No activity in offshore arctic and
Resources Exploration oil sands
Development according to price Focused on productive basins, seeking
scenarios Investment decisions with
for synergies and optimizations
sustainability criteria
Prioritization of value over volume, with active portfolio management and
investment flexibility, generating cash in challenging price scenarios
20Industrial: circularity and emission reduction
Net zero emissions 2050
Refining Chemical
First quartile of European refining
Raw materials
Optimization and digitization
Flexibility
Emission reduction Increasing presence of circular raw material
Energy efficiency
Carbon intensity reduction
Low emission raw materials
Differentiation and specialties
New technologies
Health, Nutrition, Well-being sectors
Green Hydrogen
Light materials, insulation and energy efficiency
Carbon Capture, Use and Storage
Materials for renewables
Biofuels
Double production (600,000 t in 2025) Recycling and circular economy
Waste-originated and circular economy: 20% polyolefins with recycled content in 2030
250,000 t in 2025 and 600,000 t before 2030
Circularity and emission reduction are the basis of our differentiation in the
Industrial business
21Commercial and G&P: customer centric, multi-energy offer
Net zero emissions 2050
Commercial Gas & Power
Customer centric and integrated energy offer 7.5 GW low carbon generation target by 2025
Actual installed capacity: ~ 3 GW
Innovative products and services Renewable power generation under construction
Digitalization or advanced development: ~ 2 GW
Customer integration in production
CO2 emissions compensation with Spain market share: 5% in 2025
Waylet and Wible
International expansion
Electric Vehicle charging stations in Spain
+1,200 recharging points Products and services
35 fast recharging points 100% low emissions electricity (certified)
2 ultrafast recharging points Energy efficiency solutions (100% renewable self
generation, efficiency studies, etc.)
Multi-energy customer centric company, with an integrated value proposition,
differential and focused on renewable energy
225 Upstream
Four regions in the portfolio
Upstream

                 North America                                                                                                                                    Europe & Africa
       Unconventional portfolio, operatorship and                                                                                                         High margin barrels, key development
       valuable midstream positions                                                                                                                       projects from exploration succes

                       182 kboe/d                                                                                                                                        121 kboe/d

                       72%                                                                                          2018                                                 23 %
                                                                                                                                            2019
                       84% / 84%                                 Production (kboe/d) (1)                           715                      709                          1% / 70%

                                                                 1P Reserves (Mboe)                               2,340                    2,139
                                                                 RRR (%) (2)                                           94                      23
                Latin America                                    RRR 3 year average (%)(2)                                     69                           Asia, Russia and RoW
        Regional scale, exploration record and                                                                                                              Self-financed growth, relationship with
        cultural fit                                                                                                                                        governments/NOCs

                        333 kboe/d                                                                                                                                       73 kboe/d

                          72%                                                                         Total production                                                   73%
                                                                                                      Gas production

                        16% / 36%                                                                     Operatorship (by volume) / Op & Co-Op (by volume)
                                                                                                                                                                         26% / 46%

Note: figures as end of 2019   1. Production in 1H20 675 kboe/d 2. Reserves Replacement Ratio Total                                                                                                   24
Exploration success in core areas
Upstream
Gulf of Mexico Alaska Colombia
6 discoveries in 2020 with • US: Monument (WR 272 block) • Mitquq and Stirrup positive • Positive results of the Lorito
combined gross resources of • Mexico: Polok and Chinwol discoveries results well (CPO-9 block)
(deepwater Block 29 in the Salinas Basin) • Flow tests exceeding • Provides continuity of the
more than 650 Mboe expectations Akacias project
Exploration Core Areas
Alaska
Gulf of Mexico
Brazil Indonesia
256 Industrial
Top quartile Refining position among European peers
Industrial
(1)
5 refineries optimized as a single system Top quartile position among European peers
CORUÑA BILBAO
% FCC Equivalent
100%
TARRAGONA 1Q 2Q 3Q 4Q
80%
60%
PUERTOLLANO 40%
CARTAGENA 20%
0%
0 2 4 6 8 10 12 14
Oil pipeline Repsol Oil pipelines CLH Europe Mbpd
Fully invested, well prepared to capture IMO effect Middle distillates deficit(2)
UK
20.0
Ireland
Germany
Repsol has the largest coking capacity in Europe (25% 4.7
18.9 Main countries with deficit
coking share while 6% of total distillation capacity) with France
Austria
24.4
coking process becoming highly profitable during IMO 3.8 Turkey
Middle distillates deficit (MTn)
Switzerland 10.7
5.3
Strong Product Slate: Repsol larger middle distillates Tunisia
2.0
production with very low Fuel Oil yield (5-7%) Morocco Libya
6.7 3.0
Egypt
6.9
Nigeria
3.2 27
(1) Source: WoodMackenzie as of 31/12/2017 (2) Source: IHS Markit as of 31/12/2019Two major pioneering decarbonization projects
Industrial
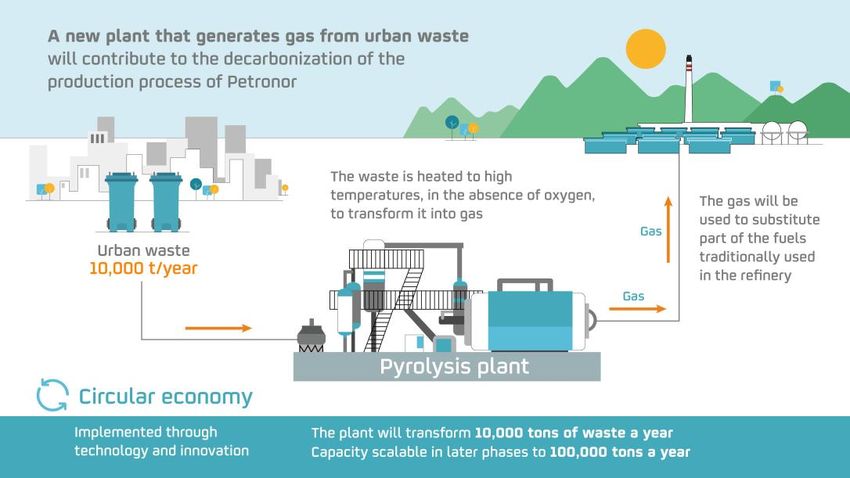
One of the world’s largest plants to manufacture net zero Plant for generation of gas from urban waste
emissions fuels
• Replacing part of Petronor’s production process
Benefiting from Spain’s renewable resource to reduce the traditional fuels, reducing emissions from our
CO2 emissions associated to the use of our products operations (Scope 1+2) and promoting circular economy
(Scope 3)
Anticipating the refinery of the future and moving towards our net zero CO2 ambition
28Competitive positioning in Chemicals
Industrial
Strong and Integrated position in Spain and Portugal High flexibility of feedstocks
Feedstock to crackers – LPG´s (%) ~ 60%
~50%
TARRAGONA 40%
(3,050 kT/y)
PUERTOLLANO Total Production Ref. Europe: 25 %
SINES (650 kT/y) Capacity:
(1,050 KT/y) 4,750 KT/y
Chemical Site Own refinery Third-party refinery
2011 2019 2020 2025
One of the largest producer in the world of Synthetic Rubber Differentiation & customer orientation
SPAIN
65% 150 90%
(155 kT/y) CHINA (JV 50%) of Derivatives new grades of lean
(130 kT) portfolio are non- developed in Production
MEXICO
(240 kT/y) commoditized past 5 years (ad-hoc)
product
Total Production
Capacity:
29
525 KT/y7 Commercial & Renewables
Multi-energy offer with ~3 GW installed capacity of clean energy
     Commercial and Renewables
                More than 4,900 service stations in 5 countries                                                                     International expansion in Lubricants
                                                                                            Repsol's market share Spain      • Leadership in Spain
• Customer-centric with 10 million
  customers and strong energy brand                                                                                          • Expand international presence (Asia, Latam)

• Leadership in convenience retail                                                                                                  • Partnership with Bardahl (Mexico) and United Oil
  with enhanced digital capabilities                                                                                                  (Indonesia)

• Fuel market share: Spain: 37% (#1)
  Portugal: 26% (#2), Peru: 22% (#2)
• Expand into new geographies:
  345 contracts signed in Mexico

                                     LPG leader in Spain                                                                            ~3 GW Installed capacity of clean energy
                                                                                                                                     Wholesale            Retail             Low carbon
                                                                                                                                       Gas                 G&P               generation
• Spain LPG share: 74%                                                                                                    Targets         >15%              2.5 M         ~ 7.5 GW
• Portugal LPG share: 18%                                                                                                             Market   share1      Clients2          Capacity
                                                                                                                          to 2025
• Consider growth opportunities in hinterland                                                                                             14%               >1 M             3.6 GW
                                                                                                                          In 2020     Market   share1      Clients2          Capacity

                                                                                                 Customer at the center of our operations
                                                                                                                                                                                          31
1. Spain market share including our refineries' consumption; 2. Not adjusted for dual clients;
Accelerated delivery of 2025 objectives in Low Carbon
Commercial and Renewables
~700 MW Hydro
Installed ~1,650 MW CCGT
capacity Cogeneration
+ 600 MW
~3 GW
WindFloat Atlantic: 5 MW
Generation
Delta: 335 MW
Under
Valdesolar: 264 MW Construction
Project
pipeline Kappa: 127 MW 1,400 MW
~2 GW
PI: 175 MW 600 MW
Advanced
Sigma: 204 MW development
Delta II: 860 MW
Target
2025
7.5 GW
Retail
Repsol brand and channels have proven successful in enhancing the low carbon gas and power retail business:
> 1 million clients (+33% increase in one year) 32Entry in Chile's renewable market
Commercial and Renewables
Diversified portfolio (52% wind and 48%
solar) of up to 2.6 GW
Initiating international
• 78 MW in operation
expansion in renewables
• 1.6 GW of projects under construction
JV
(110 MW) or in advanced development
• Joint Venture with Ibereólica portfolio stage (1.5 GW) to be installed in the next
(50%) - option to control the JV
five years:
after 2025
• 3 wind
• Cash out does not jeopardize the
Resilience Plan 2020 • 2 solar
• Projects by 2025 in Chile will add • Additional 1 GW projects planned to 2030
~ 0.8 GW (net to Repsol)
Making important progress towards our goal of operating 7.5 GW of low carbon generation
by 2025
338 Outlook 2020
Preserving the balance sheet and investment grade
   Outlook 2020

                                           FY2020

       Operating    Production                    650 kboed     •   Assumes Libya producing from 4Q20
       metrics      Ref. margin indicator         3.8 $/bbl     •   Uncertain demand recovery

       Financial                                                •   In line with 2019 without the positive
                    Net Debt (Dec’20)              ≤ €4.2 B
       outlook                                                      effect of hybrid issuances

                    Carbon intensity indicator      -3%         •   Vs. 2016 baseline
       Energy
       transition   CO2 reduction                -2.1 Mtn CO2   •   From 2014

Repsol ensures its short term financial strength to progress in its
 commitment to become a net zero emissions company by 2050
359 Historic data book
Environment and Repsol group
Historic data book
                                                                                                  MACRO ENVIRONMENT

               International References                             Unit        2017          2018        2019             Spreads vs. Brent ($/bbl)         2017       2018       2019

                Brent                                              ($/Bbl)          54.2         71.3       64.2      Maya - Brent                              [9.7]    [10.6]      [11.1]
                WTI                                                ($/Bbl)          50.9        64,9        57.0      Ural - Brent                              [0.9]      [1.1]      [0.4]
                Henry Hub                                         ($/MBtu)              3.1       3.1        2.6      Gasoline - Brent                          12.0        8.7           8.4
                Average exchange rate                               ($/€)           1.13         1.18       1.12      Diesel - Brent                            13.1      15.8         16.2
                Algonquin                                         ($/Mbtu)              3.7       4.8        3.2      Fuel oil - Brent                          [7.2]     [9.2]      [13.1]
                                                                                                                      Naphtha - Brent                            0.4      [3.1]       [7.6]

               Refining indicators                                  Unit        2017          2018        2019
                Refining margin indicator (Spain)                   $/bbl               6.8       6.7        5.0
                Distillation utilization (Spain)                      %            93.6          92.9        88
                Conversion utilization (Spain)                        %           104.4         106.6       103

                                                                                                        REPSOL GROUP

               Main figures (M€)                                                2017          2018        2019       Ratios                         Unit     2018       2019
                Adjusted Net Income                                               2,131        2,352      2,042       Net debt                         M€    (3,439)    (4,220)
                   Upstream                                                         632        1,325      1,050       Net debt/Capital employed        %        10,0     14,3 3
                   Downstream                                                     1,877        1,583      1,456       Net debt/EBITDA CCS               x       0,45      0,59
                   Corporate and others                                            (378)        (556)      (464)
                EBIT                                                              3,214        4,396      3,661      Credit metrics               Rating    Outlook      Last review
                EBITDA CCS                                                       6,580         7,619      7,201       Standard & Poor's           BBB       Stable      March 25, 2020

                NET CAPEX                                                        2,856          388       3,776       Moody's                     Baa2      Negative     April 02, 2020
                                             1
                CAPITAL EMPLOYED                                               36,330         34,353     33,292       Fitch                       BBB       Stable       April 02, 2020
                   Upstream                                                     21,612         21,515    17,205
                   Downstream                                                   9,749         11,338     14,078
                   Corporate and others 2                                       4,969           1,500     2,009

                   1
                       Capital employed below 2.3 Bn€ in each single country. Capital employed without leases 29,556 M€.
                   2
                       In 2017, 3,224 M€ Capital employed in discontinued operations.                                                                                                           37
                   3
                       Without leases
Upstream
Historic data book
Production Proven reserves
Kboe/d Mboe
2017 2018 2019 2017 2018 2019
Main figures (M€) 2017 2018 2019
Europe 51 60 61 59 102 88
Adjusted Net Income 632 1,325 1,050
Latin America 348 342 333 1,490 1,419 1,196
EBIT 1,009 2,514 1,969
North America 174 175 182 504 535 619
EBITDA 3,507 4,801 4,255
Africa 38 58 61 128 129 127
INVESTMENTS 2,089 1,973 2,429
Asia 85 79 73 174 154 109
Total 695 715 709 2,355 2,340 2,139
Realized prices Oil Gas 2017 2018 2019
$/Boe 2017 2018 2019 2017 2018 2019 Total RRR % 89 94 23
Europe 55.2 71.2 64.5 34.2 46.8 25.8
Latin America 47,0 59.6 52.4 13.3 15.9 12.9
North America 47.4 58.5 55.0 14.6 14.0 12.5
Africa 52.8 71.1 63.3 27.1 29.5 25.9
Asia 51.2 67.3 61.2 29.6 37.7 36.7
Net Acreage Development Exploration
2
km 2017 2018 2019 2017 2018 2019
Europe 1,199 1,122 1,132 15,373 11,922 17,377
Latin America 4,475 4,827 4,822 47,763 90,959 44,602
North America 5,234 4,698 5,064 5,503 9,998 7,278
Africa 2,744 2,605 2,605 22,389 10,590 6,845
Asia 4,105 2,951 2,454 96,598 98,152 94,032
Total 17,757 16,203 16,077 187,625 221,621 170,134
38Downstream
Historic data book
Downstream Assets
Refining capacity
Refining Converson index (%) Businesss Unit 2017 2018 2019
(kbbl/d)
Spain 896 63 Refining
Bilbao (Petronor) 220 63 Distillation utilization
Tarragona 186 44 Spain % 93.6 92.9 88
Coruña 120 66 Peru % 89.8 81.7 74.8
Puertollano 150 66 Conversion utilization Spain % 104.4 106.6 103
Cartagena 220 76 Processed crude oil Mtoe 47.4 46.6 44
Peru 117 24 Spain Mtoe 41.9 41.6 39.6
Peru Mtoe 5.4 5.0 4.4
Marketing Service stations (no.)
Marketing
Total 4,944 Sales of oil products kt 51,836 51,766 49,932
Spain 3,354 Europe Sales kt 45,081 45,316 44,007
Portugal 486 Own network kt 21,186 21,754 21,368
Peru 572 Rest kt 6,755 6,450 5,925
Italy 298 Own network kt 2,288 2,681 3,176
Mexico 234
Petrochemicals
Petrochemical Capacity (Kt/year) Basic kt 978 808 829
Derivatives kt 1,877 1,802 1,958
Ethylene 1,214 Total Sales kt 2,855 2,610 2,787
Propylene 864 Europe kt 2,412 2,137 2,289
Butadiene 185 Rest of the world kt 443 473 498
Benzene 290 LPG
ETBE/MTBE 50 LPG sales kt 1,375 1,330 1,253
Polyethylene 793 Europe kt 1,356 1,304 1,224
Polypropylene 505 Rest of the world kt 19 26 29
Intermediate products 937 Gas & Power
Gas Sales in North America Tbtu 496 520 608 39
LNG regasified (100%) in Canaport Tbtu 15 16 24Investor Update
September 2020
Repsol Investor Relations
investor.relations@repsol.com
40You can also read