It is possible to maintain productivity and quality standards in carnation with less nitrogen in the fertigation formula - SciELO Colombia
←
→
Page content transcription
If your browser does not render page correctly, please read the page content below
Doi: https://doi.org/10.17584/rcch.2019v13i2.8068

It is possible to maintain productivity and quality standards
in carnation with less nitrogen in the fertigation formula
Es posible mantener estándares de productividad y calidad en
clavel con menos nitrógeno en la fórmula de fertirriego

                                                                   ADRIANA DEL P. BARACALDO1
                                                                   VÍCTOR J. FLÓREZ1, 3
                                                                   CARLOS A. GONZÁLEZ2

                                                                Plants of standard carnation cv. Don Pedro crop,
                                                                cultivated under plastic greenhouse conditions at
                                                                Centro Agropecuario Marengo, Universidad Nacional
                                                                de Colombia.
                                                                Photo: A.P. Baracaldo

ABSTRACT
Although nitrogen is the most widely used fertilizer in agriculture, it contaminates the surface and ground-
water through leaching. A decrease in the concentration of total nitrogen and changes in the ammonium:-
nitrate ratio can provide information for a better use of this nutrient. The objective of this study was to
evaluate the effect of a decrease in total nitrogen and an increase in the percentage of N-NH4+ on indicators
of growth, productivity, quality and nitrogen use efficiency (NUE) in carnation cultivation. In the Centro
Agropecuario Marengo at the Universidad Nacional de Colombia, two concentrations of total nitrogen were
evaluated (200-140 mg L-1 in the vegetative phase and 160-112 mg L-1 in the productive phase) with three ra-
tios of N-NH4+:N-NO3- (5:95, 15:85 and 25:75) in standard carnation plants cv. Don Pedro grown in substrate.
In both fertigation formulas, similar productivity and qualities were obtained, and the formula with less total
N provided better NUE, mitigating the negative impact of this nutrient on the environment. Likewise, the
ammoniacal component played a preponderant role: the number of flowering stems per plant decreased as
the ammoniacal component increased, similar to that observed with the percentage of flowering stems in the
‘Select’ quality grade.

                                          Additional key words: Dianthus caryophyllus L.; cut flowers; soilless cultivation;
                                                                                  growth rates; ammonium:nitrate ratio.

1
    Universidad Nacional de Colombia, Facultad de Ciencias Agrarias, Departamento de Agronomía, Bogota (Colombia).
    ORCID Baracaldo, A.P.: 0000-0001-7947-3510; ORCID Flórez, V.J.: 0000-0002-3081-2400
2
    Universidad Nacional de Colombia, Facultad de Ingeniería, Departamento de Ingeniería Civil y Agrícola, Bogota
    (Colombia). ORCID González, C.A.: 0000-0002-2920-8425
3
    Corresponding author. vjflorezr@unal.edu.co

                                     REVISTA COLOMBIANA DE CIENCIAS HORTÍCOLAS - Vol. 13 - No. 2, pp. 279-290, May-August 2019
280 BARACALDO / FLÓREZ / GONZÁLEZ
RESUMEN
Aunque el nitrógeno es el fertilizante más usado en la agricultura contribuye a contaminar aguas superficiales y
subterráneas a través de su lixiviación. Una disminución en la concentración del nitrógeno total y cambios en la
relación amonio:nitrato pueden proveer información acerca de una mejor utilización de este nutriente. El objetivo
de este estudio fue evaluar el efecto de la disminución del nitrógeno total y el aumento del porcentaje de N-NH4+
sobre indicadores del crecimiento, la productividad, la calidad y la eficiencia del uso del nitrógeno (EUN) en el culti-
vo de clavel. Para lo cual, en el Centro Agropecuario Marengo de la Universidad Nacional de Colombia se evaluaron
dos concentraciones de nitrógeno total (200-140 mg L-1 en fase vegetativa y 160-112 mg L-1 en fase productiva) con
tres relaciones de N-NH4+:N-NO3- (5:95, 15:85 y 25:75) en plantas de clavel estándar cv. Don Pedro sembradas en
sustrato. En ambas fórmulas de fertirriego se obtuvieron productividades y calidades similares y en aquella fórmula
con menos N total mejor EUN, mitigando el impacto negativo de este nutriente en el medio ambiente. Así mismo,
el componente amoniacal juega un papel preponderante: el número de tallos florales por planta disminuiría en la
medida que se aumenta el componente amoniacal, de manera similar a lo observado con el porcentaje de tallos flo-
rales en grado de calidad Select.
Palabras clave adicionales: Dianthus caryophyllus L.; flores de corte; cultivo
sin suelo; índices de crecimiento; relación amonio:nitrato.
Received for publication: 06-06-2018 Accepted for publication: 31-07-2019
INTRODUCTION
The use of nitrogen fertilizers is excessive worldwide, al., 2015), its role in water use efficiency (Ucar et al.,
causing pollution problems (Cameron et al., 2013; 2017), and the symptoms of its deficiency and toxic-
Schipper et al., 2010; Zhang et al., 2011; Daza et al., ity (Gárate and Bonilla, 2013) are widely described in
2015). It is estimated that, in 2020, approximately the literature as are the metabolic processes of nitro-
201.7 million tons of NPK-based fertilizers will be gen assimilation (Maldonado et al., 2013), the influ-
used, of which 58.9% will correspond to nitrogen ence of environmental factors and species (Cabrera,
(FAO, 2017). The application of N worldwide has in- 2006), and its mobility, storage, enzyme complexes,
creased more than eight-fold since 1961 (Kant, 2018). organelles and energy sources involved in reduction
In Colombia, the consumption of these agricultural to ammonium (Barker and Bryson, 2007; Kant, 2018).
inputs has increased significantly since 2000 despite
the fact that no significant increase was observed in Plants have developed mechanisms to modulate effi-
the agricultural use area (ICA and MADR, 2015). Lo- ciency of N uptake in response to factors, such as the
cally, fertilization in soilless cultivation systems is availability and form of N present in the soil solution
based on empirical practices, which generally leads to as well as to the N requirement of the plants during
producers overestimating the needs of plants and ap- the life cycle (Hawkesford et al., 2012).
plying excessive amounts, with a consequent waste
of nutrients and money and risk of contamination for Strategies for mitigating the impact of nitrogen as a
water courses and groundwater. One of the most im- contaminant include lowering the total nitrogen in-
portant objectives for the development of sustainable put and increasing the percentage of ammonium. For
agriculture is increasing crop yield and quality while the efficient use of this nutrient, Kumar et al. (2016)
using less nitrogen fertilizers and, thereby, improv- showed that, with 0, 50, 100, 150 and 200 mg L-1 of
ing Nitrogen Use Efficiency (NUE) (Good et al., 2004; N in carnation plants cv. Red Corso, the values of the
Lupini et al., 2017). evaluated variables (number of flower buds per plant,
number of flowers per plant, flower size, flower
The importance of nitrogen for plant development, weight, stem length and flower duration) increased
its essentiality, the compounds it is a part of (Kiba et significantly up to 150 mg L-1. In several crops, combi-
al., 2011), its influence on metabolic processes (Jin et nations of both forms (N-NH4+ and N-NO3-) usually
Rev. Colomb. Cienc. Hortic.PRODUCTIVITY AND QUALITY IN CARNATION WITH LESS NITROGEN 281
result in higher growth than when only one of the are required for each species in order to find the best
forms is used (Vojtíšková et al., 2004; Li et al., 2007). NH4+: NO3- ratio.
In anthurium, Dufour and Guerin (2005), when us-
ing NH4+: NO3- ratios of 0.25, 0.37 and 0.51 in the nu- The objective of this study was to evaluate the effect
trient solution, found that increasing the ratio to 0.37 of the lesser rate of total nitrogen and an increase in
of the total N improved the growth, development and the percentage of N-NH4+ on indicators of growth,
plant yield. Khalaj et al. (2017) evaluated the effect of productivity, quality and nitrogen use efficiency in
NO3-: NH4+ (100: 0, 80:20, 60:40, 40:60) ratios in the standard carnation crop cv. Don Pedro.
fertigation solution on gerbera cvs. Stanza and Dou-
ble Dutch. The 80:20 ratio presented higher values in
the evaluated variables (number of leaves per plant, MATERIALS AND METHODS
number of flowers, diameter of the stem and flower,
fresh and dry mass of roots and shoots and vase life), This research was carried out at the Centro Agropecu-
and, with the 40:60 ratio, the plant growth and bio- ario Marengo (CAM) at the Universidad Nacional de
mass were significantly reduced. With the increase in Colombia, Bogota campus, located in the municipali-
the concentration of ammonium, the carotenoid and ty of Mosquera (Cundinamarca) at 4°42’N and 74°12’
chlorophyll contents increased as well as the catalase W, at 2540 m a.s.l., with an average temperature of
and peroxidase activity in cells. For a given dose of N 12.4°C, relative humidity between 76 and 89% and
and irrigation regime, according to Bar-Yosef (2008), annual average rainfall of 1,124 mm (Ordoñez and
the aforementioned ratios affect several factors in the Bolivar, 2014). During the study, the average tem-
soil solution and crop: i) nitrogen uptake efficiency; perature and relative humidity inside the greenhouse
ii) decreased uptake rates for Ca+2, Mg+2 and K+ as were 17.5°C and 76%, respectively.
the result of competition with NH4+ uptake; iii) NH4+
decreases the pH of the solution while NO3- increases For the test, a traditional greenhouse with a flexon-
it; and iv) excessive uptake of NH4+, particularly at type metal structure (Acuña and Ortiz, 2004) was
temperatures higher than 28°C in the root zone, is used, with passive lateral and zenithal ventilation, in
detrimental to the development of roots. which two warehouses, 9×70 m (630 m2), were fit-
ted. Six wooden beds (7.0×0.7 m) were built, raised
Tabatabaei et al. (2006) found in a hydroponic straw- 0.4 m from the ground, with a double container, each
measuring 0.25 m wide and 0.2 m deep, and a leach-
berry crop that high NH4+ and NO3- ratios in the
ate collection tank at the end of each bed. Standard
fertigation solution always reduced the yield and
carnation (Dianthus caryophyllus L.) cv. Don Pedro
that the 25NH4+:75NO3- ratio increased the yield by
cuttings were used at a density of 15.5 plants per m2
38% and 84% in cvs. Camarosa and Jungle, respec-
in an open substrate cultivation system. The sub-
tively. The higher yield with this ratio resulted from
strate consisted of a mixture of 50% raw rice husk
increases in the size, length and fresh mass of the
+ 15% burnt rice husk + 25% reused burnt rice husk
fruits; however, the 0 to 75% increase in the NH4+ + 10% compost, obtained from rose and carnation
ratio significantly reduced the concentration of fruit crop residues (v/v/v/v). The initial EC and pH of this
Ca and postharvest life of both cultivars. Apparently, mixture were 0.5-1.0 dS m-1 and 6.8 -7.0, respectively.
a greater foliar area and photosynthesis rate with the The agronomic crop management described in Flórez
25:75 N ratio were the reasons for the increases in et al. (2006a) was used.
productivity and plant growth. For Roosta (2014),
the adverse effects of alkalinity on SPAD values and Six treatments were established, corresponding to
the maximum quantum yield of PSII (Fv/Fm) were modifications in the N content of the conventional
alleviated with increases in the proportion of NH4+ formula, commercially applied in the carnation crop
in the nutrient solution, increasing the number of (200-160 mg L-1 of total N for the vegetative and pro-
fruits and yield in strawberry cv. Camorosa. Among ductive phases of the crop, respectively, maintaining
the treatments studied by Abasi et al. (2016) in a hy- a NH4+:NO3- ratio equal to15:85). In this formula, the
droponic cultivation of tulip cvs. Apricot Parrot and total N was reduced by 30%, and the NH4+:NO3- ratio
Daytona with a NH4+/NH4+ + NO3- ratio of 0.38 in was decreased or increased by 10% (Tab. 1). In the fer-
the nutritive solution, they found the maximum con- tigation solutions, the EC remained between 1.5 and
centrations of Ca and Mg, floral longevity, dry mass 2.5, and the pH was between 5.5 and 6.0. The con-
and optimal N, P, K. For these reasons, specific studies centrations of the elements (mg L-1) in the vegetative
Vol. 13 - No. 2 - 2019282 BARACALDO / FLÓREZ / GONZÁLEZ
and reproductive phases were: P, 30; K, 150; Ca, 120; strength of the stems, the size and opening point
Mg, 40; Fe, 3; Cu, 1; Zn, 0.5; B, 1; Mo, 0.1; and S, of the flowers, defects in quality attributes or pa-
between 2 and 116 mg L-1 because it was used for the rameters and the presence of pests or diseases, as
stoichiometric balance of the NH4+ in the formula. In described by Reid and Hunter (2000) and Escandón
order to calculate the nutritional solutions, the con- (2009).
tribution of water (EC = 0.6 and pH = 7.0) and Mn
in the burnt rice husk substrate (Florian-Martínez To determine the Nitrogen Use Efficiency (NUE) in
and Roca, 2011) were taken into account. the samples of complete plants by treatment at 16,
21 and 26 WAS, the content of N in the vegetal tis-
For the analysis of growth at 16, 21 and 26 weeks sue was determined. The analyses were performed in
after sowing (WAS) in the production cycle, three the Laboratorio de Aguas y Suelos de la Facultad de
destructive samples were carried out in order to mea- Ciencias Agrarias at the Universidad Nacional de Co-
sure the variables leaf area and dry mass of root and lombia, according to the procedures described by Car-
shoot, separated into dry mass of stems, leaves and rillo et al. (1994): N (total nitrogen) micro-Kjeldahl
flower buds. The leaf area (cm2) was determined methodology. The NUE was calculated taking into
with LI-COR model LI-3100. Based on these data and account the dry mass accumulation and nitrogen
in accordance with Flórez et al. (2006b), the Relative uptake, agreeing to Good et al. (2004); according to
Growth Rate (RGR), the Leaf Area Index (LAI), the the following formula: NUE = dry mass of complete
Specific Leaf Area (SLA), the Leaf Mass Ratio (LMR) plant (g)/nitrogen content in complete plant (g).
and the Net Assimilation Rate (NAR) were calcu-
lated. From 10 WAS, six plants were randomly se-
lected biweekly per treatment for continuous growth Statistical analysis
measurements. The number of stems per plant was
counted, and the length and diameter of the stem, A completely randomized experimental design was
the number of leaves, and the length and diameter of used, with a factorial arrangement of two levels of
the flower bud were measured on the middle stem of total nitrogen and three NH4+:NO3- ratios (Tab. 1).
each plant. The six treatments had three replicates, and the ex-
periment unit consisted of 2 m of bed with 46 plants.
The productivity and quality of the carnation flow- The inferential analysis was carried out with analysis
er stalks were recorded for each of the treatments. of variance (Anova) and multiple comparison Tukey
Productivity was expressed as the number of flower- test, with a level of significance P≤0.05. Normality
ing stems produced per m2 of greenhouse area, and and homogeneity of variance in the residuals were
quality was the percentages of stems according to verified by means of the Shapiro-Wilk and Levene
the parameters of the select, fancy, standard and tests, respectively, to validate the adjusted model.
national grades. This classification was determined, All analyses were performed with the statistical soft-
among other characteristics, with the length and ware SAS v. 9.1.
Table 1. Nitrogen concentrations and ratios evaluated in the fertigation formula used in the cultivation of carnation cv. Don
Pedro grown in substrate.
Vegetative phase Productive phase
NH4+:NO3-
Treatments NH4+ NO3- Total N NH4+ NO3- Total N
(%) (mg L )
-1
5% N-NH4 +
5:95 10 190 8 152
15% N-NH4+ 15:85 30 170 200 24 136 160
25% N-NH4 +
25:75 50 150 40 120
5% N-NH4 +
5:95 7 133 5.6 106.4
30% less N 15% N-NH4 +
15:85 21 119 140 16.8 95.2 112
25% N-NH4+ 25:75 35 105 28 84
Rev. Colomb. Cienc. Hortic.PRODUCTIVITY AND QUALITY IN CARNATION WITH LESS NITROGEN 283
RESULTS AND DISCUSSION and even improve productivity with a more conserva-
tive fertigation formula for the nitrogen component.
Continuous growth analysis This finding is consistent with the significant in-
creases in productivity and quality variables reported
Among the treatments evaluated, the formula with by Kumar et al. (2016) with up to 150 mg L-1 of N in
less total N and a lower percentage of NH4+ (140- carnation plants cv. Red Corso. For NO3-: NH4+ ra-
112N-5% N-NH4+) presented a number of stems per tios, similar to that reported here, Khalaj et al. (2017)
plant significantly higher than the formula with more obtained the highest values for variables evaluated in
total N, with the highest percentages of ammoniacal Gerbera cvs. Stanza and Double Dutch with the low-
component; meanwhile, no significant differences est percentage of ammonium, i.e. the 80:20 ratio. On
were found for the variables length and diameter of the other hand, Dufour and Guerin (2005) found im-
the flowering stem (Tab. 2). There were no signifi- provements in development and yield in anthurium
cant statistical differences in the variables number of with increases in the NH4+:NO3- ratio, up to 0.37 of
leaves (average of 29.1 leaves per stem), length (be- the total N.
tween 42 and 53 mm) and diameter (average of 22
mm) of the floral bud (data not shown). It was evi- This study confirmed that concentrations of 140-
dent that it is feasible to maintain quality attributes 112 mg L-1 of N in the vegetative and reproductive
Table 2. Length, diameter and number of the flowering stems per plant of standard carnation cv. Don Pedro planted in substrate
and subjected to a decrease in total N and increases in the ammoniacal component in the fertigation formula.
Week after sowing
Treatments
10 12 14 16 18 20 22 24 26
Total N (mg L-1) N-NH4+ (%) Stem length (cm)
5 12.5 a 16.9 ab 26.6 a 37.5 a 56.8 a 76.5 a 82.6 a 88.3 a 92.8 a
200-160* 15 14.1 a 17.0 ab 28.0 a 42.7 a 66.0 a 81.3 a 86.6 a 86.6 a 87.5 a
25 14.3 a 18.3 ab 27.8 a 42.8 a 63.5 a 78.8 a 85.7 a 87.2 a 88.0 a
5 13.9 a 18.7 ab 28.3 a 42.2 a 62.0 a 79.5 a 87.5 a 88.6 a 88.6 a
140-112* 15 14.0 a 20.5 a 30.1 a 45.4 a 62.8 a 79.4 a 84.7 a 90.4 a 91.8 a
25 13.4 a 15.7 b 23.2 a 39.5 a 60.9 a 77.8 a 85.3 a 87.8 a 89.0 a
Standard error 0.36 0.41 0.77 1.37 1.98 1.17 1.16 1.08 1.25
Total N (mg L-1) N-NH4+ (%) Stem diameter (mm)
5 5.1 a 5.6 a 6.3 a 6.4 a 6.4 a 6.2 a 6.4 a 6.5 a 6.2 a
200-160* 15 5.8 a 6.5 a 7.1 a 7.4 a 7.3 a 7.0 a 6.8 a 6.9 a 6.9 a
25 5.2 a 5.9 a 6.8 a 7.1 a 7.1 a 7.0 a 6.8 a 6.8 a 6.8 a
5 4.3 a 5.5 a 6.8 a 7.3 a 7.2 a 6.9 a 6.4 a 6.4 a 6.4 a
140-112* 15 5.6 a 6.1 a 6.6 a 7.0 a 6.8 a 6.7 a 6.7 a 6.8 a 6.6 a
25 5.3 a 6.2 a 6.8 a 7.3 a 7.1 a 6.9 a 6.6 a 6.6 a 6.5 a
Standard error 0.15 0.10 0.09 0.10 0.10 0.12 0.09 0.09 0.11
Total N (mg L-1) N-NH4+ (%) Number of stems per plant
5 8.3 a 8.5 ab 8.8 ab 9.2 ab 9.2 ab 8.8 ab 8.8 ab 8.8 ab 8.8 ab
200-160* 15 7.7 a 7.8 b 7.8 b 7.8 b 7.8 b 7.8 b 7.8 b 7.8 b 7.8 b
25 7.8 a 8.2 ab 8.2 ab 8.2 b 8.2 b 8.2 b 8.2 b 8.2 b 8.1 b
5 10.0 a 10.3 a 10.3 a 10.7 a 10.7 a 10.7 a 10.5 a 10.5 a 10.4 a
140-112* 15 9.0 a 9.0 ab 9.0 ab 9.2 ab 9.3 ab 9.3 ab 9.3 ab 9.3 ab 9.2 ab
25 7.8 a 8.2 ab 8.2 ab 8.5 ab 8.5 ab 8.5 ab 8.5 ab 8.5 ab 8.4 ab
Standard error 0.23 0.23 0.23 0.23 0.22 0.23 0.22 0.22 0.22
* The first concentration is the one used in the vegetative phase and the second in the productive phase.
Means followed with different letters indicate significant differences by Tukey test (P≤0.05).
Vol. 13 - No. 2 - 2019284 BARACALDO / FLÓREZ / GONZÁLEZ
phases, respectively, are adequate for normal plant of the evaluated treatments, the trends of these vari-
development and that the number of stems per plant ables to elucidate the physiological behavior of the
is significantly lower in treatments with a higher submitted plants are presented to the treatments
concentration of total N, possibly because of a higher (Fig. 1).
percentage of N-NH4.
As expected, the LAI presented a pattern of gradual
growth in all treatments, with a tendency for bet-
Growth rates and indexes
ter yield in the treatments with a lower amount of
Although the calculated rates and indexes LAI, LMR, total N, independent of the NH4+ concentration.
SLA, RGR and NAR did not obtain significant statis- When the foliar area intercepts the maximum pho-
tical differences in any of the three samples in each tosynthetically active radiation, the optimal LAI is
A B
9
0.62
8 0.56
7 0.50
LMR 0.44
LAI
6
0.38
5
0.32
4 0.26
3 0.20
16 21 26 16 21 26
C D
130 0.045
0.040
120
0.035
RGR (g g-1 week -1)
110
SLA (cm2 g-1)
0.030
100 0.025
0.020
90
0.015
80
0.010
70 0.005
16 21 26 16 21 26
WAS
E
0.0007
200 - 160N - 5% N-NH4+
0.0006 200 - 160N - 15% N-NH4+
200 - 160N - 25% N-NH4+
0.0005 140 - 112N - 5% N-NH4+
NAR (g cm2 d-1)
0.0004 140 - 112N - 15% N-NH4+
140 - 112N - 25% N-NH4+
0.0003
0.0002
0.0001
0
16 21 26
WAS
Figure 1. Behavior of standard carnation cv. Don Pedro planted in substrate and subjected to increases in the ammoniacal com-
ponent of two fertigation formulas. (A) Leaf Area Index - LAI, (B) Leaf Mass Ratio - LMR, (C) Specific Leaf Area - SLA,
(D) Relative Growth Rate - RGR, and (E) Net Assimilation Rate - NAR. WAS = weeks after sowing.
Rev. Colomb. Cienc. Hortic.PRODUCTIVITY AND QUALITY IN CARNATION WITH LESS NITROGEN 285
obtained (Hunt, 1978); Criollo and García (2009), other plant structures. The highest value of this vari-
for radish, and Carranza et al. (2009), for lettuce, ob- able was seen in the treatments 200-160-15% N-NH4+
tained maximum LAI values of 3.4 and 6.8, respec- (commercial formula) and 140-112N-25% N-NH4+ at
tively. When Cárdenas et al. (2006) took into account 16 WAS; although the latter treatment had a higher
the leaf area of entire carnation plants cv. Nelson proportion of ammonium, the accumulation of dry
grown on substrate, they reported maximum LAI leaf mass was not affected.
values between 4.4 and 4.8; meanwhile, for the same
cv. at the second harvest peak, Baracaldo et al. (2010) In the formulas with more nitrogen, a tendency
reported maximum values between 7.5 and 8.7, simi- for greater translocation of dry mass was observed,
lar to those obtained in the present study. Therefore, in comparison with the treatments using the most
LAI values depend, among other factors, on the type conservative formulas. When increased to 25% of
of plant, variety, phenological stage of development N-NH4+ in the formula with high N, there was a
and agronomic management. When plants use N bet- decrease in the amount of biomass that is redirected
ter, the metabolism of carbon is optimized because to other structures of the plant. Therefore, it was in-
these processes modulate each other (Maldonado et ferred that, in the 200-160N-5% N-NH4+ treatment,
al., 2013), and leaf area affects the photosynthetic the plants would direct more dry mass for the forma-
carbon gain, which is reflected in the growth rate of tion of flower buds, as observed at 26 WAS (Tab. 3).
the plant (Taiz and Zeiger, 2002) through synthesis The marked decrease in the LMR from 16 to 21 WAS
of new biomass. in all treatments coincided with the maximum AGR
for the formation of flower buds (18 and 19 WAS).
In all treatments, there was a decrease in the LMR This relationship slowed down between 21 and 26
from the beginning of the trial, which indicated an WAS when these structures reached their definitive
inversion of photoassimilates in the formation of development.
Table 3. Dry mass of carnation plants cv. Don Pedro grown on substrate, with decrease of the total N and increases in the
component of N-NH4+ in the formula of fertigation.
Week after Treatment Dry mass (g)
sowing Total N (mg L )-1
N-NH4 (%)
+
Leaves Stems Root Flower bud Total
5 16.9 11.1 1.0 29.0
200 - 160* 15 13.5 7.9 0.7 22.1
25 15.0 12.4 0.8 28.2
16
5 15.4 11.7 0.9 28.0
140 - 112* 15 15.5 14.2 0.9 30.6
25 12.9 7.7 0.6 21.2
5 17.6 25.8 1.7 3.3 48.4
200 - 160* 15 16.4 23.1 0.9 0.9 41.4
25 15.1 27.7 1.3 2.3 46.5
21
5 17.2 25.6 1.6 1.1 45.4
140 - 112* 15 18.0 28.3 1.4 1.8 49.4
25 16.4 22.3 1.8 1.3 41.8
5 17.7 33.1 2.9 12.3 65.9
200 - 160* 15 17.7 32.1 2.3 8.2 60.3
25 20.9 35.2 2.6 7.6 66.3
26
5 20.2 35.0 2.4 10.8 68.4
140 - 112* 15 18.3 36.9 2.1 8.0 65.4
25 25.8 33.5 2.1 11.2 72.6
* The first concentration is the one used in the vegetative phase and the second in the productive phase.
Vol. 13 - No. 2 - 2019286 BARACALDO / FLÓREZ / GONZÁLEZ
Although in treatments 200-160N-5% N-NH4+ and content of total N, the contents of Cu and Zn were
200-160N-15% N-NH4+, the SLA started low at 16 significantly increased; the increase in NH4+ signifi-
WAS (Fig. 1C); treatments 200-160N-25% N-NH4+ cantly raised the contents of N and Zn and reduced
and 140 -112N-5% N-NH4+ had the same response Mg. The highest Mg content was observed at 16 and
profile, that is, they had a greater leaf area in relation 21 WAS in treatments with the lowest percentage
to their dry mass, becoming sources of carbohydrates of NH4+ (5%). Thus, from the nutritional point of
for sink organs between 16 and 21 WAS. The other view, the better yield in the conservative treatments
treatments, although they were sources of assimi- for total nitrogen was understandable, with a lower
lates, exported them less efficiently: in the 140-112N- percentage of ammonium.
15% N-NH4+ treatment, what was synthesized was
exported without affecting the SLA, and, in the 140- Similar to RGR, the same response groups, possi-
112N-25% N-NH4+, less than what was synthesized bly associated with the percentage of ammonium
was translocated, reducing the SLA and maintaining (Fig. 1E), were evident for NAR. For this parame-
a good amount of the biomass it synthesized in the ter, the highest initial NAR value was observed in
leaves (Tab. 3). A high SLA indicates greater foliar area treatment 200-160N-15% N-NH4+. NAR represents
with light leaves and, consequently, greater capacity the photosynthetic efficiency and decreases in the
to capture light and produce carbohydrates. An SLA course of the development of the flowering stem,
increase response indicates a constant partitioning behavior that is associated with the leaf area exist-
of carbohydrates to sinks with high demand. With ing in the first days after the pinch, when the leaves
the most conservative fertigation formulas for total are more exposed to radiation and are more efficient
N, the ammoniacal component played a preponder- at the assimilation of CO2. At the end of the cycle,
ant role, where the highest percentage negatively af- similar values were seen in all treatments, with the
fected the SLA, as seen in the 140-112N-25% N-NH4+ smallest increases in total dry mass resulting from,
treatment (Fig. 1C). among other factors, processes of foliar senescence,
high planting density and plant architecture, which
For RGR, two response groups were observed (Fig. generate leaf shady, which causes a reduction in
1D): in the group of treatments with a higher RGR, photosynthetic efficiency (Fig. 1E).
140-112N-25% N-NH4+ stood out, which means that
it was the most efficient treatment in the accumula-
tion of new biomass to the system. This was reflected Productivity and quality
in leaves with the lowest SLA towards 26 WAS (Fig.
1C). This was explained by a reduction in the leaf Taking into account the nitrogen factor, no statisti-
area and an increase in the biomass, as shown in Tab. cally significant difference was found between the
3, verifying that, in this treatment, the plants invest- 200-160N and 140-112N treatments, with productiv-
ed more dry mass in the leaves and flower buds at the ity averages of 83.5 and 87.9 stems/m2 of greenhouse
expense of the stems and roots. In the second group, area, respectively; it follows that the same level of
with a lower initial RGR (200-160N-5% N-NH4+ and productivity could be achieved with less total nitro-
140-112N-15% N-NH4+), regardless of the total N gen in the formula. However, the increases in N doses
concentration, were not found the highest percent- used by Thakulla et al. (2018) in exotic carnation var.
ages of ammonium, which would stimulate the ac- Chabaud had a positive effect on most of the param-
cumulation of new initial biomass. According to eters attributed to growth and flowering, with the
Grime and Hunt (1975), the highest RGR value was exception of the maximum dose, which delayed the
obtained in plants grown under conditions of greater time to flowering. For this variable, the minimum
fertility. In gerbera, an increase in the proportion of time was obtained with 300 kg ha-1 of N, while the
NH4+ in the nutrient solution resulted in larger fresh maximum plant height, the length of the flowering
and dried masses in the shoots and roots, with higher stem and the number of branches were obtained with
values in the 80:20 (NO3-:NH4+) ratio (Khalaj et al., a rate of 400 kg ha-1 of N.
2017).
On the other hand, there was a decrease in the per-
For Baracaldo et al. (2018), a reduction of total nitro- centage of stalks in the Select quality grade as the
gen and an increase in the NH4+: NO3- ratio in the percentage of ammonium increased, with a conse-
fertigation formula modified nutrient contents in quent increase in the percentage of flowering stems
carnation cv. Don Pedro plant tissue: with the lower in the Fancy quality grade (Fig. 2).
Rev. Colomb. Cienc. Hortic.PRODUCTIVITY AND QUALITY IN CARNATION WITH LESS NITROGEN 287
80
70
60
Percentage
50
40
30
20
10
0
National Standard Fancy Select
Quality grade
200 - 160N - 5% N-NH4+ 200 - 160N - 15% N-NH4+
200 - 160N - 25% N-NH4+ 140 - 112N - 5% N-NH4+
140 - 112N - 15% N-NH4+ 140 - 112N - 25% N-NH4+
Figure 2. Quality of standard carnation flowering stems cv. Don Pedro planted in substrate subjected to different nitrogen fer-
tilization treatments.
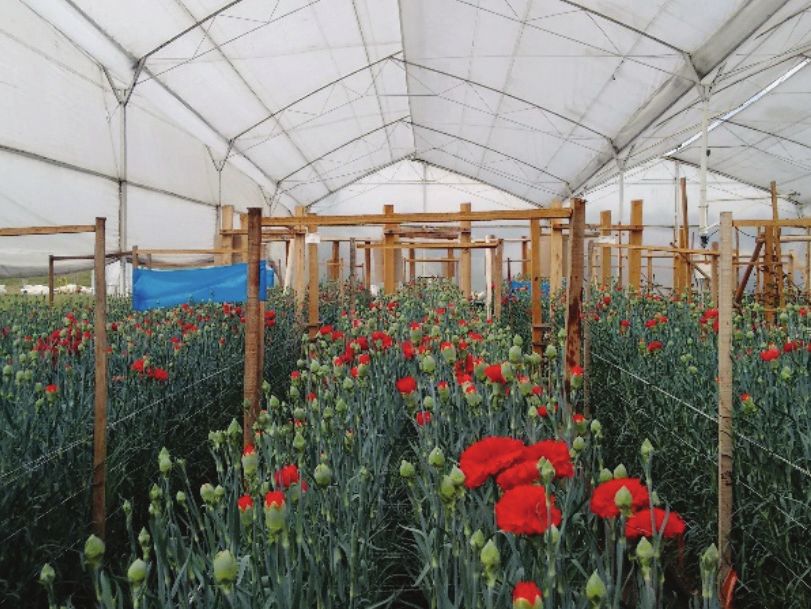
Although there would not be a statistical difference,
45
productivity would increase to four more stems per a
40
Nitrogen use efficiency (g g-1)
m2 with a higher degree of quality and the economy
35
in the cost of the fertilizer and in the environmental
30
impact would result in higher profits for producers. b a
25 a
20
Achievements in productivity and quality based on 15
particular NH4+:NO3- ratios were addressed by Ta- a a
10
batabaei et al. (2006) in strawberries, based on bet- 5
ter calcium-based nutrition and increases in leaf area 0
and photosynthesis rate, and better SPAD values and 16 21 26
WAS
quantum yield of PSII (Fv/Fm) (Roosta, 2014), or, in
tulips, with maximum concentrations of Ca and Mg, 200 - 160 N 140 - 112 N
flower longevity, dry mass and optimal N, P, K (Abasi
et al., 2016).
Figure 3. Efficiency in the use of nitrogen in standard car-
nation plants cv. Don Pedro planted in substrate
under different nitrogen fertilization treatments.
Nitrogen use efficiency - NUE Means followed with different letters indicate sig-
nificant differences by Tukey test (P≤0.05).
At 21 WAS, the plants of the 140-112 N treatment
presented a significantly higher NUE value compared
to the treatment with the highest N concentration,
indicating that the gain of dry mass resulted from a proteins in the process of foliar senescence, and the
more efficient use of N (Fig. 3). Dry mass produc- released amino acids and other N compounds must
tion is closely related to NUE. In this experiment, no be efficiently directed towards sink organs. This step
statistically significant differences were found in the is a critical component to improving NUE and thus
dry mass values (Tab. 3), hence the plants fertilized avoiding wasted proteins and amino acids.
with the lowest concentration of N had higher NUE
values, in a manner consistent with that reported by In oats with applications of 80, 100 and 120 kg ha-1
Good et al. (2004) and Lupini et al. (2017). of N, it was found that NUE decreased significant-
ly with increasing doses of N, with values of 38.3,
With the onset of the reproductive phase, accord- 34.7 and 30.2 kg of grain/kg of N applied, respec-
ing to Kant (2018), there is a parallel breakdown of tively (Rahman et al., 2011). This coincides with that
Vol. 13 - No. 2 - 2019288 BARACALDO / FLÓREZ / GONZÁLEZ
obtained in this study, where the higher concentra- Invernaderos: La experiencia iberoamericana. Progra-
tions of N (200 and 160 mg L-1) had a lower NUE than ma Cyted, Almería, Spain.
the lowest concentration. To achieve a greater NUE Baracaldo, A.P., M.C. Díaz, V.J. Flórez, and C.A. González.
in carnation cv. Gaduina, a constant release of the N 2018. Efecto de la disminución de N total y aumen-
incorporated in the soil is required (Muthukrishnan to de NH4+ en la fórmula de fertirriego en el cultivo
et al., 2014). de clavel. Rev. Colomb. Cienc. Hortic. 12(3), 658-667.
Doi: 10.17584/rcch.2018v12i3.8062
Baracaldo A., A.P., A. Ibagué O., and V.J. Flórez R. 2010. Ta-
sas e índices de crecimiento a segundo pico de cosecha
CONCLUSIONS en clavel estándar cv. Nelson cultivado en suelo y en
sustratos. Agron. Colomb. 28(2), 209-217.
In both fertigation formulas:
Barker, A. and G. Bryson. 2007. Nitrogen. pp. 22-23. In: Bar-
• similar productivity and qualities were obtained, ker, A.V. and D.J. Pilbeam (eds.). Handbook of plant
nutrition. CRC Press. Taylor and Francis, Boca Raton,
and the formula with less total N had better NUE,
FL.
mitigating the negative environmental impact of
this nutrient. Bar-Yosef, B. 2008. Fertigation management and crops res-
ponse to solution recycling in semi-closed greenhou-
ses. pp. 341-424. In: Raviv, M. and J.H. Lieth (eds.).
• the ammoniacal component plays a preponderant
Soilless culture: theory and practice. Elsevier, Amster-
role: the number of flowering stems per plant de- dam. Doi: 10.1016/B978-044452975-6.50011-3
creased as the ammonium component increased,
similar to that observed with the percentage of Cabrera, R.I. 2006. Consideraciones sobre nutrición mine-
ral y fertilización en rosas. pp. 145-161. In: Flórez R.,
flowering stems in the Select quality grade.
V.J., A. de la C. Fernández, D. Miranda, B. Chaves C.,
and J.M. Guzmán P. (eds.). Avances sobre fertirriego
en la floricultura colombiana. Unibiblos, Bogota.
ACKNOWLEDGMENTS
Cameron, K.C., H.J. Di, and J.L. Moir. 2013. Nitrogen losses
The authors thank the Asociación Colombiana de Ex- from the soil/plant system: a review. Ann. Appl. Biol.
portadores de Flores - Asocolflores, the Centro de In- 162(2), 145-173. Doi: 10.1111/aab.12014
novación de la Floricultura Colombiana - Ceniflores, Cárdenas M., C.A., I.F. Rivera G., V.J. Flórez R., B. Cha-
the government of Cundinamarca and the Univer- ves C., and W. Piedrahíta C. 2006. Growth analysis
sidad Nacional de Colombia, co-financing entities of standard carnation cv. ‘Nelson’ in different subs-
and managers of the project “Fortalecimiento de la trates. Acta Hortic. 718, 623-629. Doi: 10.17660/
ActaHortic.2006.718.73
competitividad del sector floricultor colombiano me-
diante el uso de ciencia, tecnología e innovación apli- Carranza, C., O. Lanchero, D. Miranda, and B. Chaves.
cadas en Cundinamarca”, in which the present study 2009. Análisis del crecimiento de lechuga (Lactuca sati-
was developed. The authors also thank Brenntag Co- va L.) ‘Batavia’ cultivada en un suelo salino de la Saba-
na de Bogotá. Agron. Colomb. 27(1), 41-48.
lombia S.A. for supplying the nutritional solutions.
Carrillo P., I.F., B. Mejía M., and A. Franco H.F. 1994. Ma-
Conflict of interests: the manuscript was prepared nual de laboratorio para análisis foliares. Cenicafé,
and reviewed with the participation of the authors, Chinchina, Colombia.
who declare that there exists no conflict of interest Criollo, H. and J. García. 2009. Efecto de la densidad de
that puts in risk the validity of the presented results. siembra sobre el crecimiento de plantas de rábano
(Raphanus sativus L.) bajo invernadero. Rev. Co-
lomb. Cienc. Hortic. 3(2), 210-222. Doi: 10.17584/
rcch.2009v3i2.1214
BIBLIOGRAPHIC REFERENCES Daza, M.C., J. Díaz, E. Aguirre, and N. Urrutia. 2015. Efec-
Abasi, H., M. Babalar, H. Lessani, and R. Naderi. 2016. to de abonos de liberación lenta en la lixiviación de
Effects of nitrogen form of nutrient solution on up- nitratos y nutrición nitrogenada en estevia. Rev. Co-
take and concentration macro element and morpho- lomb. Cienc. Hortic. 9(1), 112-123. Doi: 10.17584/
logical trait in hydroponic tulip. J. Plant Nutr. 39(12), rcch.2015v9i1.3750
1745-1751. Doi: 10.1080/01904167.2016.1201110
Dufour, L. and V. Guérin. 2005. Nutrient solution effects
Acuña C., J.F. and D.M. Ortiz P. 2004. Estructuras de in- on the development and yield of Anthurium andrea-
vernadero: la experiencia colombiana. pp. 83-107. En: num Lind. in tropical soilless conditions. Sci. Hortic.
Acuña C., J.F., D.L. Valera M., and J.C. Avendaño (eds.) 105(2), 269-282. Doi: 10.1016/j.scienta.2005.01.022
Rev. Colomb. Cienc. Hortic.PRODUCTIVITY AND QUALITY IN CARNATION WITH LESS NITROGEN 289
Escandón L., J.D. 2009. Propuesta logística para el desarrollo Jin, X., G. Yang, C. Tan, and C. Zhao. 2015. Effects of ni-
de la exportación de rosas y claveles a estados unidos trogen stress on the photosynthetic CO2 assimilation,
para la comercializadora Export Flexy Ltda. Undergra- chlorophyll fluorescence, and sugar-nitrogen ratio in
duate, Pontificia Universidad Javeriana, Bogota. corn. Sci. Rep. 5, 1-9. Doi: 10.1038/srep09311
FAO. 2017. World fertilizer trends and outlook to 2020. Li, J., J.M. Zhou, and Z.Q. Duan. 2007. Effects of eleva-
Summary report. Food and Agriculture Organization ted CO2 concentration on growth and water usage of
of United Nations, Rome. tomato seedlings under different ammonium/nitrate
ratios. J. Environ. Sci. 19(9), 1100-1107. Doi: 10.1016/
Flórez R., V.J., R. Parra R., M. Rodríguez S., and D.E. Nieto
C. 2006a. Características y fundamentos del proyecto S1001-0742(07)60179-X
“Producción más limpia de rosa y clavel con dos técni- Kant, S. 2018. Understanding nitrate uptake, signaling and
cas de cultivo sin suelo en la Sabana de Bogotá”. pp. remobilisation for improving plant nitrogen use effi-
3-40. In: Flórez R., V.J., A. de la C. Fernández M., D. ciency. Semin. Cell Dev. Biol. 74, 89-96. Doi: 10.1016/j.
Miranda L., B. Chaves C., and J.M. Guzmán P. (eds.). semcdb.2017.08.034
Avances sobre fertirriego en la floricultura colombia-
Khalaj, M.A., S. Kiani, A.H. Khoshgoftarmanesh, and R.
na. Unibiblos, Bogota.
Amoaghaie. 2017. Growth, quality, and physiologi-
Flórez R., V.J., D. Miranda L., B. Chaves C., L.A. Chaparro cal characteristics of gerbera (Gerbera jamesonii L.)
T., C.A. Cárdenas M., and A. Farías A. 2006b. Paráme- cut flowers in response to different NO3−:NH4+ ra-
tros considerados en el análisis de crecimiento en rosa tios. Hortic. Environ. Biotechnol. 58(4), 313-323. Doi:
y clavel en los sistemas de cultivo en suelo y en sus- 10.1007/s13580-017-0067-7
trato. pp. 43-52. In: Flórez R., V.J., A. de la C. Fernán- Kiba, T., T. Kudo, M. Kojima, and H. Sakakibara. 2011. Hor-
dez, D. Miranda L., B. Chaves C., and J.M. Guzmán monal control of nitrogen acquisition: Roles of auxin,
P. (eds.). Avances sobre fertirriego en la floricultura abscisic acid, and cytokinin. J. Exp. Bot. 62(4), 1399-
colombiana. Unibiblos, Bogota. 1409. Doi: 10.1093/jxb/erq410
Florian-Martínez, P. and D. Roca. 2011. Sustratos para el Kumar, A., G.-S. Rana, R. Sharma Prince, and D.-S. Dahiya.
cultivo sin suelo. Materiales, propiedades y manejo. 2016. Flowering of carnation as influenced by diffe-
pp. 37-78. In: Flórez R., V.J. (ed.). Sustratos, manejo rent levels of nitrogen and Azotobacter strains. Indian
del clima, automatización y control en sistemas de Hortic. J. 6(2), 222-225.
cultivo sin suelo. Editorial Universidad Nacional de
Colombia, Bogota. Lupini, A., M.P. Princi, F. Araniti, A.J. Miller, F. Sunseri, and
M.R. Abenavoli. 2017. Physiological and molecular
Gárate, A. and I. Bonilla. 2013. Nutrición mineral y pro- responses in tomato under different forms of N nu-
ducción vegetal. pp. 143-164. In: Azcón-Bieto, J. and trition. J. Plant Physiol. 216, 17-25. Doi: 10.1016/j.
M. Talón. (ed.). Fundamentos de fisiología vegetal. 2nd jplph.2017.05.013
ed. McGraw Hill - Interamericana de España, Madrid.
Maldonado, J.M., E. Agüera, and R. Pérez-Vicente. 2013.
Good, A.G., A.K. Shrawat, and D.G. Muench. 2004. Can Asimilación del nitrógeno y del azufre. pp. 287-303.
less yield more? Is reducing nutrient input into the In: Azcón-Bieto, J. and M. Talón (ed.). Fundamentos
environment compatible with maintaining crop de fisiología vegetal. 2nd ed. McGraw Hill - Interameri-
production? Trends Plant Sci. 9(12), 597-605. Doi: cana de España, Madrid.
10.1016/j.tplants.2004.10.008
Muthukrishnan, R., K. Arulmozhiselvan, M. Jawaharlal,
Grime, J.P. and R. Hunt. 1975. Relative growth-rate: its ran- and T. Padmavathi. 2014. Recovery of fertilizer nitro-
ge and adaptive significance in a local flora. J. Ecol. gen by carnation grown with nutripellet pack and soil
63(2), 393. Doi: 10.2307/2258728 nitrogen retention using 15 N tracer. Res. Envirom,
Hawkesford, M., W. Horst, T. Kichey, H. Lambers, J. Sch- Life Sci. 7(4), 271-274.
joerring, I. Møller, and P. White. 2012. Functions of Ordoñez D., N. and A. Bolivar G. 2014. Levantamiento
macronutrients. pp 135-189. In: Marschner, H. and P. agrológico del Centro Agropecuario Marengo (CAM).
Marschner (eds.). Mineral nutrition of higher plants. Instituto Geográfico Agustín Codazzi – IGAC, Bogota.
3rd ed. Academic Press, San Diego, CA. Doi: 10.1016/
Rahman, M.A., M.A.Z. Sarker, M.F. Amin, A.H.S. Jahan,
B978-0-12-384905-2.00006-6
and M.M. Akhter. 2011. Yield response and nitrogen
Hunt, R. 1978. Plant growth analysis. Edward Arnold Pub- use efficiency of wheat under different doses and split
lishers, London. application of nitrogen fertilizer. Bangladesh J. Agric.
Res. 36, 231-240. Doi: 10.3329/bjar.v36i2.9249
ICA, Instituto Colombiano Agropecuario; MADR, Minis-
terio de Agricultura y Desarrollo Rural. 2015. Relación Reid, M. and D. Hunter. 2000. Manejo de la poscosecha.
entre el consumo aparente de fertilizantes y la super- Biología y tecnología de la poscosecha. pp. 165-181.
ficie bajo uso agrícola. In: Dane: www.dane.gov.co; In: Pizano de Marquez, M. (ed.). Clavel (Dianthus car-
consulted: April, 2017. yophyllus). Ediciones Hortitecnia, Bogota.
Vol. 13 - No. 2 - 2019290 BARACALDO / FLÓREZ / GONZÁLEZ
Roosta, H.R. 2014. Effect of ammonium:nitrate ratios Caryophyllus var. Chabaud) under different do-
in the response of strawberry to alkalinity in hy- ses of nitrogen. Int. J. Hort. Agric. 3(2), 1-3. Doi:
droponics. J. Plant Nutr. 37(10), 1676-1689. Doi: 10.15226/2572-3154/3/2/00120
10.1080/01904167.2014.888749 Ucar, Y., S. Kazaz, F. Eraslan, and H. Baydar. 2017. Effects
Schipper, L.A., W.D. Robertson, A.J. Gold, D.B. Jaynes, of different irrigation water and nitrogen levels on
and S.C. Cameron. 2010. Denitrifying bioreactors: the water use, rose flower yield and oil yield of Rosa
an approach for reducing nitrate loads to receiving damascena. Agric. Water Manag. 182, 94-102. Doi:
waters. Ecol. Eng. 36(11), 1532-1543. Doi: 10.1016/j. 10.1016/j.agwat.2016.12.004
ecoleng.2010.04.008
Vojtíšková, L., E. Munzarová, O. Votrubová, A. Rihová, and
Tabatabaei, S.J., L.S. Fatemi, and E. Fallahi. 2006. B. Juˇricová. 2004. Growth and biomass allocation of
Effect of ammonium: nitrate ratio on yield, cal- sweet flag (Acorus calamus L.) under different nutrient
cium concentration, and photosynthesis rate in conditions. Hydrobiol. 518, 9-22. Doi: 10.1023/B:HY-
strawberry. J. Plant Nutr. 29(7), 1273-1285. Doi: DR.0000025052.81373.f3
10.1080/01904160600767575
Zhang, H., D. Chi, Q. Wang, J. Fang, and X. Fang. 2011.
Taiz, L. and E. Zeiger 2002. Plant physiology. Sinauer Asso- Yield and quality response of cucumber to irrigation
ciates Publishers, Sunderland, MA. and nitrogen fertilization under subsurface drip irriga-
Thakulla, D., A. Khanal, and L.R. Bhatta. 2018. Adap- tion in solar greenhouse. Agric. Sci. China. 10(6), 921-
tability of exotic variety of carnation (Dianthus 930. Doi: 10.1016/S1671-2927(11)60077-1
Rev. Colomb. Cienc. Hortic.You can also read