Keysight Technologies U2020 X-Series - USB Peak and Average Power Sensors Demo Guide
←
→
Page content transcription
If your browser does not render page correctly, please read the page content below

Keysight Technologies
U2020 X-Series
USB Peak and Average Power Sensors

                                     Demo Guide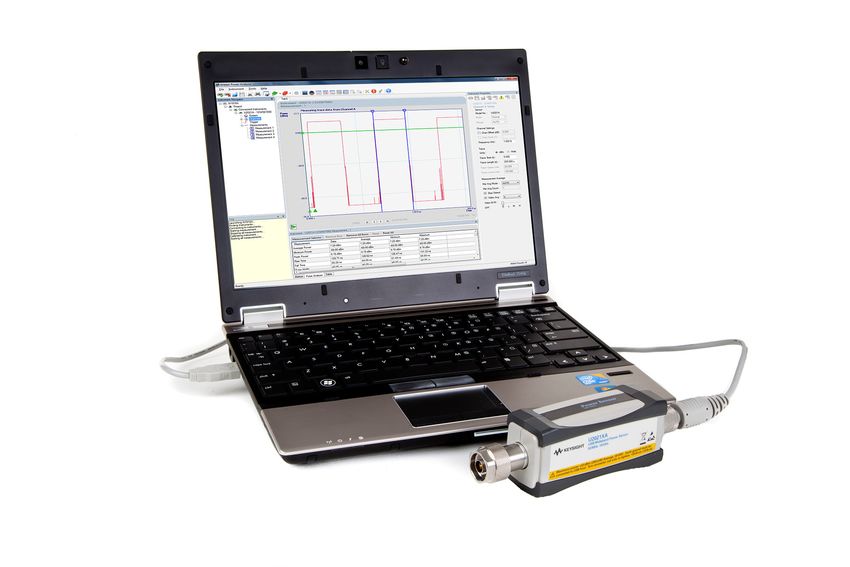
Demonstration Preparation
                                              The instruments and software listed in the table below are required to perform
                                              the demonstrations.
                                               Product Type                            Minimum System Requirement
                                                                                           –– U2021XA or U2022XA
                                               Keysight U2020XA Series USB peak
                                                                                           –– Firmware version A.01.00 or
                                               and average power sensors
                                                                                              later
                                               Keysight USB 2.0 compliant cable,
                                               Mini-B connector with locking               –– U2031A, U2031B, U2031C
                                               mechanism
                                                                                           –– Firmware version A.01.80 or
                                                                                              later
                                               Keysight N5182A MXG Signal Vector           –– Frequency range option 503 or
                                               Analyzer                                       506
                                                                                           –– Baseband generator option 651
                                                                                              or 652
                                               Keysight IO Libraries Suite               Version 16.2.xx or later
                                               Keysight N1918A Power Analysis
                                                                                         Power Analyzer (R03.05.xx or later)
                                               Manager

                                              To download and update the instrument firmware or software, please visit:
                                              www.keysight.com/find/usbpeaksensor

                                              Instructions for PC, U2021XA, and
                                              MXG Connectivity
                                              Procedures
                                                1.    Connect the Laptop (installed with the N1918A Power Analysis Manager,
                                                      Power Analyzer) to the U2021XA USB power sensors via the USB
                                                      Mini-B cable.
                                                2.    Connect the U2021XA USB power sensors to the RF Output of the
                                                      N5182A MXG signal generator shown in Figure 1.
                                                3.    Connect the BNC-SMB cable from the N5182A MXG signal generator’s
                                                      rear panel Event 1 to the Trig In socket on the U2021XA USB power
                                                      sensor.
                                                4.    Launch the Keysight Connection Expert application (Keysight IO Libraries
                                                      Suite) and verify the connection of the U2021XA USB power sensors.

                                                          BNC-SMB cable
                               Event 1

                                                                                       Trig In

                                                                                      USB Mini-B
                 N5182A MXG Signal Generator                        U2021XA Series                           Laptop
                                                                                        cable
                                                                   USB Power Sensor
Figure 1. Laptop, U2021XA and MXG signal generator setup diagram

    1.    Alternatively, you can substitute the N5182A MXG with the E4438C ESG Vector Signal Generator, firmware
          revision C.04.98 or later, frequency range option 503 or 506, and baseband generator option 601 or 602

                                                                   2
Keysight N1918A Power Analysis Manager
The Keysight Technologies, Inc. N1918A Power Analysis Manager, Power Analyzer is a Windows-based free license application
software for the U2020XA Series USB Peak and Average power sensors. This application software enables you to perform
advanced power analysis measurements in real time.

For more information on the N1918A Power Analysis Manager, refer to the Keysight N1918A Power Analysis Manager
Datasheet, Literature Number 5989-6612EN

                                                           3
Demonstration 1
Average Power Measurement in Compact Mode Display

                               In this guide, keystrokes surrounded by [ ] represent front panel keys of the
         Objectives
                               instruments, keystrokes surrounded by { } represent softkeys of the instrument,
To demonstrate the capabil-    and keystrokes in bold represent the softkeys of the software.
ity of the Power Analyzer to
perform power measurement
and switch the measurement     Instructions                           Keystrokes
display to compact mode.       On the MXG
                               1.   Set instrument to its default
                                                                      Press [Preset]
                                    settings
                               2.   Set the frequency and ampli-
                                    tude                                –– Press [Frequency] [1] {GHz}
                                    Frequency = 1 GHz                   –– Press [Amplitude] [0] {dBm}
                                    Amplitude = 0 dBm
                               3.   Turn on the RF Output               –– Turn [RF On/Off] to “On”
                               In the Power Analyzer
                                                                      Double-click on the Power Analyzer
                                                                      application software shortcut on your
                                                                      desktop or access the program via the
                                                                      Windows Start menu.
                                                                      (Note: The latest version of Power
                                                                      Analyzer demonstrated in this demo
                               4.   Run the Power Analyzer            guide will start the measurement upon
                                                                      running of the
                                                                      application software)
                                                                        –– Click {channel} on the Instrument
                               5.   Set the frequency to 1 GHz             Navigator panel
                                    (See Figure 2)                      –– Set Frequency (Hz) to “1G” on the
                                                                           Instrument Properties panel
                                                                        –– Move the cursor to highlight
                               6.   Switch the normal mode dsplay          instrument measurement 1
                                    to compact mode (See Figure 3)      –– Click Switch {   } the Power
                                                                           Analyzer toolbar
                               7.   Switch the compact mode
                                                                      Click Switch {    } on the Power Ana-
                                    to normal mode display (soft
                                                                      lyzer
                                    panel)

                               8.   Stop the measurement              Click Stop {     } on the Power Analyzer

                                                 4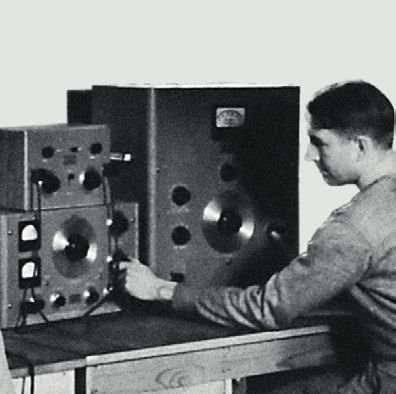
Figure 2. Average power measurement shown in normal mode display (soft panel)

Figure 3. Compact mode display show the average power
measurement

                                                                        5
Demonstration 2
Enable Alert, Limit, and Recording using Power Analyzer

           Objectives                   Instructions                          Keystrokes
                                        (Continue from Demo 1)
  –– To demonstrate the alert func-
                                        On the MXG
     tions where the system will
     notify you the exact time and      1.   Set amplitude power to 0.1 dBm Press [Amplitude], [0.1], {dBm}
     date the power measurements
     of your DUT has exceeded           In the Power Analyzer
     the specified upper and lower
     limits. Alert functions are es-                                           –– Click Create Strip Chart {     } on
                                                                                  Power Analyzer toolbar.
     pecially useful for applications   2.   Add strip chart display
     such as aging and reliability                                             –– Select “Meas ID” and “Current
     text where long test times are                                               Active Tab”, then click “OK”
     required.
  –– To demonstrate the strip chart                                            –– Click Stop {     } on the Power
     function in the Power Analyzer                                               Analyzer toolbar
     application software, which                                               –– Move the cursor to highlight
     allows the user to monitor, re-                                              normal mode display
     cord, and playback the power       3.   Delete the normal mode display
     measurements tend for a long                                              –– Click {    } to delete normal
     period of time.                                                              mode display

                                                                               –– Click Run {     } to continue
                                                                                  the measurement
                                                                               –– Click {Measurements} on the
                                        4.   Enable limit and alert of            Instrument Navigator panel
                                             measurement (See Figure 4)        –– In Instrument Properties panel,
                                             Upper Limit = 0.1 dB                 check “Enable Alert”
                                             Lower Limit = –0.1 dB             –– Set Upper Limit to “0.1” and Lower
                                                                                  Limit to “–0.1”

                                                                               –– Click Stop {        } on the Power
                                                                                  Analyzer toolbar
                                                                               –– Move the cursor to highlight
                                                                                  normal mode display
                                                                               –– Click Recorder {      } on the Power
                                        5.   Enable recording function            Analyzer toolbar.
                                             (See Figure 6)                    –– The Recorder menu will prompt
                                                                                  up, select specific time for
                                                                                  recording and enter the recording
                                                                                  file name. In this example, select
                                                                                  “Immediately” and enter the
                                                                                  filename as “Texting” then click
                                                                                  “OK”

                                                          6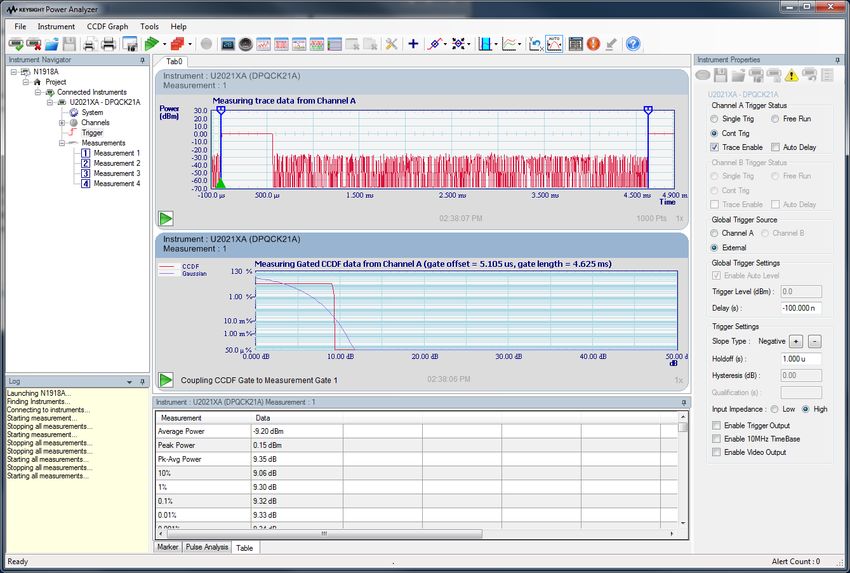
Figure 4. Alert Limits textbox allows user to enter upper/lower limit as per their requirements

                                                                    Figure 5. Click Alert Indicator {   } to view the alert summary as shown here in order
                                                                    to identify the timestamp where the measurement was over the alert limit

Figure 6. Recording file saved as *.csv can be
viewed via MS Excel
                                                                              7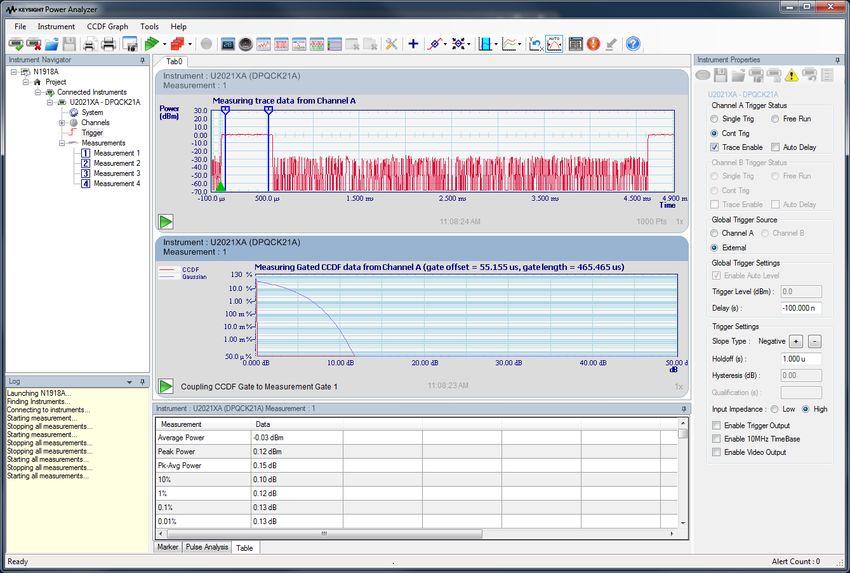
Demonstration 3                       Instructions                          Keystrokes
                                      On the MXG
Pulse Power Measurement               1.   Set instrument to its default
                                                                            Press [Preset]
                                           settings
          Objectives                  2.   Set the frequency and ampli-
                                           tude                              –– Press [Frequency] [1] {GHz}
 –– To demonstrate the capability          Frequency = 1 GHz                 –– Press [Amplitude] [0] {dBm}
    of the U2021XA Series USB              Amplitude = 0 dBm
    power sensors to obtain
                                                                             –– {Pulse Period}, [40], {μsec}
    15-point pulse parameter          3.   Set the pulse signal
                                                                             –– {Pulse Width}, [10], {μsec}
    values from the trace graph,
    where the parameters values       4.   Activate the pulse signal        Toglle {Pulse On/Off} to “On”
    are automatically                 5.   Turn on the RF Output            Toglle [RF On/Off] to “On”
    calculated by the Power           In the Power Analyzer
    Analyzer application software
                                                                            Double-click on Power Analyzer
    whenever a trace pattern
                                                                            application software shortcut on your
    appears on the graph.             6.   Run the Power Analyzer
                                                                            desktop or access the program via the
 –– To demonstrate the capability                                           Windows Start menu.
    of the dual gates feature to
                                                                             –– Click {channel} on the Instrument
    measure the pulse width                                                     Navigator panel.
                                      7.   Set the frequency to 1 GHz
    and pulse period signal
                                           (See Figure 7)                    –– Set Frequency (Hz) to “1G” on the
    respectively.
                                                                                Instrument Properties panel.
 –– In this demo, pulse signal with
    pulse period 40 μs and pulse
                                                                             –– Click {     } on the Power
    width 10 μs will be generated
                                      8.   Add trace graph display              Analyzer toolbar.
    from the signal generator.
                                                                             –– Select “Meas ID” and “Current
    The U2021XA Series USB
    power sensors measures the                                                  Active Tab” then click “OK”.
    average, peak, and peak-to-
                                                                             –– Click Stop {   } on the Power
    average of the pulse signal via
                                                                                Analyzer toolbar
    the dual gated feature.
                                                                             –– Move the cursor to highlight the
                                      9.   Delete the normal mode display       normal mode display and click {
                                                                                    } to delete the normal mode
                                                                                display.
                                                                             –– Click Run {  } to continue the
                                                                                measurement.
                                      Measure Pulse Width Signal
                                                                            Move the cursor to highlight the trace
                                                                            graph display. Right-click on the trace
                                      10. Add dual gates to measure
                                                                            graph display and select “Apply Gate
                                          pulse width signal, 10 μs (See
                                                                            Option”, Gate 1. Move the dual gated
                                          Figure 8)
                                                                            (vertical line) to the highlighted pulse
                                                                            width duration.
                                      Measure Pulse Period Signal
                                                                            Move the cursor to highlight the trace
                                                                            graph display. Right-click on the trace
                                      11. Add dual gates to measure
                                                                            graph display and select “Apply Gate
                                          pulse period signal, 40 μs (See
                                                                            Option”, Gate 2. Move the dual gated
                                          Figure 9)
                                                                            (vertical line) to the highlighted pulse
                                                                            width duration.
                                                                            In the Measurement Panel (bottom of
                                                                            the trace graph display), click “Mea-
                                      12. Add 15-point pulse parameter
                                                                            surement Selector”, then check “Select
                                          values from the trace graph
                                                                            All” under Pulse Measurement menu,
                                          display (See Figure 10)
                                                                            and click
                                                                            “Apply”.

                                                          8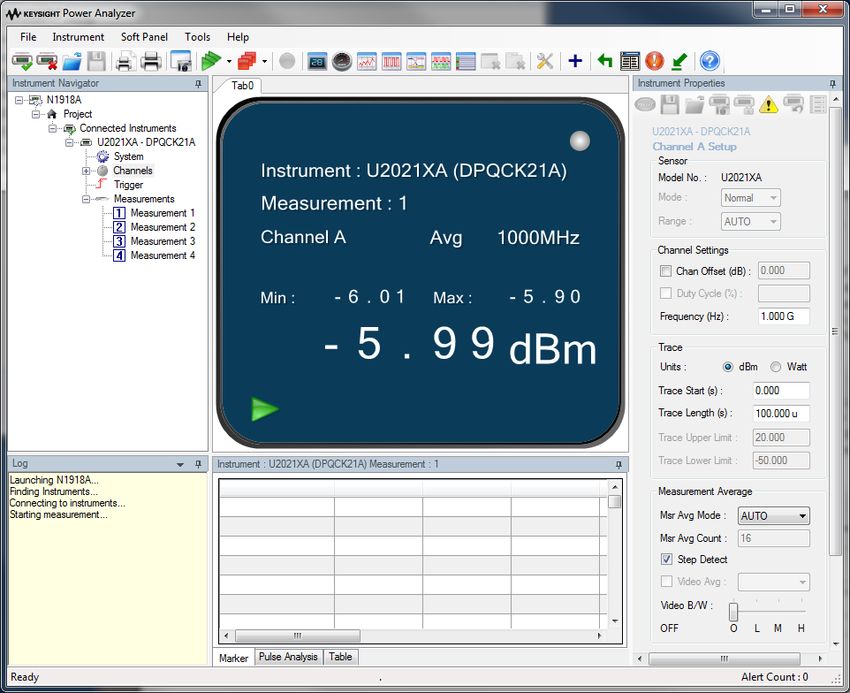
Figure 7. Average power measurement of pulse signal (pulse period 40 μs and pulse width 10 μs)

Figure 8. Pulse width measurement (delta time, average, peak and peak-to-average) blue line shown in Pulse Analysis table

                                                                           9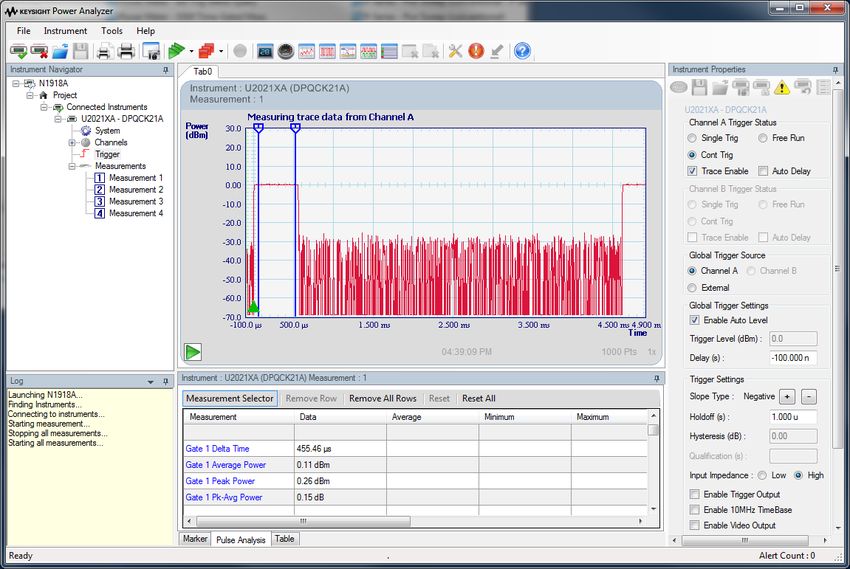
Demonstration 2

Figure 9. Pulse period measurement (delta time, average, peak and peak-to-average power) orange color shown in Pulse Analysis table (on top of pulse
width measurement

Figure 10. Pulse Analysis table consists of 15-point pulse parameter values.

                                                                               10
Demonstration 4
Burst Power Measurement
Objectives 4.613 ms timeframe duration
–– To demonstrate the capability
of U2021XA Series USB
power sensors to measure
burst power (average,
peak and peak-to-average)
signal via external/internal
triggering methodology and
577 μs timeslot duration
automatically calculated by
Power Analyzer application Figure 11. GSM timeslot pattern with timeslot 0 on
software whenever a burst
waveform appears on the
Instructions Keystrokes
graph.
–– To demonstrate the capability On the MXG
of the dual gates function to 1. Set instrument to its default
Press [Preset]
measure the burst signal. settings
–– In this demo, GSM burst 2. Set the frequency and ampli-
signal with 4.613 ms duration tude –– Press [Frequency] [1] {GHz}
(consists of 8 timeslots and Frequency = 1 GHz –– Press [Amplitude] [0] {dBm}
each timeslot with 577 μs Amplitude = 0 dBm
duration) will be generated –– Press [Mode], {Dual ARB},
from the signal generator (See {Select Waveform}, {Waveform
Figure 11). 3. Recall GSM modulation signal Segments}
–– Using external triggering from –– Press [ ] or [ ] to select
Event 1 of signal generator, to {GSM_BURST_WFM}
synchronize with the U2021XA –– Press [Mode], {Dual ARB},
USB power sensors via Trig {Select Waveform}
In port before starting to
–– Press [ ] or [ ] to highlight
capture GSM waveform for 4. Set GSM modulation signal {GSM_BURST_WFM}
measuring the average, peak
–– Press {Select Waveform} and
and peak-to-average power
(see Figure 1). toggle {ARB ON/Off} to “On”
Press [Mode], {Dual ARB} and [More],
5. Set external triggering for GSM
{Marker Utilities}, {Route Connectors},
modulation signal
{Route to Event 1 BNC} and {Marker 2}
6. Turn on the RF Output Toggle [RF On/Off] to “On”
11Instructions Keystrokes
In the Power Analyzer
Double-click on the Power Analyzer
application software shortcut on the
1. Run the Power Analyzer
desktop or access the program via the
Windows Start menu
–– Click {Channel} on the Instrument
Navigator panel
2. Set the frequency to 1 GHz
–– Set Frequency (Hz) to “1G” on the
Instrument Properties panel
–– Click { } on the Power
3. Add trace graph display Analyzer toolbar.
–– Select “Meas ID” and “Current
Active Tab” then click “OK”
–– Press Stop { } on the Power
Analyzer toolbar.
–– Move the cursor to highlight the
normal mode display.
4. Delete the normal mode display
–– Click { } to delete the normal
mode display.
–– Click Run { } continue the
measurement.
–– Click {Channel} on the Instrument
5. Configure trace display to cap- Navigator panel
ture GSM 4.613 ms waveform –– Set Trace Start (s) to “–100μ” and
Trace Length (s) to “5m”
–– Click {Trigger}
6. Configure power sensor to
–– Set “Global Trigger Source” to
external triggering mode
“External”
Measure GSM Timeslot 0 Time-Gated Signal (Average, Peak, and Peak-to-Average
Power)
–– Move the cursor to highlight the
trace graph display
–– Right-click on the trace graph
7. Add dual gates to measure GSM display and select “Apply Gate
timeslot 0 duration (See Figure Option”
12). and “Gate 1”
–– Move the dual gated (vertical line)
to highlight the GSM timeslot 0
duration
Measure GSM Waveform Signal (Average, Peak, and Peak-to-Average Power)
–– Move the cursor to highlight the
trace graph display
–– Right-click on the trace graph
8. Add dual gates to measure GSM
display and select “Apply Gate
whole waveforms (See Figure
Option”
13).
and “Gate 2”
–– Move the dual gated (vertical line)
to highlight the GSM waveform
12Figure 12. Dual gate (Gate 1) press ON GSM timeslot 0, shows delta time, average power, peak power, peak to average power measurement
Figure 13. Dual gate (Gate 2) press ON GSM waveform signal 4.613 ms duration, shows delta time, average power, peak power, and peak to average
power measurement
13Demonstration 5
Time-Gated CCDF and Waveform CCDF Measurements
Complementary Cumulative Distribution Function (CCDF)
Objectives
–– To demonstrate the A CCDF curve is defined by how much time the waveform spends at or above a
capability of U2021XA given power level. This is expressed in dB relative to the average power.
Series USB power sensors to A CCDF curve is a plot of relative power levels versus probability where the
measure and compute time- X-axis represents the dB above the average signal power, while the Y-axis
gated CCDF and waveform represents the percent of time the signal spends at or above the power level
CCDF measuremenet in trace specified by the X-axis.
display view via the N1918A
Power Analysis Manager,
Power Analyzer.
–– To demonstrate the capability
of the dual gates function to
measure and computer the
measurement in time-gated
CCDF (Burst CCDF) and
waveform CCDF.
Figure 14. CCDF plot shows the Y-axis that represents the percentage of time the
signal power equals the power specified by the X-axis
Waveform CCDF
Conventional peak power meter/sensors provide a built-in function of waveform
CCDF measurement in graphical and table format. Waveform CCDF calculates
CCDF and peak-to-average ratio using the entire waveform, including portions
where the data is zero (no signal).
Time-Gated CCDF
Time-gated CCDF or Burst CCDF calculates the entire waveform using only the
actual signal instead of the whole waveform. Gated function of the U2020XA
Series USB power sensor allows the user to allocate the gated (marker 1 and
2) on specific burst on duration where the signal is computed as a time-gated
CCDF measurement.
14Instructions Keystrokes
(Continue on from Demo 4)
In the Power Analyzer
–– Move the cursor to highlight the
trace graph display.
–– Right-click on the trace graph
1. Delete GSM waveform dual gated display and select “Apply Gate
measurement Option” and “Gate 2”
–– Gate 2 measurement will disap-
pear and be removed from the
trace display
–– Click CCDF graph { } on the
Power Analyzer toolbar. Select
“Meas ID” and “Current Active
Tab”
2. Create time-gated CCDF graph
–– Click “OK”
–– In CDDF Type Selector menu, click
“Gated CCDF”
–– Click “OK”
Measure Time-Gated CCDF
–– Move the cursor to highlight the
Gated CCDF graph display.
3. Apply Gate 1 signal into Time-Gat- –– Right-click the graph display,
ed CCDF graph (See Figure 15) select “Couple to Measurement
Gate”
and “Gate 1”.
Measure Waveform CCDF
–– Move the cursor to highlight the
4. Move Gate 1 (marker 1 and 2) to trace display graph.
measure waveform CCDF graph –– Move the “Gate 1” dual gated
(See Figure 16). (vertical line) to highlight the GSM
whole waveform signal.
15Figure 15. Gate 1 (blue lines on the trace display) press ON the GSM timeslot 0 duration, to compute the time-gated CCDF measurement shown in table format
Figure 16. Gate 1 (blue lines on the trace display) press ON the entire waveform of GSM, including the burst off portion, and computes the waveform CCDF
measurement in table format
16Ordering Information
For further information, refer to Keysight U2020 X-series USB Peak
and Average Power Sensors Product Fact Sheet, Literature Number
5991-0308EN.
Related Literature
–– Keysight U2020 X-Series USB Peak and Power Sensors, Data
Sheet, Literature Number 5991-0310EN
–– Keysight N1918A Power Analysis Manager, Technical Overview,
Literature Number 5989-6613EN
–– Keysight N1918 Power Analysis Manager, Installation Guide,
Manual Part Number N1918-90002
1718 | Keysight | U220 X-Series USB Peak and Average Power Sensors - Demo Guide
Evolving Since 1939 For more information on Keysight
Technologies’ products, applications or
Our unique combination of hardware, software, services, and people can help you services, please contact your local Keysight
reach your next breakthrough. We are unlocking the future of technology. office. The complete list is available at:
From Hewlett-Packard to Agilent to Keysight. www.keysight.com/find/contactus
Americas
Canada (877) 894 4414
Brazil 55 11 3351 7010
Mexico 001 800 254 2440
United States (800) 829 4444
Asia Pacific
Australia 1 800 629 485
China 800 810 0189
Hong Kong 800 938 693
India 1 800 11 2626
Japan 0120 (421) 345
myKeysight Korea 080 769 0800
www.keysight.com/find/mykeysight Malaysia 1 800 888 848
A personalized view into the information most relevant to you. Singapore 1 800 375 8100
Taiwan 0800 047 866
http://www.keysight.com/find/emt_product_registration Other AP Countries (65) 6375 8100
Register your products to get up-to-date product information and
find warranty information. Europe & Middle East
Austria 0800 001122
Keysight Services Belgium 0800 58580
www.keysight.com/find/service Finland 0800 523252
Keysight Services can help from acquisition to renewal across your France 0805 980333
instrument’s lifecycle. Our comprehensive service offerings—one- Germany 0800 6270999
stop calibration, repair, asset management, technology refresh, Ireland 1800 832700
Israel 1 809 343051
consulting, training and more—helps you improve product quality
Italy 800 599100
and lower costs. Luxembourg +32 800 58580
Netherlands 0800 0233200
Keysight Assurance Plans Russia 8800 5009286
www.keysight.com/find/AssurancePlans Spain 800 000154
Up to ten years of protection and no budgetary surprises to ensure Sweden 0200 882255
your instruments are operating to specification, so you can rely on Switzerland 0800 805353
accurate measurements. Opt. 1 (DE)
Opt. 2 (FR)
Keysight Channel Partners Opt. 3 (IT)
www.keysight.com/find/channelpartners United Kingdom 0800 0260637
Get the best of both worlds: Keysight’s measurement expertise and
product breadth, combined with channel partner convenience. For other unlisted countries:
www.keysight.com/find/contactus
(BP-9-7-17)
www.keysight.com/find/usbpeaksensor
DEKRA Certified
ISO9001 Quality Management System
www.keysight.com/go/quality
Keysight Technologies, Inc.
DEKRA Certified ISO 9001:2015
Quality Management System
This information is subject to change without notice.
© Keysight Technologies, 2017
Published in USA, December 1, 2017
5991-1221EN
www.keysight.comYou can also read