Lab Home Testing of Residential Isolation Space Control to Minimize Infectious Disease Transmission in Existing Single-Family Homes - May 2021
←
→
Page content transcription
If your browser does not render page correctly, please read the page content below
Lab Home Testing of Residential
Isolation Space Control to Minimize
Infectious Disease Transmission in
Existing Single-Family Homes
May 2021
Disclaimer
This work was prepared as an account of work sponsored by an agency of the United States
Government. Neither the United States Government nor any agency thereof, nor any of their
employees, nor any of their contractors, subcontractors or their employees, makes any warranty,
express or implied, or assumes any legal liability or responsibility for the accuracy,
completeness, or any third party’s use or the results of such use of any information, apparatus,
product, or process disclosed, or represents that its use would not infringe privately owned rights.
Reference herein to any specific commercial product, process, or service by trade name,
trademark, manufacturer, or otherwise, does not necessarily constitute or imply its endorsement,
recommendation, or favoring by the United States Government or any agency thereof or its
contractors or subcontractors. The views and opinions of authors expressed herein do not
necessarily state or reflect those of the United States Government or any agency thereof, its
contractors or subcontractors.

Available electronically at Office of Scientific and Technical Information website (osti.gov)
Available for a processing fee to U.S. Department of Energy
and its contractors, in paper, from:
U.S. Department of Energy
Office of Scientific and Technical Information
P.O. Box 62
Oak Ridge, TN 37831-0062
OSTI osti.gov
Phone: 865.576.8401
Fax: 865.576.5728
Email: reports@osti.gov
Available for sale to the public, in paper, from:
U.S. Department of Commerce
National Technical Information Service
5301 Shawnee Road
Alexandria, VA 22312
NTIS ntis.gov
Phone: 800.553.6847 or 703.605.6000
Fax: 703.605.6900
Email: orders@ntis.gov

                                                       ii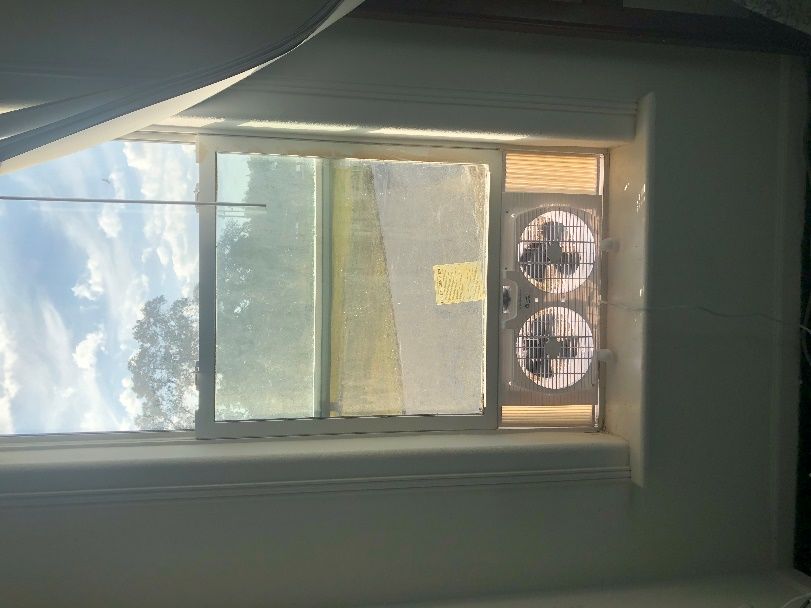
Lab Home Testing of Residential Isolation Space Control to Minimize
  Infectious Disease Transmission in Existing Single-Family Homes

                                   Prepared by:
          Tanvir Khan, Charles Withers, Nicholas Bonilla, and Eric Martin
                          FSEC Energy Research Center

                                  Prepared for:
                           Building Technologies Office
                Office of Energy Efficiency and Renewable Energy
                            U.S. Department of Energy

                                    May 2021

                    NREL Technical Monitor: Conor Dennehy

                                        iii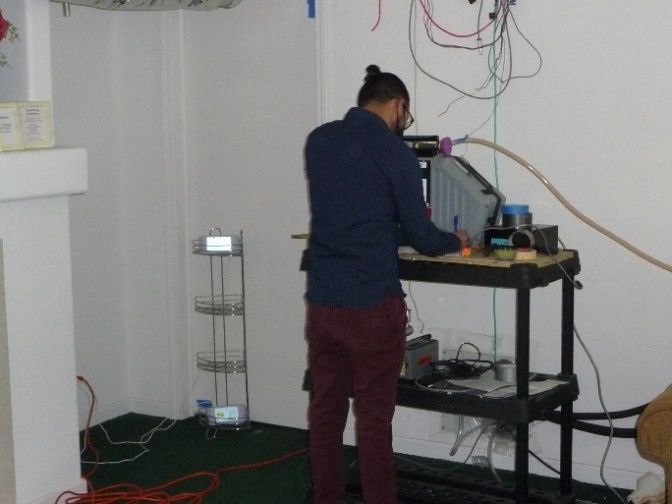
Acknowledgments
This report was funded by the Residential Buildings Integration program within the U.S.
Department of Energy, Office of Energy Efficiency and Renewable Energy, Building
Technologies Office

Table of Contents
Executive Summary ........................................................................................................................ v
1      Introduction ............................................................................................................................. 1
2      Background ............................................................................................................................. 3
3      Methods................................................................................................................................... 4
    3.1      Site Description ................................................................................................................ 4
    3.2      Airtightness ...................................................................................................................... 4
    3.3      Airflow Measurements ..................................................................................................... 5
    3.4      Pressure Differential, Temperature, and Wind Monitoring ............................................. 5
    3.5      Isolation Zone Containment Testing Using PM2.5 ........................................................... 6
    3.6      Isolation Zone Containment Testing Using Tracer Gas ................................................... 7
    3.7      Test Cases and Configurations ......................................................................................... 7
4      Results ................................................................................................................................... 10
    4.1      Airflow Characteristics and Building Airtightness ........................................................ 10
    4.2      Environmental Data........................................................................................................ 11
    4.3      Best and Worst Containment Test Cases ....................................................................... 13
       4.3.1        Examples of Four Best Containment Strategies ..................................................... 15
       4.3.2        Examples of Three Weak Containment Strategies ................................................. 18
    4.4      Special Cases .................................................................................................................. 21
       4.4.1        Effect of Opening/Closing Isolation Zone Door ..................................................... 21
       4.4.2        Effect of Using Kitchen Range Hood in the Main Zone ........................................ 22
5      Recommendations for Strong Isolation Zone Containment.................................................. 24
References ..................................................................................................................................... 25
Appendix A. Project Photos.......................................................................................................... 27

                                                                        iv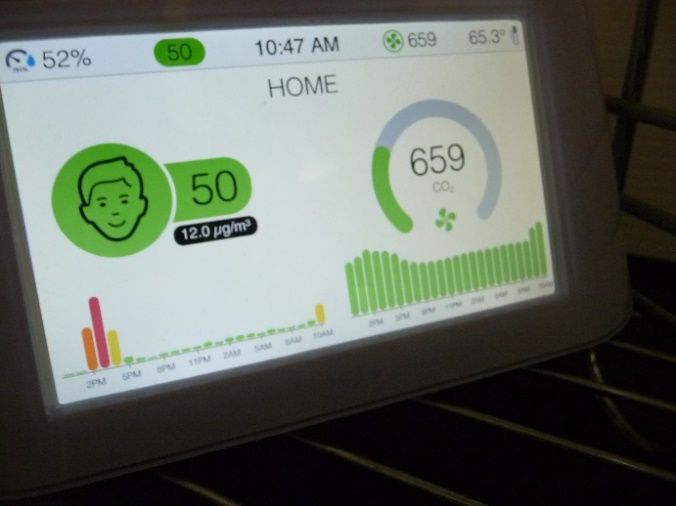
Lab Home Testing of Residential Isolation Space Control to Minimize Infectious Disease Transmission in
Existing Single-Family Homes

Executive Summary
Existing evidence strongly suggests that viral infectious diseases can be transmitted via an
airborne route across distances in indoor environments. Accordingly, the risk of airborne
transmission within homes should be managed. The public health emergency associated with
SARS-CoV-2 makes controlling airborne transmission of respired viruses in indoor
environments critical, especially in poorly ventilated indoor environments. The effectiveness of
engineering interventions requiring minor efforts that create a negative-pressure isolation zone
(IZ) for a contagious person has yet to be tested for existing residential homes. To mitigate the
risk of airborne virus transmission and maximize health protection for the population in existing
single-family homes, this report investigates the relative effectiveness of several control
strategies. Although very high-efficiency MERV filtration, high ventilation rates, and other
controls can help be effective, most occupants are not likely to have the time or means for
advanced measures found in hospitals. This project focuses on relatively simple efforts that
utilize existing or easy to acquire materials and straightforward processes.
The risk of transmission of a contagious airborne virus can be reduced by isolating a sick person
in a depressurized IZ of a single-family home. Within this report, the remaining occupied part of
the house outside the IZ is referred to as the main zone (MZ). Further protection can come from
bringing outside air into the MZ using an existing mechanical ventilation system or even a low-
cost window fan. This increases ventilation and dilution of pollutants and helps maintain positive
pressure with reference to the IZ.
In our test facility, which is a single-family manufactured home, various controls were
implemented under various operating conditions. A total of 17 cases were tested, with test
conditions summarized in Table ES-1. These strategies were designed based on various heating,
ventilating, and air-conditioning (HVAC) operating scenarios, intervention measures, and
utilization of exhaust or window fans for pressure control. Interventions involved efforts like
closing the IZ door and/or sealing IZ supply air grilles. The primary metric used in this project to
evaluate potential containment effectiveness is the “IZ with reference to (w.r.t.) MZ” pressure
difference. ASHRAE 170 standard requires a hospital isolation room pressure differential of at
least -2.5 Pa w.r.t. adjacent zones. This pressure differential requirement was the primary basis
of comparison. The use of generated particulate matter was a supplementary means of observing
containment.
To test the potential effectiveness of IZ containment, fine particulate matter (PM2.5) was
generated from an essential-oil-based diffuser, and tracer gas was injected in the IZ followed by
real-time monitoring of the particulate matter and tracer gas transfer from IZ to MZ. Combining
the data from pressure differential monitoring and observed concentrations of PM2.5 and tracer
gas across the zones, the potential effectiveness and weakness of several cases were
demonstrated.

                                                      v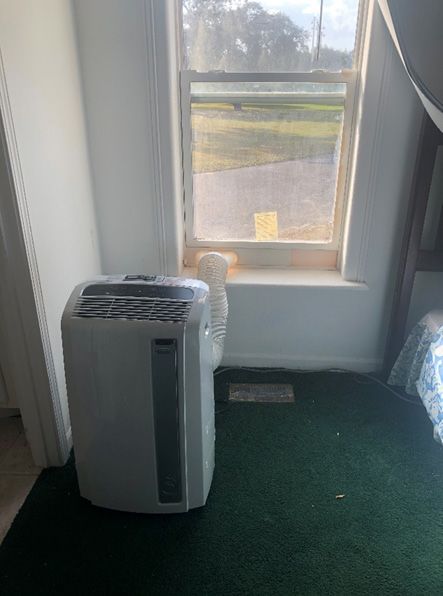
Lab Home Testing of Residential Isolation Space Control to Minimize Infectious Disease Transmission in
Existing Single-Family Homes
Table ES-1. Test Case Configurations (Highlighted Rows Achieved Best IZ Containment)
IZ Bath MZ Central
Case IZ Door Window IZ Window(s) IZ Supply
Exhaust Window(s) Heating/
# State Fan State Grilles
Fan State Coolingᶳ
1 Open Off No Closed Closed On Open
2 Open On No Closed Closed On Open
3 Closed Off No Closed Closed On Closed
In IZ as
4 Closed Off Closed Closed On Closed
exhaust
5 Closed On No Closed Closed On Closed
In MZ as
6 Closed On Closed Closed On Closed
supply
In MZ as
7 Closed Off Closed Closed On Closed
supply
8 Closed On No Open (1) Closed Off Closed
9 Closed On (low) No Closed Closed On Closed
Monitoring IZ containment during IZ to MZ door opening/closing
10
under conditions for Case 5
11 Closed On No Closed Closed On Open
In IZ as
12 Closed Off Closed Closed On Open
exhaust
13 Closed Off No Closed Open (2) Off Closed
Open
14 Closed On No Closed Closed On
(partial)
15 Closed Off No Open (2) Closed Off Closed
16* Closed Off Off Closed Closed Off Closed
17** Closed Off Off Closed Closed On Closed
Note: All tests with IZ bath exhaust fan “On” were conducted at a high fan speed setting unless otherwise specified. The number in
parentheses for window state denotes the number of windows open during the test in the IZ and/or MZ.
ᶳHVAC fan ON Continuous
*Use of kitchen range hood in the MZ simulated using a duct blaster (flow: 100 CFM, duration: 30 minutes).
**A portable room air conditioner with exhaust to outside installed in one of the IZ windows.
Containment requires eliminating as many air pathways between the IZ and MZ as is practical.
This involves keeping doors between IZ and MZ closed and blocking IZ supply air grilles.
Making the IZ more airtight provides the benefit of requiring less mechanically induced air to
maintain negative IZ pressure. Four cases highlighted in Table ES-1 were identified as having
the potential for strong containment. These cases exhibited adequate depressurization in the IZ
(-2.7 to -7.0 Pa w.r.t. MZ), meeting and/or exceeding the threshold of -2.5 Pa. For Cases 4 and 5,
depressurization was achieved using a low-cost portable exhaust window fan (minimum airflow
of 300 cubic feet per minute [CFM]) and an IZ bathroom exhaust fan (which required in-situ
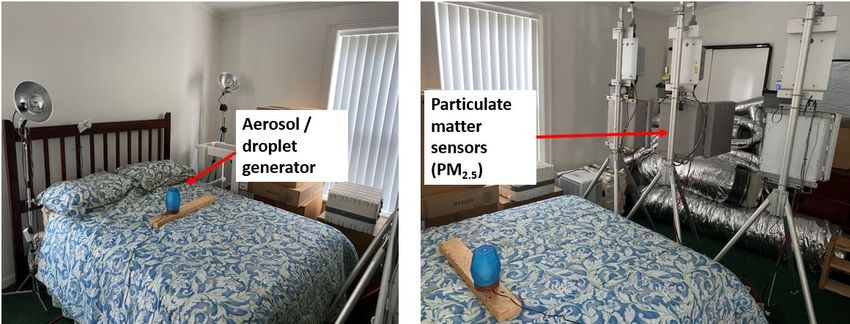
minimum airflow of 100 CFM). For Case 6, the window fan is used as a supply fan to create
pressurization in the MZ by bringing outside air into MZ, resulting in net negative pressurization
vi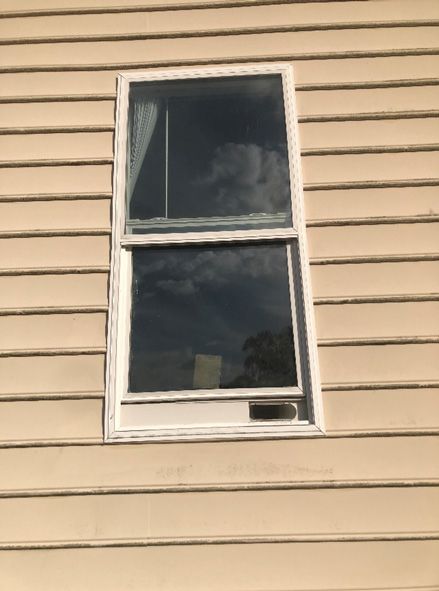
Lab Home Testing of Residential Isolation Space Control to Minimize Infectious Disease Transmission in
Existing Single-Family Homes

in the IZ w.r.t MZ. For these effective cases, the MZ to IZ door and all IZ windows remained
closed at all times while all IZ supply grilles were sealed off. One major drawback to blocking
the IZ supply grilles is that the IZ thermal conditions are likely to become more uncomfortable
for the ill isolated person. Therefore, a room space heater or room air conditioner may be needed
in the IZ. One experiment, Case 17 in Table ES-1, demonstrated that a portable room air
conditioner with process air exhausted to the outdoors could help maintain comfort and also be
used to maintain depressurization as long as it was in operation.
Although maintaining the IZ door closed was critical, occasional opening/closing the door for
practical purposes such as tending to the sick person did not compromise the containment
potential of the IZ, as demonstrated by PM2.5 tests.
Our results indicate that creating an IZ in an existing single-family house need not be
complicated. A low-cost $32 window fan and simple occupant efforts can be used for potentially
effective pressure containment. There may, however, be the need for supplemental IZ space
conditioning, which could cost $75 for electric space heating and about $300–$600 for a room
air conditioner. Also, although it is expected that containment is only needed for a short-term
period of less than a month, situations requiring longer-term containment should ensure that
potential for moisture-related durability concerns is minimized. Such concerns arise when
outdoor dew points are high (exceeding 72°F), and due to the long-term infiltration of the humid
air that results from space depressurization. In such cases, space-cooling set points should not be
set below the outdoor air dew point. This is especially important in homes with vapor-
impermeable wall and/or floor coverings, such as vinyl wallpaper.

                                                     vii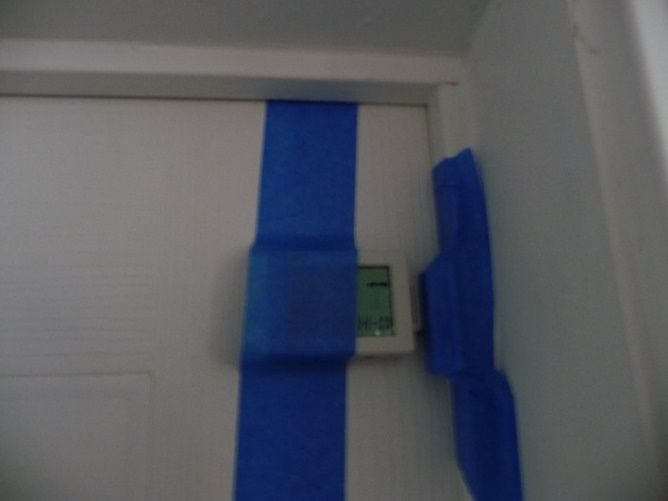
Lab Home Testing of Residential Isolation Space Control to Minimize Infectious Disease Transmission in
Existing Single-Family Homes

1 Introduction
Of the three respiratory virus transmission pathways (i.e., through direct close contact, contact
between people and with contaminated surfaces known as fomite, and airborne inhalation)
(Morawska et al. 2020), aerosol-based transmission is of particular importance in the context of
influenza viruses, the common-cold rhinoviruses, and the novel SARS-CoV-2, especially in the
indoor environment (Allen and Marr 2020; Garcia de Abajo et al. 2020; Miller et al. 2020;
Morawska and Chao 2020; Morawska et al. 2020). The term “airborne” refers to any
transmission that occurs outside of close contacts. During breathing, speaking, sneezing, and
coughing, infected individuals exhale both virus-laden droplets (> 5 to 10 µm) and aerosols (< 5
µm) (Prather et al. 2020a; Allen and Marr 2020). Viruses in aerosols can remain airborne for
hours, and be inhaled deep into the lungs (Prather et al. 2020b; Asadi et al. 2020). In limited
sampling in health care settings, the available data suggest the majority of SARS-CoV-2 tend to
be associated with aerosols in the size range of 1 to 4 µm (Chia et al. 2020; Liu et al. 2020).
Aerosols containing infectious viruses can travel more than 2 m and accumulate in poorly
ventilated indoor air (Miller et al. 2020; Lednicky et al. 2020).
Existing case studies and evidence strongly suggest that viral infectious diseases can be
transmitted via aerosols across distances in indoor environments (WHO 2009). For SARS-CoV-
2, sharing indoor space in the presence of infected individuals has been confirmed as a risk factor
in the transmission of COVID-19 (Allen and Marr 2020; Miller et al. 2020). ASHRAE
acknowledged the airborne route for transmission from person to person indoors and
recommended ventilation control measures accordingly (ASHRAE 2020), stating that
“transmission of SARS-CoV-2 through the air is sufficiently likely that airborne exposure to the
virus should be controlled. Changes to building operations, including the operation of heating,
ventilating, and air-conditioning systems, can reduce airborne exposures.” To mitigate the risk
for the population in indoor environments, appropriate control strategies can be utilized. A
majority of these control strategies are engineering-level controls, including mechanical
ventilation, air cleaning and disinfection, and ultraviolet germicidal irradiation disinfection
applied to public or commercial buildings.
In the United States, most health-care facilities use negative-pressure airborne infection isolation
rooms (AIIRs) for patients with airborne transmissible infections (Miller et al. 2017). To ensure
virus containment, the pressure in AIIRs with reference to an external zone such as a hospital
corridor is recommended to be -2.5 Pa (ASHRAE Standard 170 2013). To reduce the health risks
for airborne transmission in residential buildings, including single-family homes and apartments,
practical measures such as segregating infected individuals, opening windows and doors, and
using portable air-cleaning devices are commonplace (Morawska et al. 2020). However, the
concept of utilizing negative-pressure or depressurization while creating an isolation zone (IZ) or
room in an existing single-family home as a practical approach to protect the rest of the people in
the home has not been systematically studied and reported, to our knowledge. Using existing
spot ventilation such as a bathroom exhaust fan and/or commercially available low-cost window

                                                      1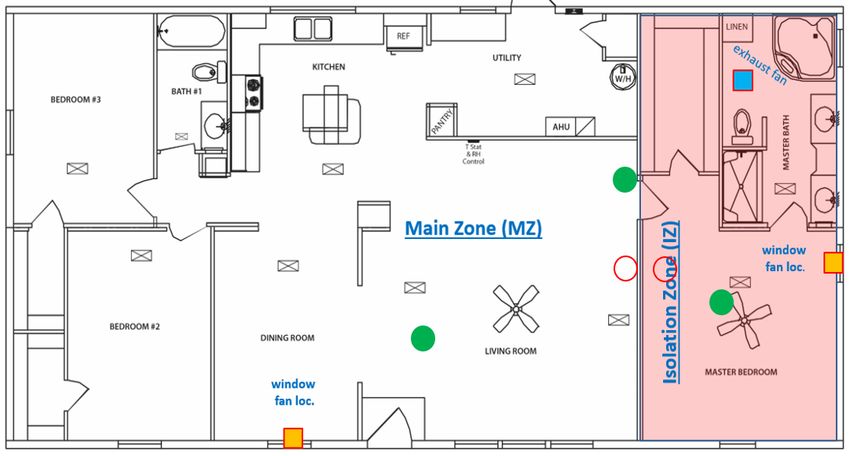
Lab Home Testing of Residential Isolation Space Control to Minimize Infectious Disease Transmission in
Existing Single-Family Homes

fans could be used to create a pressure differential across rooms. Such measures may
substantially reduce virus concentrations in the indoor air relative to the base case of no
intervention, resulting in lower risk of airborne transmission at a relatively low cost and without
any major modifications to the existing heating, ventilating, and air-conditioning (HVAC)
system.
ASHRAE Standard 170 addresses commercial health-care facilities and contains well-
established principles of isolation disease control. This standard was used as guidance in
developing practical and attainable recommendations for residential single-family homes. Given
limitations of specific homes and occupants, it is recognized that a residential IZ may not offer
the same confidence in protection as Standard 170, but should considerably reduce exposure to
healthy occupants.
The issue: A situation can occur when someone in the home has a confirmed or suspected
infection or is required to be quarantined. If they are distributing viruses in the air, how can the
rest of the occupants in the home avoid becoming sick?

The overarching objective of the study: to systematically test the effectiveness of various
strategies to mitigate potential airborne transmission of infectious aerosols in a manufactured
single-family laboratory house under various HVAC operating scenarios, intervention measures,
and utilization of exhaust or window fans for pressure control.

                                                      2
Lab Home Testing of Residential Isolation Space Control to Minimize Infectious Disease Transmission in
Existing Single-Family Homes

2 Background
In many single-family detached homes built in the last 40 years (and some built prior), there is a
master bedroom with an attached bathroom that has an exhaust fan ducted to the outside.
Typically, this bathroom has a sole entry point from the master bedroom. Closing the door to the
master bedroom from the main body of the house and running the exhaust fan has the potential to
maintain the master suite zone at a negative pressure with reference to (w.r.t.) adjacent rooms
when central heating or cooling is not on. Further effort to block gaps around the closed door
between the isolation room and the main body of the building would improve control of negative
pressure in the isolation room relative to adjacent spaces. If the building is reasonably airtight
and the exhaust fan has enough airflow, zone isolation from the master suite exhaust fan with a
couple of additional room modifications may provide adequate air control. Some homes have
central return air ducts, ducted returns, or passive return air transfers in bedrooms. Ducted and
passive return air pathways in the isolation room must be sealed off to block air transfer from the
isolation room into the rest of the home during heating, cooling, or central air circulation
operation. Supply from the central system into the isolation space may exceed the exhaust
airflow, resulting in periods of pressurization instead of desired depressurization. It is imperative
that the central system supply grille airflow into the isolation space be reduced such that
adequate depressurization w.r.t. the main body occurs. This is best accomplished by the
application of tape and paper or plastic over as much of the grille as necessary. A portable room
air conditioner, space heater, or floor fan may be needed to improve comfort in the isolation
space.
The main body of the home will operate at slightly negative pressure w.r.t. outside if the
isolation room return pathway is sealed and supply air vents are left unsealed. Positively
pressurizing the main body w.r.t. outside offers further protection, and may be accomplished by
increasing supply ventilation of the main body of the house. This can be as simple as using a
portable fan if the home does not have an existing operable supply mechanical ventilation
system. Ventilation can be increased by using a portable floor or through-window/wall fan
placed into an open window or door, positioned to supply outdoor air into the home. This should
also increase the pressure difference between the main body of the home and the isolated room.
Closing doors and dedicated returns from the master suite will not necessarily close off all
potential paths of unintentional airflow from a master bedroom to the main space. However, by
creating a pressure differential via the exhaust fan or fan in the window, any such pathways
should result in air moving from the main zone (MZ) to the master suite instead of the reverse.
The potentially contaminated air should remain isolated within the master suite and be exhausted
or exfiltrated to the outside. Uninfected persons at greater health risk will benefit from increased
outdoor ventilation to the main body of the home, or even a specific bedroom, as ventilation
dilutes pollutants and helps isolate them in a positive pressure space relative to other spaces.

                                                      3
Lab Home Testing of Residential Isolation Space Control to Minimize Infectious Disease Transmission in
Existing Single-Family Homes
3 Methods
3.1 Site Description
To help determine the effectiveness of containment of airborne contaminants within a home,
FSEC’s Manufacturing Housing Laboratory (MHLab) was used. Located in Cocoa, Florida, the
MHLab is a 1,620-ft2 manufactured home with three bedrooms and two bathrooms. It has an
unvented and unconditioned crawl space, R19 floor insulation, vented attic with R30 insulation
on the ceiling, wood frame wall construction with R19 insulation, double-pane low-e windows.
The MHLab has a house airtightness of about 5 air changes per hour with the house at 0.20 in
WC (50 Pa of pressure) w.r.t. outdoors (5 ACH50). The effectiveness of control strategies will
depend upon house and zone tightness. Older leakier homes would require more ventilation
airflow for containment. The floorplan of MHLab is shown in Figure 1. For each test, the master
suite served as the IZ.
Figure 1. FSEC Manufactured Housing Laboratory floorplan. Green dots denote the locations of PM2.5
monitors, and red circles denote the locations of tracer gas (SF6) measurements.
Appendix A includes photos of the experimental setup and equipment.
3.2 Airtightness
To determine the airtightness of the whole house, the IZ, and the remaining pressurization zone,
the research team conducted multipoint tightness tests. The test data were used to construct a
best-fit equation. This equation could be used to predict a pressure differential at different zone
fan flow rates; however, it is more accurate predicting at pressures above 15 Pa because wind
just under 10 mph can cause variations of a few pascals, and pressure test data typically starts at
15 Pa or higher. The depressurization method of Standard ASTM E779 was used to determine
4Lab Home Testing of Residential Isolation Space Control to Minimize Infectious Disease Transmission in
Existing Single-Family Homes
airtightness. The calibrated fans used were an Energy Conservatory Blower Door with a digital
manometer and a DuctBlaster fan with a digital manometer. The blower door was used for the
MZ tightness, and the DuctBlaster was used on the smaller IZ. The Blower Door can measure
from 85 CFM to about 5,000 CFM at 50 Pa pressure with an accuracy of ±3%. The DuctBlaster
can measure from 10 CFM to about 1,400 CFM at 50 Pa pressure with an accuracy of ±3%.
Both guarded and unguarded tests were conducted to determine leakage between zones and
leakage to outdoors. Results from these tests were used to estimate net (mechanical air entering
zone – air exhausted) fan flow required to maintain critical pressure differentials.
3.3 Airflow Measurements
Airflow rates of mechanically conveyed air into and out of the test house were measured.
Airflows of bathroom exhaust were measured using a passive flow capture hood method. The
window fan, supply grille flows, and portable room air-conditioning exhaust flow were measured
using a powered flow capture hood method. The Energy Conservatory Exhaust Fan Flow Meter
is a passive flow hood design that consists of a plastic manufactured box with an adjustable flow
orifice and a DG-700 digital manometer. After placing the flow box over the exhaust fan intake,
the pressure in the box and the known orifice size are used with the manufacturer’s calibration to
calculate airflow. This method is suitable for bathroom exhaust flows under about 124 CFM.
The accuracy of this device is ±10% of reading when the box pressure limit stays within -8.0 Pa
to -1.0 Pa.
The powered capture hood method uses a hood that will fit over an intake or discharge of the
device being measured. Because a passive hood may restrict the airflow of units with higher
airflows, a calibrated fan with adjustable speed is connected to the hood. The pressure is
measured in the capture hood, a calibrated fan is adjusted until the hood pressure is neutral, and
then the airflow is measured. The Energy Conservatory DuctBlaster, a digital manometer, and a
box were used as the powered flow hood device. This device can measure airflows from 10 CFM
to 1,500 CFM and has an accuracy of ±3%.
3.4 Pressure Differential, Temperature, and Wind Monitoring
A Campbell Scientific data logger and data collection system was used to monitor zone air
pressure differences, indoor and outdoor temperatures, wind speed, and wind direction. Data
were sampled at 10-second intervals and averaged at 15-minute intervals. A central data
collection system downloaded and screened data for errors and then stored it on a secured
database.
Pressure differentials were measured to determine the expected direction of airflow and were
used as the key indicator for isolation containment. Air flows through pathways from a zone of
higher pressure to one of lower pressure. The pressure differential of the IZ with reference to the
house main body, and the main body with reference to outdoors was measured under several
5Lab Home Testing of Residential Isolation Space Control to Minimize Infectious Disease Transmission in
Existing Single-Family Homes
different house operational scenarios. Pressure measurements indicated pressure impacts from
events such as:
• IZ door closure
• IZ supplies open and closed
• IZ bathroom exhaust fan operation
• Central heat and air on and off
• Operation of kitchen, central zone bathroom, or other exhaust, such as clothes dryer
• Window fan operation
• Open windows.
Differential pressures were measured using Energy Conservatory digital manometers with an
analog output that enabled data logging. The manometers had a range of -200 Pa to +200 Pa and
accuracy of ±1% or ±0.2 Pa, whichever is greater. The accuracy of ±0.2 Pa applies to the range
of pressure measurements reported herein. The outdoor pressure reference tubing was run to an
open lawn area about 50 feet to the south of the house lab, with a static pressure probe installed
at the end. Indoor pressure tubes were located away from direct velocity of fans or supply air
discharge.
Temperatures were measured with Vaisala HMP 50 Temperature and Humidity sensors.
Temperature accuracy was ±0.5°F. Wind speed and direction were measured on-site using Met
One instruments. The wind speed had a starting threshold of 1 mph and accuracy of ±1.5%, or
0.25 mph. Wind direction was measured as degrees from north (0°, 360°) and had an accuracy of
±5°.
3.5 Isolation Zone Containment Testing Using PM2.5
Although sizes of most respiratory viruses (e.g., rhinovirus, adenovirus, and SARS-CoV-2) are
very small (i.e., 0.3–0.12 µm) (Fehr and Perlman 2015), existing evidence suggests that airborne
particles could play an important role in the transmission of respiratory viruses such as SARS-
CoV-2 (Qu et al. 2020; Riccò et al. 2020). This means that fine particulate matter could act as a
carrier for SARS-CoV-2 (Tung et al. 2021). The virus-laden particles may remain suspended in
the air for prolonged periods, especially particles having a smaller diameter (Tellier 2006) with a
low removal rate from air to surface, while the larger particles are subject to fast settling on
surfaces (Khan and Perlinger 2017). Several recent studies reported that indoor particulate matter
generated from tobacco smoking, incense burning, laser printing, and similar actions could
facilitate the transmission of SARS-CoV-2 in indoor environments (Amoatey et al. 2020;
Mahabee-Gittens et al. 2020; He and Han 2020).
In this project, PM2.5 was used as a marker for virus transmission and for evaluating the
effectiveness of containment strategies. PM2.5 was generated using essential oil with deionized
(DI) water in a diffuser located within the IZ, and resulting concentrations were monitored in the
IZ and MZ. No other activities such as cooking, smoking, vacuuming, or similar were performed
6Lab Home Testing of Residential Isolation Space Control to Minimize Infectious Disease Transmission in
Existing Single-Family Homes
in the laboratory home during the experiments. As a result, the background PM2.5 concentrations
in both IZ and MZ remained very low (mean 1–3 µg m-3). To enable meaningful evaluation of
containment strategies before and after an intervention, the target quasi-steady-state PM2.5
concentrations in the IZ were set at least a factor of 50 higher than the mean background
concentration. PM2.5 was also measured outdoors because unusually high ambient PM2.5
concentrations (such as those normally found during forest fires, prescribed biomass burning,
etc.) could potentially impact background PM2.5 concentrations. Generally, the mean ambient
PM2.5 concentration at the experimental site location was 5–7 µg m-3, well below the U.S.
Environmental Protection Agency’s 24-hour standard of 35 µg m-3.
PM2.5 concentrations in multiple zones in the house were measured using co-located research-
grade (MetOne BT-645 Portable Dust Monitor) and commercially available low-cost (IQAir
AirVisual Pro) instruments. These monitors record concentration data at a temporal resolution of
10 to 60 seconds. An airflow rate of 2 L min-1 was used in the MetOne indoor monitor.
Background PM2.5 measurements were conducted before generating aerosols in the IZ. The
measured background concentrations were used as the baseline “zero” reading.
3.6 Isolation Zone Containment Testing Using Tracer Gas
In addition to PM2.5, a tracer gas (sulfur hexafluoride, SF6) was used to determine IZ
containment potential effectiveness under different residential building operational scenarios.
The tracer gas was applied within the IZ. After tracer gas was injected into the IZ and allowed
time to diffuse, several measurements of concentration in parts per billion (ppb) were taken at 5-
to 10-minute intervals over continuous periods within the IZ and also in the main house zone
using a ThermoFisher Scientific Miran Analyzer 205B-XLA4N. This unit measured SF6 to a
resolution of 10 ppb with accuracy of ±10% from 0 to 1,000 ppb, and ±20% from 1,000 to
4,000 ppb. Testing was conducted with gas concentrations typically in the range from 80 ppb up
to 8,000 ppb. Some tests with very high IZ ventilation rates started with higher concentrations
that would drop in half within 20 minutes. The zero drift of the gas analyzer was checked with a
zero gas filter and measured outdoors during testing. The concentration in the MZ was compared
to the IZ during each test case scenario.
3.7 Test Cases and Configurations
A total of 17 test cases were conducted in the manufactured housing laboratory (Figure 1). Most
test cases were repeated three times and some twice. This study focused on the investigation of
effectiveness of controls for common configurations, not a systematic study of all variables. The
cases were selected based on some likely combinations of HVAC settings in occupied homes, as
well as potential control measures that could be implemented by most occupants.
Tests focused on evaluating various means of practical effort. This covered actions including no
effort made by occupants (baseline), basic efforts using existing available means already in the
home, and efforts likely requiring the purchase of other fans or personal comfort equipment that
can be obtained within several days. The use of bath exhaust and window fans, open windows,
7Lab Home Testing of Residential Isolation Space Control to Minimize Infectious Disease Transmission in
Existing Single-Family Homes
IZ door closure, and blocking central air from IZ are examples of types of measures tested. All
test cases did not involve any other door closures in the home other than the IZ door. Only the IZ
door was manipulated. The two other bedrooms and one hall bathroom door remained open and
were considered part of the MZ. It is important to note, however, that closing bedroom doors are
already known to result in MZ depressurization w.r.t. outdoors and other closed-door rooms.
This can occur in homes with central ducted heat and air having only a single return from the MZ
(Cummings et al. 1990; Swami et al. 2006). This impact would undermine IZ containment but is
less likely if the rooms part of MZ have adequate return air.
All the cases with their test configuration details are listed in Table 1.
Table 2. Test Case Configurations
IZ Bath MZ Central
Case IZ Door Window IZ Window(s) IZ Supply
Exhaust Window(s) Heating/
# State Fan State Grilles
Fan State Coolingᶳ
1 Open Off No Closed Closed On Open
2 Open On No Closed Closed On Open
3 Closed Off No Closed Closed On Closed
In IZ as
4 Closed Off Closed Closed On Closed
exhaust
5 Closed On No Closed Closed On Closed
In MZ as
6 Closed On Closed Closed On Closed
supply
In MZ as
7 Closed Off Closed Closed On Closed
supply
8 Closed On No Open (1) Closed Off Closed
9 Closed On (low) No Closed Closed On Closed
Monitoring IZ containment during IZ to MZ door opening/closing
10
under conditions for Case 5
11 Closed On No Closed Closed On Open
In IZ as
12 Closed Off Closed Closed On Open
exhaust
13 Closed Off No Closed Open (2) Off Closed
Open
14 Closed On No Closed Closed On
(partial)
15 Closed Off No Open (2) Closed Off Closed
16* Closed Off Off Closed Closed Off Closed
17** Closed Off Off Closed Closed On Closed
Note: All tests including IZ bath exhaust fan “On” were conducted at a high fan speed setting unless otherwise specified. The number in
parentheses for window state denotes the number of windows open during the test in the IZ and/or MZ.
ᶳHVAC fan ON Continuous
*Use of kitchen range hood in the MZ simulated using a duct blaster (flow: 100 CFM, duration: 30 minutes).
**A portable room air conditioner with exhaust to outside installed in one of the IZ windows.
8Lab Home Testing of Residential Isolation Space Control to Minimize Infectious Disease Transmission in
Existing Single-Family Homes
Following are general explanations for some of the types of test cases:
• Case 1 demonstrates a baseline case where no effort is made.
• Case 2 is a baseline with the simple effort of using an existing fan, but not closing the IZ
door.
• Cases 3–17 address closing the IZ door with other variations.
• Cases 1, 2, 11, and 14 involve IZ central air on and IZ supply grilles not sealed off.
• Cases 8, 13, and 15 involve open window configurations with other variations.
• The impact from different IZ bath exhaust cases is covered in Cases 2, 5, 6, 8, 9, 11, and 14.
• The impact of a low-cost window fan installed in an IZ or MZ is covered in Cases 4, 6, 7,
and 12.
• The impact of MZ exhaust such as a range hood or other exhaust fan is covered by Case 16.
This is similar to Case 3, except the exhaust event and central air is turned off.
• Because an effective case requiring the IZ door kept closed would occasionally require door
opening for practical purposes such as tending the isolated person, Case 10 is an evaluation
of a reasonably effective case (Case 5) that had variations in door opening events (i.e., the
door was open and closed for various durations during the test).
9Lab Home Testing of Residential Isolation Space Control to Minimize Infectious Disease Transmission in
Existing Single-Family Homes
4 Results
This section is divided into subsections summarizing the following results: airflow
characteristics and building airtightness (Section 4.1), environmental data/test parameters
(Section 4.2), best and worst containment test cases (Section 4.3), and special test cases (Section
4.4).
4.1 Airflow Characteristics and Building Airtightness
To create depressurization in the IZ, we used a bathroom exhaust fan (within the IZ) and a
portable low-cost window fan. The bathroom exhaust fan was capable of operating at three
different speeds. This fan was only tested at the high and low setting, because high speed could
produce reasonable pressure control, and low speed was more similar to existing bath fans in
most homes. The window fan had two settings, but there was only a 25-CFM difference between
them, so the fan was operated at high speed when used. The portable room air conditioner, with
an air exhaust duct kit, had a rated cooling output of 6,700 Btu/h (DOE test method) and 11,500
Btu/h (ASHRAE test method). Table 2 summarizes the airflow measurements of different
equipment.
Table 3. Airflow Characteristics
Instrument Specification Operating Modes Measured Flow (CFM)
Panasonic High 110
Bath Exhaust Fan FV-0511VK2
WhisperGreen Select Low 48
CCC Comfort Zone 9” High 328
Window Fan
window twin fan Low 303
Open (full) 172
IZ Door Closed
Supply Grilles Open (partial) 10
IZ Door Open Open (full) 192
DeLonghi 6700 Btu/h
Portable AC Unit Single speed 227
output
Building airtightness and zone airtightness was measured to document the tested leakage and
verify that there were no unplanned air pathways between the IZ and MZ. The guarded tests
measure the leakage of each zone to outdoors and do not include leakage between these two
zones. The whole house tightness test represents the entire home as one zone. The test leakage is
reported as the airflow rate in CFM that occurs when the tested zone with reference to outdoors
is at 50 Pa pressure difference (CFM50). The CFM50 result was normalized for zone volume and
converted to air changes per hour at 50 (ACH50). ACH50 allows a better comparison of
airtightness between different houses or zones. The air leakage results are shown in Table 3.
10Lab Home Testing of Residential Isolation Space Control to Minimize Infectious Disease Transmission in
Existing Single-Family Homes
CFM50 is directly proportional to the cumulative air leak size, so larger floor areas generally
have more leakage area and therefore higher CFM50 values. This can be observed comparing the
whole house test to the IZ leakage and the outdoors test. When the normalized air leakage
ACH50 is compared, however, the IZ appears to be relatively leakier than the whole house, and
the MZ has a similar ACH50 to the whole house. Overall, the relative tightness of the house and
each zone can be considered representative of many existing single-family homes in the United
States.
The leakage of the partition wall between the IZ and MZ was determined using the difference
between the total IZ tightness (leakage from outdoors and adjacent indoor zones) and guarded IZ
test tightness (leakage only directly from outdoors). The partition wall, including the IZ door
undercut pathway, represented about 45% of the total tightness. The door undercut represented
22% of the total IZ tightness.
Table 4. Summary of Airtightness Test Results
Floor Area Flow Leak Flow Leak
Test Description CFM50 ACH50
(ft2) C n
Whole house 1,316 5.2 1,620 100.8 0.657
IZ leakage to out (guarded test) 317 6.0 384 23.2 0.669
MZ leakage to out (guarded test) 956 4.8 1,236 82.2 0.627
4.2 Environmental Data
Our team performed simultaneous measurements of several key environmental parameters,
including pressure differential (dP) in the isolation zone (IZ w.r.t. MZ) and in the main zone (MZ
w.r.t. outside), central air supply pressure, indoor and outdoor temperature and relative humidity,
and wind speed. Table 4 shows the statistical summary of three select parameters. For each
experimental case, the statistical parameter values (mean, minimum, and maximum) were
calculated using the ensemble data obtained from two or three repeat tests. Data QA/QC was
performed before calculating the statistical metrics.
The primary metric used in this project to evaluate potential containment effectiveness is the IZ
w.r.t. MZ pressure difference. ASHRAE Standard 170 was used as guidance on a suitable IZ
w.r.t. MZ pressure limit. ASHRAE 170 requires a hospital isolation room pressure differential of
at least -2.5 Pa w.r.t. adjacent zones as well as several other matters not part of this research.
Higher IZ pressure (toward zero or positive values) indicates inadequate pressure gradient and
more potential for diminished containment control.
11Lab Home Testing of Residential Isolation Space Control to Minimize Infectious Disease Transmission in
Existing Single-Family Homes
Table 5. Statistical Summary of Select Environmental Data
IZ dP w.r.t. MZ (Pa) MZ dP w.r.t. Outside (Pa) Mean Temp. (°F)
Case # Mean Min. Max. Mean Min. Max. IZ MZ Out
1 0.0 0.0 0.0 -1.1 -2.6 0.4 68.0 71.2 61.5
2 -0.3 -2.0 0.0 -2.2 -3.3 -0.8 70.5 72.7 63.8
3 -0.2 -0.3 0.0 -0.7 -2.2 0.5 68.1 72.8 65.0
4 -7.0 -7.8 -6.6 -2.0 -2.6 -0.5 75.3 71.8 77.9
5 -2.7 -2.9 -2.5 -0.7 -0.9 -0.5 85.9 77.0 82.2
6 -5.6 -7.0 -3.9 3.2 2.2 3.9 74.3 69.4 75.2
7 -1.6 -2.6 -1.0 3.9 3.1 4.7 75.0 69.9 76.2
8 -0.8 -2.4 0.5 -0.3 -1.3 1.3 80.0 79.7 81.0
9 -0.9 -1.2 -0.7 -0.8 -1.4 0.0 82.0 76.9 78.6
10 Monitoring IZ door opening/closing under conditions for Case 5
11 2.0 1.3 2.9 -2.0 -2.7 -1.0 70.4 70.9 78.6
12 -1.2 -2.9 -0.2 -3.6 -4.4 -2.4 76.4 76.3 78.1
13 -0.1 -0.4 0.0 -0.2 -0.8 0.5 74.6 75.7 72.5
14 -0.7 -1.0 -0.4 -1.7 -2.5 -0.9 67.3 71.5 65.7
15 0.3 -0.2 0.7 -0.9 -1.8 -0.3 65.6 73.0 58.4
16 -0.2 -0.4 0.2 -0.9 -2.7 0.4 70.4 73.2 66.8
17 -5.4 -6.2 -2.3 -2.5 -3.7 -0.7 73.4 75.0 77.8
When IZ w.r.t. MZ dP was compared to the benchmark value of -2.5 Pa, four cases (4, 5, 6, and
17) met and/or exceeded (more negative) this threshold. The resulting IZ differential pressure (IZ
dP) data for 13 cases exhibited inadequate depressurization of the IZ (Table 4). The test
conditions for two cases (11 and 15) were unable to create any depressurization in the IZ. Cases
such as 7 and 12 could be considered moderate containment strategies because the dP values
were slightly less negative than -2.5 Pa.
A few general comments and test conclusions can be drawn from Table 4 and are offered here:
• Methods involving the IZ door and supplies being closed and IZ air exhausted to outdoors
using at least 110 CFM offered effective containment (Cases 4, 5, 6, and 17).
• An open door between the IZ and MZ with open supply grilles during heating or cooling
offered no containment (Case 1), and operation of an IZ exhaust at 110 CFM was still not
adequate with the IZ open door (Case 2).
• Closing the IZ door and sealing IZ supply grilles with no mechanically moving air across
the IZ zone is not adequate (Case 3).
• Opening windows (Cases 8, 13, 15) helps ventilate and dilute pollutants; however, the
effectiveness depends on wind speed and direction. When the wind blew into IZ windows,
12Lab Home Testing of Residential Isolation Space Control to Minimize Infectious Disease Transmission in
Existing Single-Family Homes
it tended to produce positive pressure in IZ w.r.t. MZ (Case 15). However, when the wind
was not blowing into open IZ windows, there was slight negative pressure (Case 8).
• Although closing doors, blocking IZ supply air, and using IZ exhaust of at least 110 CFM
outdoors was reasonably effective in these tests, a serious drawback was that during very
warm or cold weather, the ill person in the IZ is likely to experience uncomfortable room
thermal conditions (as can be observed in comparing IZ and MZ mean room temperatures
shown in Table 4). For example, Case 5 IZ temperature was 8.9°F warmer than the MZ and
3.7°F warmer that outdoors. And, opening the supply grilles to a central air system may
totally negate the IZ depressurization (Case 11).
• Case 17, which used a portable room air conditioner, was effective at maintaining adequate
negative pressure in the IZ and comfortable conditions during warm weather. Cost is a
drawback, with typical retail for a unit that can handle a master bedroom between $300 and
$600.
• It is expected that IZ containment in a residence would only need to be instituted for a
short-term period of less than a month. However, in the event a longer-term
depressurization of an IZ w.r.t. outdoors is anticipated, homes in humid climates should be
aware of the potential for moisture-related durability issues during humid outdoor weather.
Such concerns arise when outdoor dew points are high (exceeding 72°F), and due to the
long-term infiltration of the humid air that results from space depressurization. While most
modern homes are unlikely to have any problems, moisture-related durability issues may
occur if the IZ has vapor-impermeable floor or wall coverings, such as vinyl wallpaper,
and/or if the IZ is cooled to temperatures below outdoor dew point temperatures (Moyer et
al. 2001).
4.3 Best and Worst Containment Test Cases
Collectively, the pressure differential data (Table 5) and the indoor air quality measurement data
obtained from the diffuser and tracer gas tests enabled us to determine the most effective means
to maintaining pressure differentials and creating containment in an isolation space.
Simultaneous measurements of PM2.5 and tracer gas in both the IZ and MZ during the period of
an intervention (e.g., bathroom exhaust fan or IZ window fan operation) were used to estimate
concentration ratios (MZ/IZ) for both species. Together, these ratios and pressure differential
values (IZ dP) were further examined to determine the best and worst containment strategies. In
Table 5, the four best and four worst cases are listed.
13Lab Home Testing of Residential Isolation Space Control to Minimize Infectious Disease Transmission in
Existing Single-Family Homes
Table 6. Differential Pressure and Concentration Ratios for PM2.5 and Tracer Gas
Wind
MZ dP Tracer Wind
PM2.5 Direction
IZ dP w.r.t. MZ (Pa) w.r.t. Gas Speed
(MZ/IZ) (Degrees
Out (Pa) (MZ/IZ) (mph)
From North)
Case
Type Mean Min. Max. Mean Mean Mean Mean Mean
#
4 -7.0 -7.8 -6.6 -2.0 0.068 0.080 6.2 88 S
5 -2.7 -2.9 -2.5 -0.7 0.054 0.085 5.5 93 S
Best
6 -5.6 -7.0 -3.9 3.2 0.033 0.067 7.2 164 S
17 -5.4 -6.2 -2.3 -2.5 0.284 0.099 7.4 181 S
1 0.0 0.0 0.0 -1.1 0.572 0.779 5.1 194 S
2 -0.3 -2.0 0.0 -2.2 N/A 0.683 5.5 230 SW
Worst
8 -0.8 -2.4 0.5 -0.3 0.374 0.411 6.8 224 SW
11 2.0 1.3 2.9 -2.0 0.292 0.640 6.5 78 E
Generally, a lower MZ/IZ value (close to 0) for both PM2.5 and tracer gas denotes a strong IZ
containment. However, operating conditions of the IZ during an experiment affect the decay rate
of injected aerosols and/or tracer gas, which could result in a fast decrease in concentrations in
the IZ. In such cases, even a small increase in concentrations in MZ could result in large MZ/IZ
ratios, which could infer containment that is worse than actual. Considering this caveat, we
examined the MZ/IZ values in the context of pressure differentials (e.g., IZ dP) while
determining the best and worst case containment scenarios listed in Table 5.
We can see in Table 5 that Case 4 (MZ/IZ = 0.068 to 0.080) provided the strongest containment,
as the resulting dP in the IZ exceeded the minimum IZ pressure requirement by a factor of ~3.
Case 4 ran a portable window fan as an exhaust fan to create IZ depressurization while keeping
the IZ door closed at all times. In Case 6, this window fan was relocated in the MZ and operated
as a supply fan installed in one of the MZ windows while the bathroom exhaust fan in the IZ was
ON. The resulting pressure differential (IZ dP) ranged from -7.0 to -3.9 Pa, providing more than
enough depressurization for the minimum threshold requirement of -2.5 Pa. Consequently, the
MZ/IZ values ranged from 0.033 to 0.067.
The data from Case 5 reveal that a bathroom exhaust fan with a flow of ~100 CFM is capable of
creating adequate depressurization (dP = -2.7 Pa) in the IZ. However, in practice, it is common to
find a bathroom exhaust fan delivering an exhaust flow much less than 100 CFM. In such cases,
this strategy might not be able to create a strong containment in the IZ unless the IZ is very
airtight or a small room. In Case 17, a portable room air conditioner was used, exhausting indoor
air to outdoors at 227 CFM. Table 5 shows that Case 17 achieved strong IZ depressurization
(-5.4 Pa). The use of a portable air conditioner could help maintain comfort and also be used to
maintain depressurization as long as it is cooling. In contrast, the worst cases (1, 8, and 11) had
14Lab Home Testing of Residential Isolation Space Control to Minimize Infectious Disease Transmission in
Existing Single-Family Homes
dP (IZ) values ranging from -0.8 to +2.0 Pa, indicating very weak IZ containment. The values of
MZ/IZ for these cases are also very large. They ranged from 0.411 to 0.779, suggesting a strong
transfer of PM2.5 and/or tracer gas from the IZ to MZ.
Figure 2 compares these seven cases (grouped into two categories, best and worst) using the
concentration ratios (MZ/IZ for PM2.5 and tracer gas) and mean pressure differential (IZ dP)
values.
Figure 2. Comparison between strong and weak containment strategies
4.3.1 Examples of Four Best Containment Strategies
In this section, illustrative examples for Cases 4, 5, 6, and 17 are presented for PM2.5. For each
case, the measurement duration is divided into four subcategories: background, PM2.5 build-up,
intervention, and post-intervention. Background refers to the period before aerosol generation
and any intervention applied; PM2.5 build-up refers to the period when the diffuser was turned on,
generating aerosols in the IZ without an intervention; intervention refers to the experimental
period when an isolation intervention was applied while the diffuser was still continuously
emitting aerosols; and post-intervention refers to the period when aerosol generation and
containment control was discontinued.
4.3.1.1 Case 4
In this test example, depressurization in the IZ was created by running the portable window fan
(as exhaust) at high-speed setting (delivering 328 CFM). In this particular test, we experienced
difficulties generating strong PM2.5 signal from the diffuser (11:30 to ~13:15) in the IZ. The issue
was fixed at around 13:15. For calculation purpose (i.e., MZ/IZ), we considered the intervention
period from 13:15–14:15. As can be seen from Figure 3, during this period (13:15–14:15), PM2.5
concentrations in the IZ were a factor of ~20 higher than MZ concentrations. Throughout the
15Lab Home Testing of Residential Isolation Space Control to Minimize Infectious Disease Transmission in
Existing Single-Family Homes
intervention period (14:15–15:15), a rapid decline in IZ concentration was observed, primarily
due to operating the window exhaust fan, which expelled a majority of the particles outside the
building. The observed negative pressure in the IZ also supports this notion. No noticeable
increase in the MZ concentration (as compared to the background and pre-intervention
concentrations in the MZ) was observed during the window exhaust fan operation, suggesting
very little to no transfer of air from IZ to MZ.
Figure 3. Time-series of PM2.5 for Case 4
4.3.1.2 Case 5
In this test example, depressurization in the IZ was created by running a bathroom exhaust fan at
a high-speed setting (delivering 110 CFM). As can be seen in Figure 4, during the start of this
period (16:15–17:36), PM2.5 concentrations in the IZ and MZ were 174 and 1 µg m-3,
respectively. Throughout the intervention period, we observed a rapid decline in IZ
concentration, primarily due to operating the bathroom exhaust fan that transferred a majority of
the particles outside the building and resulted in dilution as air from around the IZ infiltrated.
The observed negative pressure in the IZ also supports this notion. No noticeable increase in the
MZ concentration during the exhaust fan operation was observed, suggesting very little to no
transfer of air from the IZ to the MZ. It can be seen in Figure 4 that during the PM2.5 build-up
period (14:40–16:14), PM2.5 concentrations in the MZ increased slightly from background
concentration. During the pre-intervention period, Figure 4 shows the pressure was neutral at the
time when the PM2.5 concentration increased. Because the door from IZ to MZ was closed and
supply and return grilles in the IZ were completely sealed throughout the entire duration of this
test, the increase in the MZ was primarily attributed to air transfer from the MZ to the IZ through
the door undercut. This pattern was common in other test cases during the pre-intervention test
period.
16Lab Home Testing of Residential Isolation Space Control to Minimize Infectious Disease Transmission in
Existing Single-Family Homes
Figure 4. Time-series of PM2.5 for Case 5
4.3.1.3 Case 6
In this test example, depressurization in the IZ was created by running the window fan as supply
(high-speed setting), delivering 328 CFM of supply air in the MZ. The IZ door and windows
remained closed and no other intervention measures were imposed in the IZ. As can be seen in
Figure 5, during the start of the intervention period (12:00–14:30), PM2.5 concentrations in the IZ
and MZ were 185 and 2.5 µg m-3, respectively. Throughout the intervention period, a rapid
decline in IZ concentration was observed, which is consistent with the prior two discussed cases.
No noticeable increase in the MZ concentration during the exhaust fan operation was observed,
suggesting very little to no transfer for air from IZ to MZ.
Figure 5. Time-series of PM2.5 for Case 6
17Lab Home Testing of Residential Isolation Space Control to Minimize Infectious Disease Transmission in
Existing Single-Family Homes
4.3.1.4 Case 17
In this test example, depressurization in the IZ was created by a portable AC that exhausted 227
CFM of IZ air to the outside. Figure 6 shows PM2.5 and IZ pressure for Case 17. Prior to the
containment test, the pre-test period allowed a build-up of concentration from about 12:05–
12:50. During this period, the MZ concentration can be observed increasing slightly with no
measurable IZ w.r.t. MZ pressure difference (0.0 Pa). This is another demonstration that aerosols
can move through leaks in closed doors from the IZ into the MZ at neutral pressure (particularly
through the bottom of the door undercut). During the start of the intervention period (13:02–
15:00), PM2.5 concentrations in the IZ were a factor of ~12 higher than MZ concentrations.
Throughout the intervention period, we observed a rapid decline in IZ concentration due to the
increased infiltration of MZ and outdoor air from depressurization. This demonstrates the benefit
of reducing elevated pollutant or viral load within the IZ. At the end of this period, the
concentration in the MZ decreased by ~2 µg m-3 from 5.33 µg m-3 (measured at 13:02),
suggesting no air transfer from IZ to MZ. However, during the build-up period (12:00–13:01),
air transfer from IZ to MZ through the door undercut occurred, increasing the mean PM2.5
concentrations by ~2 µg m-3 from the mean background concentration of 1.3 µg m-3.
Figure 6. Time-series of PM2.5 for Case 17
4.3.2 Examples of Three Weak Containment Strategies
4.3.2.1 Case 1
In the example shown in Figure 7 for Case 1, the experimental data for the period 11:30–14:30
refer to the IZ door open scenario, while no intervention was applied. This test configuration
resulted in neutral pressure (0 Pa) condition in the IZ (Figure 7). After the build-up period
(10:30–11:30), opening the IZ door resulted in a rapid decline in PM2.5 concentrations in the IZ.
At the same time, there has been a strong increase in concentration in the MZ. From 11:30 to
14:30, the mean PM2.5 concentrations in the IZ and MZ were within a factor of 2, while during
18Lab Home Testing of Residential Isolation Space Control to Minimize Infectious Disease Transmission in
Existing Single-Family Homes
the build-up period (with closed door), the mean concentration in the IZ was higher by a factor of
~50 from the mean MZ concentration. Collectively, these findings suggest this test configuration
(i.e., open IZ door, open supply grilles in IZ, with central forced air on) has the least potential for
IZ containment.
Figure 7. Time-series of PM2.5 for Case 1
4.3.2.2 Case 8
The large range (-2.5 to +0.5 Pa) in the measured IZ differential pressure data (Table 5) for this
case suggests that the containment potential is highly dependent on outdoor conditions such as
wind speed and direction, both of which could influence the pressure dynamics in the IZ room.
Because of this uncontrollable external factor, the test results are challenging to generalize for a
given indoor condition and IZ intervention approach (e.g., use of bathroom exhaust fan).
Figure 8 illustrates an example of this case, and shows a large fluctuation in the dP values during
the intervention period (11:35–13:20). At the same time, PM2.5 concentrations also increased in
the MZ. Given the strong dependency on wind conditions, the outcome of this test could be
varied (from weak containment to strong containment). However, based on our differential
pressure data (a mean of IZ dP of -0.8), this case is deemed a weak containment strategy.
19You can also read