Life Cycle Assessment of a Plant-Based, Regionally Marketed Shampoo and Analysis of Refill Options

Page created by Nathaniel Barker
 
CONTINUE READING
Life Cycle Assessment of a Plant-Based, Regionally Marketed Shampoo and Analysis of Refill Options
sustainability

Article
Life Cycle Assessment of a Plant-Based, Regionally Marketed
Shampoo and Analysis of Refill Options
Hanna Kröhnert and Matthias Stucki *

                                          Institute of Natural Resource Sciences, Life Sciences and Facility Management, Zurich University of Applied
                                          Sciences (ZHAW), CH-8820 Wädenswil, Switzerland; hanna.kroehnert@gmail.com
                                          * Correspondence: matthias.stucki@zhaw.ch

                                          Abstract: The environmental impact of a plant-based shampoo produced and marketed in Zurich,
                                          Switzerland, was analyzed using the life cycle assessment method. Beside the identification of
                                          environmental hotspots and mitigation possibilities, the focus of the study was on the analysis and
                                          comparison of different refill offers. The results of the study show that one hair wash using the
                                          investigated shampoo is related to greenhouse gas emissions of 161 g CO2 eq. For all investigated
                                          impact categories, the use phase represents the dominant life stage, except for land use, which is
                                          dominated by the production of the purely plant-based shampoo ingredients. The environmental
                                          impact related to the use phase is highly sensitive on the consumers’ showering habits, such as water
                                          consumption and water temperature, due to predominantly fossil-based heating in Zurich. On the
                                          producer’s side, a switch to renewable energy sources both for heating and electricity is identified as
                                          most effective measure to reduce the environmental impact of the manufacturing phase. As to the
                                          product end-of-life, the results suggest that emissions of the shampoo ingredients after wastewater
                                          treatment have a negligible impact on freshwater ecotoxicity. In this context, a need for further
                                research is identified with respect to characterization factors and specific removal rates in wastewater
         
                                          treatment plants. From a life cycle perspective, packaging production and disposal have rather low
Citation: Kröhnert, H.; Stucki, M.
                                          contributions. Offering refill possibilities can reduce the packaging related contributions by several
Life Cycle Assessment of a
                                          percentage points, however, higher mitigation potentials are found for use phase and manufacturing.
Plant-Based, Regionally Marketed
Shampoo and Analysis of Refill
                                          Keywords: shampoo; natural ingredients; packaging; refill; LCA; environmental impact
Options. Sustainability 2021, 13, 8478.
https://doi.org/10.3390/su13158478

Academic Editor: Silvia Fiore
                                          1. Introduction
Received: 9 June 2021                           Shampoo represents one of the most common personal care products: In European
Accepted: 22 July 2021                    households, shampoo is used with an average application frequency of two to three times
Published: 29 July 2021                   per week [1], amounting to about 2 kg of shampoo used per person each year [2]. While
                                          previously rather neglected as a research topic [3], the environmental impact of personal
Publisher’s Note: MDPI stays neutral      care products from a life cycle perspective has received increasing attention in the last
with regard to jurisdictional claims in   decade. However, publications on life cycle assessment (LCA) of shampoo using a cradle-
published maps and institutional affil-
                                          to-grave approach are still rare.
iations.
                                                At the European level, comprehensive LCA studies on representative products were
                                          conducted by Cosmetics Europe and Quantis [4,5] and by the Joined Research Centre of
                                          the European Commission [6], which considered ingredients compositions and packaging
                                          solutions most widely used on the European market. The two studies found various envi-
Copyright: © 2021 by the authors.         ronmental hotspots for shampoo: climate change, water resource depletion, mineral and
Licensee MDPI, Basel, Switzerland.        fossil resource depletion, eutrophication, particulate matter, human toxicity, and freshwater
This article is an open access article    ecotoxicity. While the results for freshwater ecotoxicity are almost entirely dominated by
distributed under the terms and
                                          the product disposal via wastewater treatment, the studies show that all other ecological
conditions of the Creative Commons
                                          hotspots contain a major contribution from the use stage of the shampoo, specifically the
Attribution (CC BY) license (https://
                                          use of hot water while showering. In fact, the extent of the environmental impact of a
creativecommons.org/licenses/by/
                                          shampoo is very sensitive towards consumer habits such as the water temperature and the
4.0/).

Sustainability 2021, 13, 8478. https://doi.org/10.3390/su13158478                                       https://www.mdpi.com/journal/sustainability
Life Cycle Assessment of a Plant-Based, Regionally Marketed Shampoo and Analysis of Refill Options
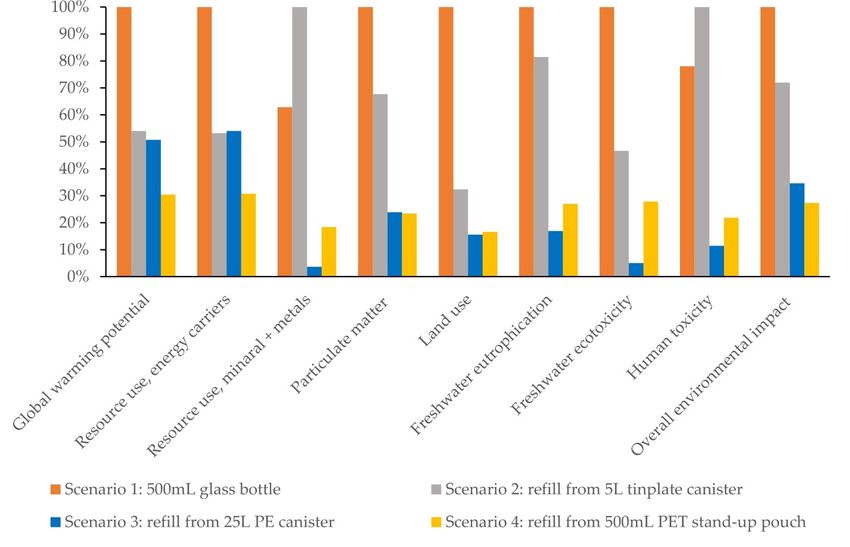
Sustainability 2021, 13, 8478                                                                                          2 of 21

                                water consumption while showering. In addition, the energy mix assumed for the heating
                                system has a strong impact on the results [4].
                                     Relevant processes in the producer’s area of influence are for example the choice
                                of ingredients and the choice of packaging material [6]. Regarding the ingredients of a
                                shampoo, the origin of the raw materials plays an important role, especially for surfactants,
                                which form the main component of shampoo, apart from water. Surfactants in conventional
                                shampoo formulas are typically produced on a petro-chemical basis, like sodium laureth
                                sulfate. Despite regulations regarding toxicity and concentration levels of surfactants,
                                there are still concerns about their biodegradability and eco-friendliness [7]. The growing
                                ecological awareness of consumers has prompted an increased market share of bio-based
                                surfactants because of their biodegradability and biocompatibility properties [8]. Examples
                                of biogenic resources for surfactants are palm oil and rape seed oil. Bio-based surfactants
                                can help to reduce the usage of fossil resources. At the same time, the cultivation of oil
                                plants generally results in higher eutrophication, in a higher land use and, depending on
                                the oil plant and agricultural practice, even in a higher global warming potential [9].
                                     As most shampoos are sold in plastic bottles, there is a trend towards replacing fossil-
                                based plastic by materials based on biogenic resources [6]. However, the use of bio-based
                                plastic is not without controversy, mainly because of land use and potential competition to
                                food production connected to agro-based feedstocks [10].
                                     Refill packages represent an effective measure to reduce waste, not only for shampoo,
                                but also for soaps and household detergents [11]. According to Koehler and Wildbolz [3],
                                the overall environmental impact of shampoo originally sold in plastic bottles could be
                                reduced by more than 10% by selling refill portions in stand-up pouches made of plastic.
                                By now, refill pouches belong to the standard product range of supermarkets and are well
                                accepted by costumers, also because unit prices are normally lower for refill products [11].
                                     A different approach that aims at waste prevention is that consumers fill their own
                                containers from bulk dispensers directly in the stores. Bulk dispensers are normally avoided
                                by big retailers, as they require a change in logistics as well as a substantial behavioral
                                change from consumers [12,13]. Nonetheless, the number of small eco-oriented zero-
                                waste stores addressing environmentally conscious costumers surged in the last decade in
                                Europe [14]. A survey by Branska et al. [14] showed that frequent costumers of zero-waste
                                stores do not primarily expect lower prices, but rather appreciate the opportunity to buy
                                high quality products and to support local producers. In this context, zero-waste stores
                                represent a market opportunity for regional producers.
                                     The importance of waste prevention has an additional dimension for developing
                                regions that do not have an established waste collection system, and that suffer from
                                massive littering. Haerulloh and Hiwari [15], for example, propose the launch of bulk
                                stores with refill possibilities for a remote coastal region in Indonesia in order to rise
                                environmental awareness and to fight marine pollution from household waste.
                                     As alternative to commonly used plastic bottles, glass bottles are often regarded as
                                environmentally friendly by consumers [16]. In contrast to this perception, the environ-
                                mental performance of glass is strongly compromised by the high energy demand for the
                                production and the high fuel consumption for transportation, especially compared to light
                                plastic materials with high ratios of recycled materials [17]. Nonetheless, glass bottles in
                                combination with reuse options can make sense on a local scale with short transportation
                                distances, as shown by Ferrara and De Feo [18].
                                     The general findings of LCA studies on representative shampoo formulas can be
                                applied to a wide range of shampoos, e.g., the sensitivity towards the consumers’ showering
                                habits and the trade-off considerations to be made concerning raw materials both for
                                ingredients and packaging materials. At the same time, the results show that product-
                                specific studies should be conducted in order to derive effective recommendations for the
                                reductions of the environmental impact of individual shampoos. This is particularly true
                                for niche products, such as eco-oriented products from small producers, which often use
                                neither main-stream ingredients nor main-stream packaging solutions.
Life Cycle Assessment of a Plant-Based, Regionally Marketed Shampoo and Analysis of Refill Options
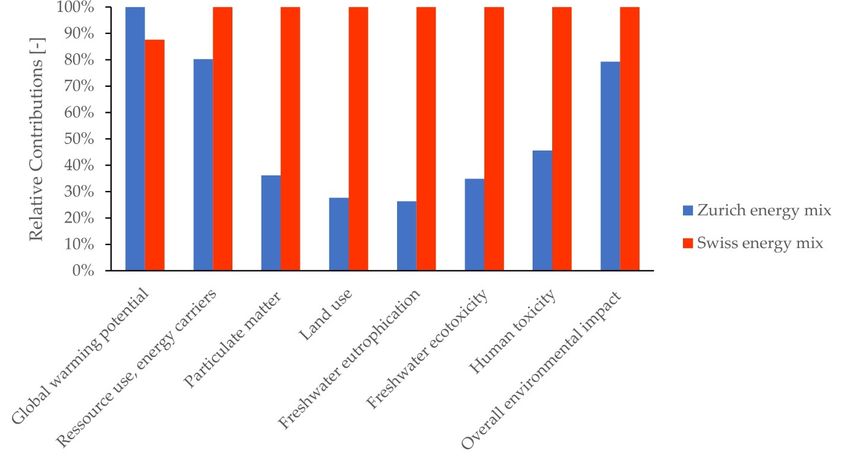
Sustainability 2021, 13, 8478                                                                                                 3 of 21

                                      This paper summarizes the results of an LCA study carried out for such a product: a
                                 natural shampoo that is produced by a small manufactory and that is sold in glass bottles
                                 mainly on a regional market in Switzerland. The goals of the study were (a) to quantify
                                 the environmental impact of the shampoo and to deduce recommendations for further
                                 improvements, mainly from the producer’s perspective, and (b) evaluate and compare four
                                 specific packaging scenarios, taking into account not only the waste reduction potential
                                 but also other relevant environmental indicators such as global warming potential and
                                 primary energy demand.

                                 2. Methods
                                      The environmental impact of the shampoo and of the different packaging scenarios
                                 was derived with the life cycle assessment method following the ISO 14040 standard [19],
                                 taking into account the resource demand and the emissions along the entire life cycle of
                                 the shampoo (cradle-to-grave). The analysis was carried out using the software SimaPro
                                 v9 [20].

                                 2.1. Functional Unit and Investigated Product System
                                          Analogously to the study carried out by Quantis [4], the life cycle of shampoo was
                                     divided into seven stages, as shown in Figure 1, which also summarizes the processes
                                     that were included in each life stage. The functional unit (FU) of the investigated product
                                     system consisted of one hair wash. Geographically, the study was conducted for Zurich,
                                     Switzerland, where the shampoo was produced, marketed, used, and disposed. With
                                     respect to the packaging material and the ingredients of the shampoo, the countries of
Sustainability 2021, 13, x FOR PEER REVIEW                                                                                 4 of 22
                                     extraction, cultivation, and production, respectively, were considered as well. The study
                                     was carried out in 2020 with the most current data being used.

      Figure 1. Investigated product system for one hair wash and considered processes for each life stage; packaging-depend-
      Figure 1. Investigated product system for one hair wash and considered processes for each life stage; packaging-dependent
      ent life phases are highlighted in orange.
      life phases are highlighted in orange.

                                 2.2. Data Collection and Life Cycle Inventory
                                      The reference flow, i.e., the amount of shampoo needed to fulfill the functional unit
                                 of one hair wash, was set to 9.5 g shampoo. This amount referred to the average shampoo
Life Cycle Assessment of a Plant-Based, Regionally Marketed Shampoo and Analysis of Refill Options
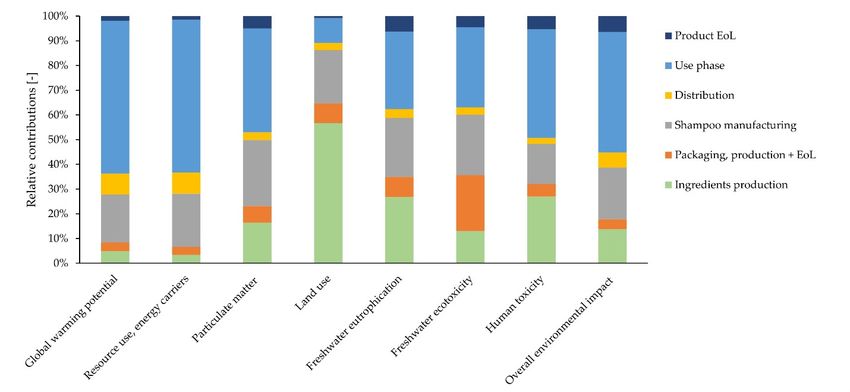
Sustainability 2021, 13, 8478                                                                                             4 of 21

                                     Four scenarios were compared regarding the packaging of the shampoo. The life
                                stages that were influenced by the choice of scenario were packaging production and
                                packaging end-of-life, and to a smaller extent product distribution.
                                Scenario 1 represented the basic version in which the shampoo was sold in a 500 mL glass
                                bottle, including a dispenser pump made of polyethylene (PE) and polypropylene (PP),
                                and packed in a small carton box as part of the primary packaging;
                                Scenario 2 represented an already existing refill option, which allowed customers to refill
                                their own bottles or containers in company-owned local shops out of single-use 5 L canisters
                                made of tin;
                                Scenario 3 described a potential alternative to the existing refill option, assuming the use
                                of single-use 25 L plastic canisters made from PE for refill;
                                Scenario 4 described another potential alternative to the existing refill option, selling refill
                                portions in 500 mL stand-up pouches made from polyethylene terephthalate (PET).

                                2.2. Data Collection and Life Cycle Inventory
                                      The reference flow, i.e., the amount of shampoo needed to fulfill the functional unit of
                                one hair wash, was set to 9.5 g shampoo. This amount referred to the average shampoo
                                dosage per application by German consumers [21], which was used as an approximation
                                due to the lack of specific data for Switzerland.
                                      Foreground data concerning the production of ingredients and packaging as well
                                as manufacturing and distribution were collected primarily via questionnaires from the
                                producer of the shampoo. This data comprised shampoo formula, packaging compositions,
                                transportation means and distances, building dimensions, production and sales volumes, as
                                well as energy consumption and energy sources. Foreground data related to the use phase
                                and the end-of-life stages were mainly taken from published values. In case of data gaps,
                                assumptions were made based on published values and own estimations. The ecoinvent-
                                v3.5 database [22] was used to model background inventory data, such as chemicals,
                                heat, electricity, tap water, machinery, buildings, packaging materials, transportation, and
                                waste treatment.
                                      Table 1 summarizes the main ingredients of the shampoo and the corresponding raw
                                materials. The production of the ingredients was modelled via ecoinvent background data,
                                and, when possible, taking into account the origin of the raw materials. While the exact
                                formula of the shampoo was known, approximations had to be made when assigning each
                                ingredient to a suitable ecoinvent dataset. The investigated shampoo contained more than
                                ten difference essential oils. For the sake of simplification, all essential oils were modelled
                                in a combined way as orange oil, which was the principal fragrance of the shampoo and
                                for which a detailed life cycle inventory was available in literature [23].

                                Table 1. Main composition of investigated shampoo and corresponding raw materials; the listed
                                ingredients account for more than 99 w%.

                                           Ingredient                Function       Composition          Raw Materials
                                       Deionized water                               [70–80 w%]             tap water
                                          Propanediol                humectant        [5–10 w%]               maize
                                        Coco-Glucoside               surfactant       [5–10 w%]          maize; coconut
                                 (Di)Sodium Cocoyl Glutamate         surfactant        [1–5 w%]     coconut; sugar beet/wheat
                                                                     emollient,
                                            Glycerin                                  [1–5 w%]     maize/sugar beet/soybean
                                                                    conditioning
                                          Sodium PCA                conditioning      [1–5 w%]             sugar cane
                                      Sodium Levulinate             preservative      [0–1 w%]               cellulose
                                             Alcohol                preservative      [0–1 w%]        sugar cane/sugar beet
                                           Citric Acid                buffering       [0–1 w%]                   -
                                 Essential oils and plan extracts    perfuming       [0–0.5 w%]              oranges
Life Cycle Assessment of a Plant-Based, Regionally Marketed Shampoo and Analysis of Refill Options
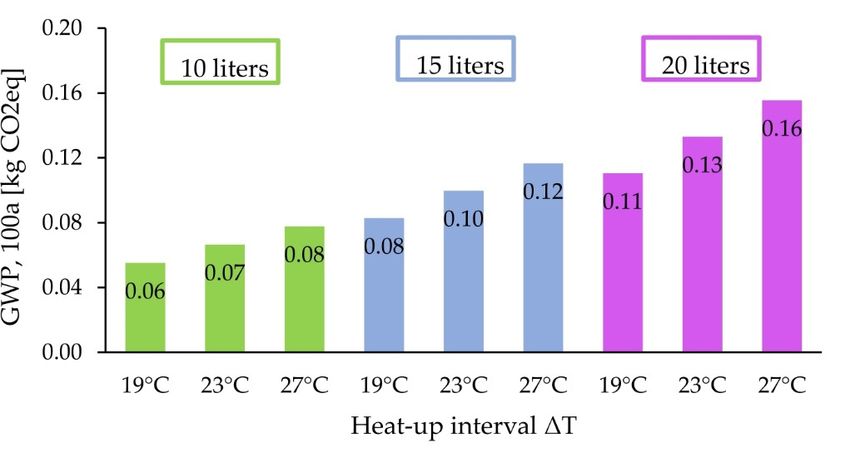
Sustainability 2021, 13, 8478                                                                                                  5 of 21

                                     Apart from water, all ingredients of the shampoo were bought from suppliers, mainly
                                abroad from Switzerland. The transport from the suppliers to the shampoo manufacturing
                                site was modelled individually for each ingredient based on the distances determined with
                                the web mapping service Google Maps [24].
                                     The composition of materials for different packaging scenarios is given in Table 2.
                                Again, the transport from the suppliers to the shampoo manufacturing site was modelled
                                individually for each component based on the distances determined with Google Maps.
                                Following the applied cut-off approach described below, the study did not include the
                                costumer-owned containers that are refilled with shampoo in scenario 2 to 4. However,
                                rinsing of containers with warm water prior to the refill was considered, assuming that
                                each container was rinsed twice with hot water heated up from 15 to 50 ◦ C, which led to a
                                water demand of 2 L and an energy demand of 0.3 MJ per kg refilled shampoo.

                                Table 2. Characteristics of four investigated packaging scenarios for shampoo; weight specifications
                                refer to the functional unit of 9.5 g shampoo.

                                                                                            Content of
                                         Component                    Material                                   Weight per FU
                                                                                         Recycled Material
                                         Scenario 1
                                       Bottle (500 mL)              brown glass                  69%                   5.1 g
                                      Dispenser pump                   PE/PP                     0%                   0.21 g
                                        Covering box                 cardboard                   95%                  0.54 g
                                 Box (secondary packaging)           cardboard                   95%                  0.92 g
                                         Scenario 2
                                        Canister (5 L)                tinplate                   75%                  0.83 g
                                 Box (secondary packaging)           cardboard                   95%                  0.51 g
                                        Scenario 3
                                       Canister (25 L)                   PE                      0%                   0.45 g
                                         Scenario 4
                                  Stand-up pouch (500 mL)               PET                       0%                  0.19 g
                                 Box (secondary packaging)           cardboard                   95%                  0.46 g

                                      Regarding the manufacturing phase, the energy demand both for heating and electric-
                                ity was derived based on the total consumption at the manufacturing site for 2019 and the
                                mass of the total production volume of the same year. This resulted in 0.26 MJ heating en-
                                ergy per FU based on oil and 23.4 Wh per FU based on the Swiss market mix for electricity.
                                The building, including office spaces, was modelled using a generic ecoinvent dataset for
                                multistory buildings. As copper appeared to be overestimated within the generic dataset,
                                it was excluded for this study to avoid unrealistically high contributions to the results,
                                especially regarding freshwater ecotoxicity. Based on actual building dimensions and
                                total production volume for 2019, a cubature of 22.5 cm3 per FU was derived, assuming a
                                building lifetime of 80 years. A shampoo loss of 2.5% during manufacturing was taken
                                into account, based on estimations by the producer.
                                      The shampoo being marketed on a local scale, a relatively short transportation distance
                                of 18 km from the manufacturing site to the producer-owned store was modelled for distri-
                                bution. Analogously to the manufacturing phase, the building and energy demand of the
                                store were derived based on actual building dimensions, the total energy consumption at
                                the store for 2019 as well as the total sales volume for 2019. Here, the results were a heating
                                energy of 0.05 MJ per FU based on natural gas and an electricity consumption of 2.2 Wh per
                                FU using an electricity mix mainly based on hydropower [25]. The corresponding value
                                for building cubature was 2.5 cm3 per FU. The transportation to the consumer’s home was
                                assumed to be undertaken by public transport (5 km with trolley bus), considering that the
                                shampoo was sold mainly in urban stores with little parking possibilities and generally
                                good connection to public transport.
Sustainability 2021, 13, 8478                                                                                            6 of 21

                                     For the use phase, a tap water consumption of 15 L per hair wash was assumed, heated
                                up from 15 ◦ C to 38 ◦ C with 90% energy efficiency, which resulted in an energy demand of
                                1.6 MJ per FU [4]. The energy mix for heating water (both for showering and for rinsing
                                containers to be refilled) was set to 49.9% natural gas, 27.2% oil, 15.8% district heating,
                                6% heat pump, 0.1% other sources, representing the energy mix of private households in
                                Zurich [26]. The impact of water temperature and water quantity as well as energy mix for
                                heating water on the results of the life cycle assessment was investigated with the help of
                                sensitivity analyses.
                                     Considering the household connectivity of nearly 100% in Switzerland, all wastewater
                                was assumed to be purified in a municipal wastewater treatment plant (WWTP). A large
                                WWTP was modelled with an average capacity size of 233,000 per-capita-equivalents (PCE)
                                and a three stage wastewater treatment (mechanical, biological, chemical), including sludge
                                fermentation [27]. The fermented sludge was assumed to be disposed via incineration.
                                The inventory of the wastewater treatment was assessed via an excel-based inventory
                                tool taking into account the wastewater volume and the chemical composition of the
                                shampoo [27]. To assess human toxicity and freshwater ecotoxicity due emissions of
                                shampoo ingredients after wastewater treatment, an average removal rate of 99.9% for
                                fragrances and 90% for other ingredients was applied [5].
                                     For the packaging end-of-life, following recycling rates were considered: 94% for
                                glass, 82% for cardboard, and 94% for tinplate [28]. Municipal solid waste incineration was
                                applied to the non-recycled materials.
                                     A detailed list of the inventory of all life stages as well as the used ecoinvent datasets
                                can be found in the supplementary material S1 of this paper.

                                2.3. Allocation and Recycling Processes
                                     The product system as shown in Figure 1 contained several multi-product processes,
                                which required an allocation of resources and emissions. The environmental burdens of
                                manufacturing building, shop building as well as the energy demand (heat and electricity)
                                were allocated based on the mass of production and sales volume, respectively. The life
                                cycle inventory of orange oil production was taken from a study by Beccali et al. [23]. Here,
                                the environmental impact of orange cultivation was allocated to two outputs, orange oil
                                and orange juice, following a combined mass and economic criterion. With respect to the
                                use phase, typical consumption patterns in Switzerland show a water consumption of 40 L
                                for each shower [29]. As showering often serves multiple purposes, such as skin cleansing,
                                hair washing and relaxation, 15 L of warm water was attributed to one hair wash, following
                                the approach by Quantis [5].
                                     Regarding ecoinvent background datasets, the system model allocation, recycled
                                content cut-off was used, in which the subdivision of multi-product activities was done
                                by allocation based on physical properties, economic revenue, mass, or other properties.
                                With respect to the packaging material, the cut-off system model implicated that the use
                                of recycled material did not lead to any environmental burden connected to the primary
                                extraction of raw materials. Accordingly, no environmental credit was granted for reuse
                                and recycling of the packaging materials at the end-of-life stage.

                                2.4. Impact Assessment
                                     The following impact categories were considered on midpoint-level: global warming
                                potential (GWP) on a 100a horizon [30]; resource use of non-renewable energy carries [31],
                                particulate matter [32], land use [33], and freshwater eutrophication [34] as implemented in
                                the European Footprint (EF) method; freshwater ecotoxicity [35] and human toxicity [35] as
                                implemented in the USEtox method, using both recommended and interim characterization
                                factors. Despite representing one of the ecological hotspots of shampoo, water scarcity was
                                omitted as impact indicator, as it was not consistently implemented in the ecoinvent-v3.5
                                database within SimaPro at the time the study was carried out. Resource use of minerals
                                and metals [31] was taken into account for the comparison of packaging scenarios, as
Sustainability 2021, 13, 8478                                                                                                                 7 of 21

                                     this indicator proved to be relevant with respect to the investigated tinplate canister of
                                     scenario 2. Because of high uncertainties within most methods, long-term emissions were
                                     excluded in the impact assessment for all midpoint indicators.
                                           In addition to the eight midpoint-indicators, the overall environmental impact as
                                     a single-score-indicator was included in the impact assessment, expressed in eco-points
                                     according to the ecological scarcity method [36], including long-term emissions. The
                                     ecological scarcity method aggregates 19 environmental impact categories to one single
                                     indicator using weighting factors on a distance-to-target principle. In the Swiss version
                                     of the method, weighting factors are derived by comparing current emissions to national
                                     emission targets and to international targets supported by Switzerland.

                                     3. Results
                                     3.1. Life Cycle Environmental Impact
                                          According to the life cycle assessment carried out in this study, one hair wash using
                                     the investigated shampoo is connected to greenhouse gas emissions of 161 g CO2 eq and
                                     a resource use of non-renewable energy carriers equivalent to 2.5 MJ, based on the IPCC
 Sustainability 2021, 13, x FOR PEER REVIEW                                                                                8 of 22
                                     2013 100a model and the EF method, respectively. Figure 2 shows the relative contributions
                                     from different life phases to all considered impact indicators.

       Figure2.2. Relative
      Figure      Relative environmental
                            environmentalimpact
                                              impactfrom
                                                       fromlifelife
                                                                 phases of shampoo,
                                                                    phases            assessed
                                                                            of shampoo,          withwith
                                                                                           assessed   IPCCIPCC
                                                                                                            2013 100a
                                                                                                                  2013(GWP),    the EF the
                                                                                                                        100a (GWP),    method
                                                                                                                                           EF
       (resource
      method      use, particulate
               (resource            matter,matter,
                         use, particulate    land use,
                                                    landfreshwater    eutrophication),
                                                          use, freshwater                the USEtox
                                                                            eutrophication),          method
                                                                                               the USEtox       including
                                                                                                           method          recommended
                                                                                                                    including  recommended and
       interim
      and       characterization
           interim                factors
                    characterization      (freshwater
                                      factors            ecotoxicity,
                                               (freshwater             human
                                                              ecotoxicity,      toxicity),
                                                                            human          and and
                                                                                    toxicity),  the ecological scarcity
                                                                                                    the ecological      method
                                                                                                                    scarcity     (overall
                                                                                                                             method       envi-
                                                                                                                                     (overall
       ronmental impact).
      environmental impact).

                                            The use
                                           The  use phase
                                                      phase isis the
                                                                  themost
                                                                        mostrelevant
                                                                               relevantlifelifestage
                                                                                                  stageforfor
                                                                                                           allall
                                                                                                               impact
                                                                                                                   impact categories, except
                                                                                                                             categories,     for land
                                                                                                                                          except  for
                                      use,  with the  highest    contributions      of more     than    60%   to GWP
                                     land use, with the highest contributions of more than 60% to GWP and to resource use and  to resource use  of en-
                                      ergy  carriers. The   manufacturing        phase   is  another     relevant   life stage,
                                     of energy carriers. The manufacturing phase is another relevant life stage, which shows     which  shows  contri-
                                      butions around
                                     contributions       20% to
                                                      around    20%all to
                                                                        impact    categories.
                                                                           all impact             Land use
                                                                                         categories.      Land is use
                                                                                                                  attributed    by more
                                                                                                                       is attributed  by than
                                                                                                                                          more50%
                                                                                                                                                thanto
                                      the production
                                     50%                 of shampoo
                                           to the production              ingredients
                                                                  of shampoo             and only
                                                                                  ingredients       andbyonly
                                                                                                           10%by  to10%
                                                                                                                     the use   phase.
                                                                                                                           to the     For all For
                                                                                                                                  use phase.  investi-
                                                                                                                                                   all
                                      gated impact
                                     investigated      categories,
                                                    impact            the results
                                                             categories,             for the
                                                                            the results    for end-of-life     phase
                                                                                                 the end-of-life    phaseof packaging   materials
                                                                                                                             of packaging          are
                                                                                                                                           materials
                                      negligible
                                     are          compared
                                         negligible  compared   totothose
                                                                       thoseofofthe
                                                                                 theother
                                                                                      otherlifelifephases
                                                                                                     phases and,
                                                                                                              and, therefore, have
                                                                                                                                 have been
                                                                                                                                       beenincluded
                                                                                                                                            included
                                      inthe
                                     in  thepackaging
                                             packagingproduction
                                                           productionphase phaseininFigure
                                                                                       Figure1.1.
                                            The  most   relevant    processes
                                           The most relevant processes within eachwithin    eachlifelifephase
                                                                                                         phasearearehighlighted
                                                                                                                       highlightedTable
                                                                                                                                     Table33and
                                                                                                                                              andare
                                                                                                                                                   are
                                      discussedin
                                     discussed    inmore
                                                     moredetail
                                                             detailininthe
                                                                         thefollowing
                                                                              followingsections.
                                                                                            sections.

                                      3.1.1. Ingredients Production
                                           The production of ingredients turns out to be most relevant with respect to land use,
                                      to which it contributes by 57%, while its contributions to other indicators vary between
                                      3.4% for resource use of energy carriers and 27% for freshwater eutrophication. The high
                                      contribution to land use is caused by the fact that all ingredients are plant-based and,
                                      therefore, connected to cultivation of raw materials.
Sustainability 2021, 13, 8478                                                                                                                                                               8 of 21

      Table 3. Absolute results for the environmental impact of shampoo per FU (one hair wash) and identification of relevant processes and their relative contributions to the investigated
      impact categories, assessed with IPCC 2013 100a (GWP), the EF method (resource use, particulate matter, land use, freshwater eutrophication), the USEtox method including recommended
      and interim characterization factors (freshwater ecotoxicity, human toxicity), and the ecological scarcity method (overall environmental impact).

                                Global Warming         Resource Use,                                               Freshwater           Freshwater                                 Overall
                                                                          Particulate Matter      Land Use                                                 Human Toxicity
                                   Potential          Energy Carriers                                             Eutrophication        Ecotoxicity                            Environ. Impact
               Total:              161 g CO2 eq            2.5 MJ         3.8 × 10⁻⁹ dis. inc.      2.1 Pt        3.3 × 10⁻⁶ Peq      13.6 PAF·m3 ·day     1.3 × 10⁻⁸ cases     153 eco-points
   Ingredients; production
         and transport
          Propanediol                  1.7%                 1.4%                 5.1%                16%               9.8%                 4.6%                 13%                 4.3%
        Coco-Glucoside                 1.0%                 0.6%                 3.6%                10%               4.7%                 2.5%                 5.0%                2.8%
         Essential oils                0.4%                 0.4%                 2.8%                12%               3.6%                 2.3%                 1.4%                1.9%
       Disodium-Cocoyl-
                                       0.5%                 0.3%                 1.9%               8.3%               3.2%                 1.2%                 3.8%                2.1%
           Glutamate
            Glycerin                   0.5%                0.2%                  0.7%               4.0%               1.6%                 0.3%                 1.3%                0.9%
  Sodium-Cocoyl-Glutamate              0.1%                 0.1%                 0.5%               2.2%               0.8%                 0.3%                 1.0%                0.6%
            Alcohol                    0.1%                0.05%                 0.4%               0.9%               0.4%                 0.3%                 0.3%                0.2%
             Total                     4.9%                 3.4%                 16%                57%                27%                  13%                  27%                 14%
    Packaging; production,
        transport, EoL
          Glass bottle                 1.9%                 1.8%                 3.8%               4.7%               5.0%                 5.3%                 2.2%                2.2%
       Dispenser pump                  0.7%                 0.8%                 1.0%               0.2%               0.6%                 0.6%                 0.5%                0.6%
      Carton box, primary
                                       0.3%                 0.3%                 0.7%               1.1%               0.9%                 6.2%                 0.9%                0.4%
           packaging
   Carton board, secondary
                                       0.5%                 0.5%                 1.2%               1.8%               1.6%                 11%                  1.4%                0.7%
           packaging
             Total                     3.5%                 3.4%                 6.8%               7.9%               8.2%                 23%                  5.1%                4.0%
   Shampoo manufacturing
  Building, including offices          3.2%                 2.1%                 12%                19%                6.5%                 7.8%                 6.8%                5.4%
       Heating, with oil               15%                  13%                  8.8%               0.8%               3.7%                 7.5%                 4.5%                11%
           Electricity                 1.4%                 5.7%                 5.6%               1.2%               13%                  8.1%                 3.4%                3.7%
             Total                     19%                  21%                  27%                22%                24%                  24%                  16%                 21%
         Distribution
            Building                   0.4%                 0.2%                 1.3%               2.1%               0.7%                 0.8%                 0.7%                0.6%
   Heating, with natural gas           7.9%                 7.8%                 1.1%               0.2%               1.7%                 1.3%                 1.2%                5.1%
    Transport to costumer’s
                                       0.1%                 0.4%                 0.6%               0.6%               0.6%                 0.5%                 0.3%                0.3%
             home
             Total                     8.4%                 8.5%                 3.1%               2.9%               3.6%                 2.9%                 2.4%                6.1%
Sustainability 2021, 13, 8478                                                                                                                                    9 of 21

                                                                                  Table 3. Cont.

                                Global Warming    Resource Use,                                       Freshwater      Freshwater                         Overall
                                                                   Particulate Matter     Land Use                                  Human Toxicity
                                   Potential     Energy Carriers                                     Eutrophication   Ecotoxicity                    Environ. Impact
          Use phase
    Heat, from natural gas           34%              34%                4.6%                0.7%        7.6%            5.9%           5.3%              22%
        Heat, from oil               25%              23%                16%                 1.4%        11%             15%            10%               20%
    Heat, from wood chips           0.05%            0.05%               12%                 6.5%        0.2%            2.5%           2.1%              0.5%
    Heat, using heat pump           0.7%              1.8%               2.1%                0.4%        5.5%            3.0%           1.5%              1.5%
           Water use                1.4%              2.4%               6.0%                1.0%        5.6%            5.6%           21%               4.0%
             Total                   62%              61%                42%                 10%         31%             33%            44%               49%
         Product EoL
    Wastewater treatment             1.8%             1.5%               5.0%               0.8%          6.3%          4.4%            5.2%              6.4%
             Total                   1.8%             1.5%               5.0%               0.8%          6.3%          4.4%            5.3%              6.4%
                                                                                            scale:      2.5–10%        10–20%          20–30%             >30%
Sustainability 2021, 13, 8478                                                                                         10 of 21

                                3.1.1. Ingredients Production
                                      The production of ingredients turns out to be most relevant with respect to land use,
                                to which it contributes by 57%, while its contributions to other indicators vary between
                                3.4% for resource use of energy carriers and 27% for freshwater eutrophication. The high
                                contribution to land use is caused by the fact that all ingredients are plant-based and,
                                therefore, connected to cultivation of raw materials.
                                      Propanediol and coco-glucoside as the main shampoo ingredients show the highest
                                contributions to all impact indicators: Combined, they are responsible for about 50% of
                                the environmental impact of the whole ingredients production phase. The provision of
                                essential oils shows disproportionately high contributions, considering that they make up
                                less than 0.5 w% of the shampoo. The main reason for this is the low yield withing the
                                extraction of essential oils, leading to a high cultivation and energy demand. Furthermore,
                                some of the used essential oils are transported from the production site to Switzerland
                                via air, leading to a disproportionately high impact on climate change and resource use of
                                energy carriers, while the transportation processes of the other ingredients show rather
                                negligible contributions.
                                      For all ingredients, the impact on climate change, resource use of energy carriers and
                                particulate matter is mainly connected to the energy demand for cultivation and transfor-
                                mation processes. Drivers to freshwater eutrophication, freshwater toxicity, and human
                                toxicity are mining of hard coal and lignite to cover the energy demand for manufacturing
                                processes, mining of copper used in buildings as well as steel production for agricultural
                                machinery and irrigation systems. Furthermore, freshwater eutrophication is partially
                                caused by phosphate emissions from fertilizer use, freshwater toxicity is partially caused
                                by heavy metal emissions (e.g., mercury and zinc emissions) from fertilizer use, and human
                                toxicity is partially caused by copper emissions from plant protection products based on
                                copper oxide for the cultivation of raw materials such as maize, coconut, and citrus.
                                      With respect to the overall environmental impact according to the ecological scarcity
                                method, the ingredients production makes up 14% of the whole life cycle and is primarily
                                related to water pollutants, global warming and main air pollutants and particulate matter.

                                3.1.2. Packaging Production and End-of-Life
                                     From a life cycle perspective, the shampoo packaging has the highest contribution to
                                freshwater ecotoxicity (23%). Its contributions to all other investigated impact indicators
                                are between 3 to about 8%.
                                     Within the life phase itself, the production of the glass bottle represents the most
                                relevant process, the main driver for most indicators being the energy demand of glass
                                production processes. The glass bottle even shows a relatively high contribution to land
                                use. Here, the main drivers are wood pallets and cardboard for transportation, both being
                                based on wood as raw material. Freshwater ecotoxicity is the only impact indicator, which
                                is not primarily related to the glass bottle, but rather to the carton board used both for
                                primary and secondary packaging. This is due to high characterization factors attributed
                                to sludge as residual from carton board production.
                                     Due to high recycling rates in Switzerland for glass (94%) and cardboard (82%),
                                the disposal of the packaging, i.e., its end-of-life phase, shows only minor contributions
                                throughout all impact indicators and is, therefore, not listed among the relevant processes
                                in Table 3.
                                     The overall environmental impact of the packaging is mainly related to global warm-
                                ing as well as main air pollutants and particulate matter, reflecting the relevance of energy
                                demand within this life phase.

                                3.1.3. Shampoo Manufacturing
                                     The shampoo manufacturing shows consistent contributions of 16 to 27% to all impact
                                categories. It contains three similarly relevant processes: the manufacturing building,
                                heating of this building, and electricity demand.
Sustainability 2021, 13, 8478                                                                                         11 of 21

                                      The manufacturing building has the highest contribution of 19% to land use, which
                                is mainly caused by the utilization of wood as building material. The main driver for
                                its impact on particulate matter and freshwater ecotoxicity is the electricity demand for
                                aluminum production. Regarding heating of the manufacturing building, oil as energy
                                source shows the highest contributions of about 15% to climate change and resource use
                                of energy carriers. The refinery process of oil is mainly responsible for the contribution to
                                particulate matter, while drilling waste is responsible for the contribution to freshwater
                                ecotoxicity. Regarding the electricity demand, the import of electricity based on coal is the
                                main driver for its contributions to freshwater eutrophication, freshwater ecotoxicity and
                                particulate matter. In contrast to this, the contribution to resource use of energy carriers
                                is mainly due to the high share of nuclear energy in Switzerland and the corresponding
                                resource depletion of uranium.
                                      The overall environmental impact of the manufacturing phase accounts for 21% of the
                                whole life cycle impact. The most important impact categories within the manufacturing
                                phase are global warming as well as main air pollutants and particulate matter.

                                3.1.4. Distribution
                                     Heating the shop building with natural gas is the most relevant process within the
                                distribution phase, particularly regarding climate change (7.9%) and resource use of energy
                                carriers (7.8%).
                                     Unlike the manufacturing building, the shop building is not among the most relevant
                                processes. The cubage of the shop building per unit shampoo is about 10% of the cubage
                                of the manufacturing building, considering the different building sizes as well as the
                                yearly production volume and the yearly sales volume, respectively. Since the same
                                generic ecoinvent dataset is used for both buildings, the environmental impact of the shop
                                building has the same main drivers as the one of the manufacturing building but reaches
                                proportionally smaller values for all indicators.
                                     In contrast to the manufacturing phase, the electricity consumption of the shop has a
                                negligible environmental impact and is, therefore, not listed in Table 3. One reason for this
                                is the eco-friendly electricity product used for the shop, which is not based on the Swiss
                                market mix but is mainly based on hydropower. Another reason is the lower electricity
                                consumption per unit shampoo.
                                     Compared to other processes within the distribution phase, the transportation from
                                the shop to the consumer’s home by trolleybus is of minor relevance, reaching the highest
                                contributions of 0.6% to particulate matter, land use, and freshwater eutrophication. The
                                contribution to particulate matter is caused by emissions during road construction and the
                                electricity demand of the trolleybus, while freshwater eutrophication is mainly connected
                                to the electricity demand of the trolleybus and land use is mainly caused by the direct land
                                use of the road.
                                     The overall environmental impact of the distribution phase is dominated by its impact
                                on global warming.

                                3.1.5. Use Phase
                                     The use phase is the most dominant life phase, with contributions of more than 60%
                                to GWP and resource use of energy carriers. Its environmental impact, with exception
                                of human toxicity, is almost entirely attributed to the energy provision for heating water.
                                In this context, natural gas heating and oil heating represent two of the most relevant
                                processes within the whole shampoo life cycle, showing the most significant contributions
                                of 34% and ~25%, respectively, to climate change and resource use of energy carriers. In
                                addition, the production of oil is the main driver for relevant contributions to particulate
                                matter (16%), freshwater ecotoxicity (15%), and human toxicity (10%). The contribution
                                of oil heating to freshwater eutrophication (11%) is related to copper used for the oil
                                storage, more specifically to sulfidic tailings connected to copper mining. Heating with
                                wood, which makes up only 0.1% of the assumed energy mix, is a significant contributor
Sustainability 2021, 13, 8478                                                                                         12 of 21

                                to particulate matter (12%) and land use (6.5%), while all other heating systems (district
                                heating, heat pump, electricity, solar) have only minor to negligible contributions.
                                     Human toxicity is the only indicator within the use phase, for which tap water provi-
                                sion shows an equally high contribution (21%) as heat provision. This is due to slag from
                                the production of cast iron used for the construction of the water supply network.
                                     The overall environmental impact of the use phase makes up almost 50% of the impact
                                of the whole life cycle. It is dominated by climate change caused by heating water with
                                natural gas and oil.

                                3.1.6. Product End-of-Life
                                     The product end-of-life phase contains two main processes: wastewater treatment and
                                emissions of residual ingredients into water after wastewater treatment. However, the latter
                                effects practically only human toxicity, and only to a negligible extent. Consequently, the
                                environmental impact of the product end-of-life is almost entirely attributed to wastewater
                                treatment, with a maximum contribution of 5.2% to human toxicity. Most of the environ-
                                mental impact within the wastewater treatment process is caused by the construction of
                                infrastructure, namely the construction of sewer grid and of treatment facility.
                                     With respect to the overall environmental impact, water pollutants are the main
                                driver, followed by global warming, carcinogenic into air and main air pollutants and
                                particulate matter.

                                3.2. Comparison of Different Packaging and Refill Scenarios
                                     The results shown in the previous section refer to the packaging scenario 1, assuming
                                shampoo is sold in a 500 mL glass bottle with a dispenser pump made of PE and PP.
                                Summing all packaging related processes (production, transport, EoL), the global warming
                                potential related to the shampoo packaging is 6 g CO2 eq per FU.
                                     In the frame of this study, the potential environmental benefits of different refill
                                options as specified in Table 2 were analyzed. The results are summarized in Figure 3,
                                which shows a relative comparison between all four packaging scenarios with respect to
                                the considered impact indicators. The results contain resource use of minerals and metals
                                as additional impact indicator, as it proves to be an environmental hotspot related to the
                                production of tinplate.
                                     In general, the production of PE and PET requires less energy than the production
                                of glass and tinplate and at the same time leads to lower pollution due mining and metal
                                processing. As a consequence, most impact indicators on midpoint level show a reduction
                                between 20% and 50% for scenario 2 compared to scenario 1, and an even higher reduction
                                between 50% and 90% for scenario 3 and 4. Exceptions to this trend are resource use of
                                minerals and metals, as well as human toxicity.
                                     Regarding resource use of minerals and metals, the tinplate canister shows a higher
                                impact than the glass bottle, increasing the result by almost 70%. More than half of resource
                                use of minerals and metals for the tinplate canister is related to tin, even though the
                                assumed tin content of the canister is merely 0.02% and only 45% of the tin is primary
                                material, while 55% is secondary material recovered from recycling processes.
                                     Human toxicity forms another impact indicator for which the tinplate canister shows
                                a higher impact than the glass bottle, leading to an about 30% higher value. Here, steel
                                and tin are equally responsible for the increase due to pollution connected to metal and
                                coal mining.
                                     No recycling is considered for the packaging end-of-life of scenarios 3 and 4, which
                                means that both PE canister and PET stand-up pouch are assumed to be disposed via
                                municipal incineration, while high recycling rates are assumed for glass (94%) and tinplate
                                (82%). The incineration of PE and PET leads to considerable emissions of CO2 , which
                                explains why the decrease for global warming potential is less than for other midpoint
                                indicators. In fact, sending both packaging to be recycled instead of incinerated would
                                increase the GWP reduction for scenario 3 and 4 to 75 to 80% compared to scenario 1.
of the environmental impact within the wastewater treatment process is caused by the
                                     construction of infrastructure, namely the construction of sewer grid and of treatment fa-
                                     cility.
                                           With respect to the overall environmental impact, water pollutants are the main
Sustainability 2021, 13, 8478        driver, followed by global warming, carcinogenic into air and main air pollutants      and
                                                                                                                        13 of 21
                                     particulate matter.

                                    3.2. Comparison of Different Packaging and Refill Scenarios
                                         A  major
                                          The       part
                                               results    of land
                                                       shown       useprevious
                                                               in the  connected  to the
                                                                               section    glass
                                                                                       refer     bottle
                                                                                             to the      is caused
                                                                                                     packaging     by wood
                                                                                                                scenario       pallets
                                                                                                                          1, assuming
                                    and  cardboard    for transportation,  which  are included    in the  ecoinvent −
                                    shampoo is sold in a 500 mL glass bottle with a dispenser pump made of PE and for 3.5 dataset  PP.
                                    packaging glass. In contrast, the datasets used of tinplate, PE, and PET do not contain
                                    Summing all packaging related processes (production, transport, EoL), the global warm-
                                    wood pallets or cardboard, which explains the decrease in land use for scenarios 2, 3, and 4.
                                    ing potential related to the shampoo packaging is 6 gCO2eq per FU.
                                         Comparing the PE canister and PET stand-up pouch, the PET pouch leads to lower
                                          In the frame of this study, the potential environmental benefits of different refill op-
                                    values for GWP, particulate matter, and resource use of energy carriers. This is mainly
                                    tions as specified in Table 2 were analyzed. The results are summarized in Figure 3, which
                                    because less material per unit shampoo is needed using a PET pouch compared to a PE
                                    shows a relative comparison between all four packaging scenarios with respect to the con-
                                    canister. On the other hand, PE canisters can be distributed without secondary packaging,
                                    sidered impact indicators. The results contain resource use of minerals and metals as ad-
                                    while PET pouches are distributed in cardboard boxes. Therefore, PE canisters perform
                                    ditional impact indicator, as it proves to be an environmental hotspot related to the pro-
                                    better with respect to freshwater eutrophication, freshwater ecotoxicity, and human toxicity.
                                    duction of tinplate.

       Figure3.3.Comparison
      Figure      Comparisonof  ofdifferent
                                   differentpackaging
                                              packagingscenarios
                                                          scenariosper
                                                                     perhair
                                                                         hairwash.
                                                                               wash.The
                                                                                      Theresults
                                                                                           resultsshown
                                                                                                   shownrefer
                                                                                                           referonly
                                                                                                                 onlytotopackaging
                                                                                                                          packagingrelated
                                                                                                                                      related
      processes  (production,  transportation,   packaging   EoL) and are based  on IPCC   2013 100a  (GWP),  the
       processes (production, transportation, packaging EoL) and are based on IPCC 2013 100a (GWP), the EF method EF method   (resource  use,
                                                                                                                                   (resource
      particulate matter,matter,
       use, particulate    land use, freshwater
                                  land            eutrophication),
                                        use, freshwater             the USEtox
                                                          eutrophication),   the method
                                                                                 USEtox including    recommended
                                                                                          method including           and interim
                                                                                                               recommended        character-
                                                                                                                                and  interim
       characterization
      ization            factors (freshwater
              factors (freshwater   ecotoxicity,ecotoxicity, humanand
                                                 human toxicity),    toxicity), and the scarcity
                                                                        the ecological  ecological  scarcity
                                                                                                 method      method
                                                                                                          (overall    (overall environmen-
                                                                                                                   environmental    impact).
       tal impact).
                                          The overall environmental impact of the shampoo packaging is cut by about 30%
                                    offering a refill option
                                          In general,         in the shopofout
                                                       the production        PE of
                                                                                anda 5PET
                                                                                       L tinplate canister
                                                                                            requires        (scenario
                                                                                                     less energy  than2).the
                                                                                                                           Refilling from of
                                                                                                                             production   a
                                    25 L  PE canister  (scenario   3) or selling 500  mL   PET  stand-up   pouches  (scenario
                                     glass and tinplate and at the same time leads to lower pollution due mining and metal       4) reduces
                                    the  overall environmental
                                     processing.  As a consequence,impact   even
                                                                         most      by about
                                                                               impact         70%. Most
                                                                                       indicators         of the reduction
                                                                                                   on midpoint    level show potential  can
                                                                                                                                a reduction
                                    be  explained
                                     between       by a50%
                                              20 and     lower
                                                             for energy
                                                                  scenariodemand    for the
                                                                            2 compared     topackaging
                                                                                              scenario 1,production,
                                                                                                          and an evenashigher
                                                                                                                           the production
                                                                                                                                  reduction
                                    of glass bottles turns out be as highly energy consuming, as described above. The high
                                    impact on resource use of mineral and metals is the main reason why the tinplate canister
                                    does not reach the same reduction potential as the other two refill options, as both GWP
                                    and use of mineral resources have a high weight withing the ecological scarcity method.

                                    3.3. Sensitivity Analysis Concerning Use Phase
                                        The use phase emerges as the dominant life phases of the investigated shampoo, the
                                    main driver for its environmental impact being heating of shower water with natural gas
                                    and oil.
Sustainability 2021, 13, x FOR PEER REVIEW                                                                                                  15 of 22

Sustainability 2021, 13, 8478                                                                                                              14 of 21
                                     Table 4. Average energy mix for heating water in Zurich [26] and in Switzerland [37].

                                                      Natural Gas Oil District Heating Heat Pump Wood Electricity Solar
                                          As the shampoo
                                         Zurich          49.9%is primarily
                                                                     27.2% sold on    a local basis in6.0%
                                                                                    15.8%              Zurich, the
                                                                                                                0.1%energy0.02%
                                                                                                                            mix of private
                                                                                                                                     0.02%
                                     households
                                      Switzerland  in Zurich
                                                         22.4%as  shown
                                                                     30.6%in Table  4 is
                                                                                     4.5%assumed   for heating
                                                                                                      8.4%     water.
                                                                                                                3,5%   The  Zurich
                                                                                                                          24.8%     energy
                                                                                                                                      4.8%
                                     mix is based roughly one half on natural gas and one third on oil, with smaller shares
                                     of heat  pumps
                                           Figure      and district
                                                   4 shows           heating of
                                                             the sensitivity   and  almost
                                                                                  the        negligibleimpact
                                                                                       environmental     shares of
                                                                                                                of the
                                                                                                                   wood,
                                                                                                                       use electricity, and
                                                                                                                            phase towards
                                     solar energy.   In comparison,     the  national   energy  mix  of Switzerland   is more
                                     the assumed energy mix. For the sensitivity study, the Zurich energy mix was replaced     diverse,  as
                                     also shown
                                     by the  Swissinenergy
                                                      Table 4,mix,
                                                                withwhile
                                                                     only maintaining
                                                                           one third of oil,  one quarter
                                                                                           shower          of natural
                                                                                                   water quantity   andgas, one quarteri.e.,
                                                                                                                         temperature,     of
                                     electricity, and  shares  from  4.5 to 8.5%
                                     keeping the energy consumption constant.      for all other energy  sources.
                                          Using the Swiss energy mix instead of the Zurich energy mix increases the overall
                                    Table 4. Average energy mix for heating water in Zurich [26] and in Switzerland [37].
                                     environmental impact by 20%. However, this increase is not caused by an increase in GWP
                                     but instead by strong
                                                       Naturalincreases in other    impact categories.
                                                                                District     Heat       In fact, the result for GWP
                                     shows a decrease ofGas12%, which                                  Wood
                                                                      Oilreflects the lower share of fossil fuels Electricity
                                                                                                                  in the SwissSolar
                                                                                                                                 energy
                                                                               Heating      Pump
                                     mix.Zurich
                                          For all other considered
                                                        49.9%
                                                                     midpoint indicators,
                                                                     27.2%       15.8%
                                                                                            an  increase0.1%
                                                                                             6.0%
                                                                                                         can be observed.
                                                                                                                    0.02%
                                                                                                                              The  much
                                                                                                                                0.02%
                                     higher  share
                                       Switzerland of electricity
                                                        22.4%     in the
                                                                     30.6%Swiss  energy
                                                                                 4.5%    mix  is
                                                                                             8.4%responsible
                                                                                                        3,5%  for  an  increase
                                                                                                                    24.8%        of
                                                                                                                                4.8%25%
                                     with respect to resource use of energy carriers, considering the high share of nuclear en-
                                     ergy in Switzerland. Imported electricity based on coal leads to significantly higher con-
                                          Figure 4 shows the sensitivity of the environmental impact of the use phase towards
                                     tributions to freshwater eutrophication, freshwater ecotoxicity, and human toxicity, the
                                     the assumed energy mix. For the sensitivity study, the Zurich energy mix was replaced
                                     Swiss energy mix reaching values about two to four times higher than the Zurich energy
                                     by the Swiss energy mix, while maintaining shower water quantity and temperature, i.e.,
                                     mix. The same increase can be seen for particulate matter and land use, the main driver in
                                     keeping the energy consumption constant.
                                     these cases being the higher share of wood in the Swiss energy mix.

       Figure4.4. Sensitivity
      Figure      Sensitivity of
                               of environmental
                                   environmental impact
                                                  impact ofof shampoo
                                                              shampoo towards
                                                                         towards thethe energy
                                                                                        energy mix
                                                                                                mix used
                                                                                                    used for
                                                                                                          for heating
                                                                                                              heating water
                                                                                                                       water for
                                                                                                                              for showering.
                                                                                                                                  showering.
      Results
       Results shown refer to the use phase only, not to the entire life cycle of the shampoo, and are based on IPCC2013
               shown    refer to  the use phase  only, not  to the entire  life cycle of the shampoo,   and  are  based on  IPCC    2013100a
                                                                                                                                         100a
      (GWP),  the   EF method   (resource  use, particulate matter, land  use,  freshwater  eutrophication), the  USEtox  method
       (GWP), the EF method (resource use, particulate matter, land use, freshwater eutrophication), the USEtox method includ-     including
      recommended
       ing recommended  andand
                             interim   characterization
                                  interim                factors
                                          characterization       (freshwater
                                                            factors (freshwater ecotoxicity, human
                                                                                   ecotoxicity, humantoxicity),
                                                                                                       toxicity),and
                                                                                                                  andthe
                                                                                                                      theecological
                                                                                                                          ecologicalscarcity
                                                                                                                                      scarcity
       method   (overall  environmental    impact).
      method (overall environmental impact).

                                          Using
                                           Given the
                                                   the Swiss  energy
                                                       high share   of mix   instead of
                                                                        fossil-based      the Zurich
                                                                                       heating        energy
                                                                                                in Zurich,     mix increases
                                                                                                            global  warming the      overall
                                                                                                                                is the main
                                     environmental    impact   by 20%.   However,    this increase is not caused   by an  increase
                                     contributor to the overall environmental impact of the use phase. The key parameter with       in GWP
                                     but instead
                                     respect        by strong
                                              to global        increases
                                                         warming     is thein  other demand
                                                                            energy    impact categories.
                                                                                               for heating In   fact,which
                                                                                                            water,    the result  for GWP
                                                                                                                             is determined
                                     shows
                                     by the aamount
                                               decreaseof of 12%, which
                                                          shower   water onreflects thehand
                                                                               the one  lowerand
                                                                                               share
                                                                                                   theofwater
                                                                                                         fossiltemperature,
                                                                                                                fuels in the Swiss   energy
                                                                                                                               or more  pre-
                                     mix.
                                     ciselyFor
                                            theallheat-up
                                                   other considered
                                                           interval, onmidpoint
                                                                         the otherindicators,  an increase
                                                                                     hand. In this  study, acan
                                                                                                             waterbe observed.
                                                                                                                     consumption Theof much
                                                                                                                                        15 L
                                     higher share of electricity in the Swiss energy mix is responsible for an increase of 25% with
                                     respect to resource use of energy carriers, considering the high share of nuclear energy in
Sustainability 2021, 13, 8478                                                                                                                 15 of 21

                                      Switzerland. Imported electricity based on coal leads to significantly higher contributions
                                      to freshwater eutrophication, freshwater ecotoxicity, and human toxicity, the Swiss energy
                                      mix reaching values about two to four times higher than the Zurich energy mix. The same
                                      increase can be seen for particulate matter and land use, the main driver in these cases
                                      being the higher share of wood in the Swiss energy mix.
                                            Given the high share of fossil-based heating in Zurich, global warming is the main
  Sustainability 2021, 13, x FOR PEER contributor
                                      REVIEW        to the overall environmental impact of the use phase. The key parameter with                16 of 22
                                      respect to global warming is the energy demand for heating water, which is determined
                                      by the amount of shower water on the one hand and the water temperature, or more
                                      precisely the heat-up interval, on the other hand. In this study, a water consumption of
                                     15and   a heat-up
                                          L and a heat-upinterval  of 23
                                                             interval  of °C
                                                                           23 is
                                                                              ◦ Cassumed.
                                                                                   is assumed. Within
                                                                                                  Withina sensitivity  study,
                                                                                                            a sensitivity       twotwo
                                                                                                                           study,     additional
                                                                                                                                          additionalwa-
                                        ter quantities   (10  L, 20 L)  as  well   as  two   additional    heat-up   intervals
                                     water quantities (10 L, 20 L) as well as two additional heat-up intervals (19 C, 27 C)       (19  °C,◦ 27 °C)◦  are
                                        considered.    Figure  5 shows    the  resulting    GWP    of  the use  phase   for all
                                      are considered. Figure 5 shows the resulting GWP of the use phase for all nine possible    nine  possible   com-
                                        binations, in each
                                      combinations,           casecase
                                                        in each     assuming
                                                                        assuming  the the
                                                                                        Zurich   energy
                                                                                            Zurich         mixmix
                                                                                                      energy    for for
                                                                                                                    heating   water.
                                                                                                                         heating         For For
                                                                                                                                    water.   the basic
                                                                                                                                                  the
                                        assumption     of 15  L  water  heated    up    by  23 °C, ◦the  shampoo     use
                                      basic assumption of 15 L water heated up by 23 C, the shampoo use phase is connectedphase    is connected     to a
                                        GWP    equivalent   to 100  gCO   2eq. The most climate friendly shower behavior of the consid-
                                      to a GWP equivalent to 100 g CO2 eq. The most climate friendly shower behavior of the
                                        ered casescases
                                      considered     (10 L(10
                                                           water,   heat-up
                                                               L water,        interval
                                                                          heat-up          19 °C)
                                                                                      interval  19 reduces   this value
                                                                                                    ◦ C) reduces          by 40%,
                                                                                                                  this value          while
                                                                                                                                by 40%,      the most
                                                                                                                                            while the
                                      most climate intensive shower behavior (20 L water, heat-up interval 27 C) leadsincrease
                                        climate  intensive   shower   behavior     (20  L water,  heat-up    interval  27 °C)   leads
                                                                                                                                    ◦   to an  to an
                                        of 60%.of 60%.
                                      increase

                                     Figure 5. Sensitivity of global warming potential (GWP) based on IPCC 2013 100a per hair wash
                                       Figure shower
                                     towards  5. Sensitivity
                                                      water of global and
                                                             quantity warming
                                                                          water potential (GWP)
                                                                                temperature.    based
                                                                                             Results   on IPCC
                                                                                                     shown  refer2013  100a
                                                                                                                  to the use per hair
                                                                                                                             phase    wash
                                                                                                                                   only.
                                       towards shower water quantity and water temperature. Results shown refer to the use phase only.
                                     4. Discussion
                                      4. Discussion
                                          In order to put the results of this study into context, limitations of the study, compari-
                                     son to In order to data,
                                            published   put the results
                                                              and       of this study
                                                                  possibilities       into context,
                                                                                to mitigate         limitations of
                                                                                            the environmental      the study,
                                                                                                                burden        compar-
                                                                                                                         of shampoo
                                      ison
                                     are   to published
                                         discussed  in thedata, and possibilities
                                                           following  sections. to mitigate the environmental burden of shampoo
                                      are discussed in the following sections.
                                     4.1. Considerations on Data Quality, Limitations and Research Recommendations
                                       4.1.Foreground
                                           Considerations     on was
                                                           data  Dataprovided
                                                                      Quality, Limitations    and Research
                                                                                 by the manufacturer          Recommendations
                                                                                                           regarding    shampoo ingredients,
                                     packaging   and    transportation,   energy   consumptions       at the
                                            Foreground data was provided by the manufacturer regarding shampoomanufacturing      site ingredients,
                                                                                                                                      and at the
                                     point  of sale,and
                                       packaging      building   sizes as well
                                                          transportation,        as production
                                                                            energy   consumptions  andat sales
                                                                                                           the volumes.     The quality
                                                                                                                manufacturing      site andofatthe
                                                                                                                                                 the
                                     foreground   data    is considered  high.   However,    the  following    limitations   and
                                       point of sale, building sizes as well as production and sales volumes. The quality of the   uncertainties
                                     must   be takendata
                                       foreground      intoisaccount  whenhigh.
                                                               considered     interpreting
                                                                                  However,  the  results
                                                                                               the         of this
                                                                                                    following      study.
                                                                                                                 limitations   and uncertainties
                                           A major   challenge   consisted  in modelling   the  ingredients
                                       must be taken into account when interpreting the results of this study. within  the life cycle inventory.
                                     Ecoinvent   −3.5challenge
                                            A major      datasets were    available
                                                                   consisted          for glycerin,
                                                                               in modelling            alcohol, and
                                                                                               the ingredients          citric
                                                                                                                   within   theacid.   All other
                                                                                                                                 life cycle inven-
                                     ingredients   except    essential oils were   modelled    using    datasets   of intermediate
                                       tory. Ecoinvent−3.5 datasets were available for glycerin, alcohol, and citric acid. All other   products,
                                     such  as glucose
                                       ingredients       for Propanediol
                                                     except                orwere
                                                               essential oils  sugarmodelled
                                                                                      beet molasse
                                                                                                 using and  fatty acid
                                                                                                          datasets       for Disodiumproducts,
                                                                                                                    of intermediate      Cocoyl
                                     Glutamate. In these cases, assumptions had to be made regarding yields and energy
                                       such as glucose for Propanediol or sugar beet molasse and fatty acid for Disodium Cocoyl
                                     consumption when converting intermediate products to final ingredients.
                                       Glutamate. In these cases, assumptions had to be made regarding yields and energy con-
                                       sumption when converting intermediate products to final ingredients.
                                            The investigated shampoo contained more than ten different types of essential oils.
                                       Due to the lack of data concerning cultivation and production processes, all essential oils
                                       were modelled using the life cycle inventory of orange oil production in Italy, as published
Sustainability 2021, 13, 8478                                                                                          16 of 21

                                     The investigated shampoo contained more than ten different types of essential oils.
                                Due to the lack of data concerning cultivation and production processes, all essential oils
                                were modelled using the life cycle inventory of orange oil production in Italy, as published
                                in [23]. This approach was justified as 60 wt% of the essential oils were citrus based.
                                However, it can be assumed that specific parameters such yields and energy consumption
                                for processing are not representable for the remaining 40 wt% of essential oils, which are
                                mainly based on flowers and spices.
                                     With respect to buildings, specific cubatures per kg shampoo produced and sold,
                                respectively, were derived from the foreground data. However, only a generic ecoinvent
                                dataset for multi-story buildings was used for modelling, applying the average lifespan
                                of 80 years used in the dataset. Furthermore, production and sales volumes fluctuate
                                over time. Consequently, contributions to the environmental impact connected to man-
                                ufacturing building and shop building can be expected to vary significantly depending
                                on the timeframe of the life cycle assessment. This is particularly important regarding
                                the manufacturing phase, where the building emerges as relevant parameter for various
                                impact categories.
                                     The use phase, which is found dominant regarding climate change and resource use of
                                energy carriers, is connected to high uncertainties as well. Here, the results strongly depend
                                on assumptions made concerning the consumers’ showering behavior as well as the energy
                                source used for heating water, as sensitivity studies carried out in this study show. In
                                addition, the reference flow itself is connected to high uncertainties. The amount of 9.5 g
                                shampoo per hair wash represents an average value for German consumers. However,
                                showering behavior and the actual amount of shampoo consumed for one hair wash are
                                a highly subjective as they depend on individual preferences and characteristics, such as
                                gender, age, hair length, and hair wash frequency [21,38].
                                     With respect to freshwater ecotoxicity and human toxicity, results shown in this study
                                are based on the USEtox method using both recommended and interim characterization
                                factors. While this approach is recommended by experts [39], it is important to keep in
                                mind that interim characterization factors do not fully meet the quality requirements of
                                the method and are associated with uncertainties. Even including interim characterization
                                factors, this study considers emissions of ingredient into water after wastewater treatment
                                only for a limited number of ingredients, as for many ingredients there are no character-
                                ization factors available. In these cases, it is not clear whether characterization factors
                                are still missing or whether they are not needed, as some ingredients might not of any
                                considerable toxic impact. Furthermore, generic assumptions on removal rates at the
                                wastewater treatment facility are taken from [4], as no specific removal rates are available.
                                In this sense, further research is recommended to obtain reliable characterization factors
                                and ingredient-specific removal rates in order to evaluate shampoo compositions with
                                respect to freshwater ecotoxicity.
                                     Finally, more LCA studies on personal care products should be carried out with
                                respect to different geographic areas as the results strongly depend on energy mixes used
                                for heating and for electricity. Regarding developing countries, household connectivity to
                                wastewater treatment and waste collection as well as treatment procedures are additional
                                relevant parameters that impact the contributions of the product and packaging end-of-life
                                phases to the environmental impact. Furthermore, personal care products produced and
                                sold outside Europe might contain ingredients with high health and environmental impact
                                that are not approved for the European market.

                                4.2. Comparison to Literature
                                    One of the most comprehensive LCA studies for shampoo was carried out by Cos-
                                metics Europe and Quantis [4,5]. The LCA was carried out in the frame of a screening
                                study to investigate the feasibility and relevance of establishing Product Environmental
                                Footprint Category Rules (PEFCR) for shampoo, following the guidelines from the Euro-
                                pean Commission’s Product Environmental Footprint (PEF) pilot phase [40]. The study
You can also read