Quarterly Update of Australia's National Greenhouse Gas Inventory: December 2020
←
→
Page content transcription
If your browser does not render page correctly, please read the page content below
Quarterly Update of Australia’s
National Greenhouse Gas
Inventory: December 2020
Incorporating emissions from the NEM up to March 2021

Australia’s National Greenhouse Accounts

Supporting economic growth and job creation for all Australians | industry.gov.au

© Commonwealth of Australia 2021

Ownership of intellectual property rights

Unless otherwise noted, copyright (and any other intellectual property rights, if any) in this
publication is owned by the Commonwealth of Australia.

Creative Commons licence

Attribution

CC BY

All material in this publication is licensed under a Creative Commons Attribution 4.0 International
Licence, save for content supplied by third parties, logos, any material protected by trademark or
otherwise noted in this publication, and the Commonwealth Coat of Arms.

Creative Commons Attribution 4.0 International Licence is a standard form licence agreement that
allows you to copy, distribute, transmit and adapt this publication provided you attribute the work.
A summary of the licence terms is available from https://creativecommons.org/licenses/by/4.0/

The full licence terms are available from https://creativecommons.org/licenses/by/4.0/legalcode

Content contained herein should be attributed as Quarterly Update of Australia’s National
Greenhouse Gas Inventory: December 2020, Australian Government Department of Industry, Science,
Energy and Resources.

Disclaimer
The Australian Government as represented by the Department of Industry, Science, Energy and
Resources has exercised due care and skill in the preparation and compilation of the information and
data in this publication. Notwithstanding, the Commonwealth of Australia, its officers, employees, or
agents disclaim any liability, including liability for negligence, loss howsoever caused, damage, injury,
expense or cost incurred by any person as a result of accessing, using or relying upon any of the
information or data in this publication to the maximum extent permitted by law. No representation
expressed or implied is made as to the currency, accuracy, reliability or completeness of the
information contained in this publication. The reader should rely on their own inquiries to
independently confirm the information and comment on which they intend to act. This publication
does not indicate commitment by the Australian Government to a particular course of action.

Quarterly Update of Australia’s National Greenhouse Gas Inventory: December 2020                       2

Preface
The Quarterly Update provides estimates of Australia’s national inventory of greenhouse gas
emissions up to the December quarter of 2020, and preliminary estimates of emissions for the
March quarter 2021.

Emissions for the year to December 2020 are estimated to be 499.0 Mt CO2-e, down 5.0 per cent or
26.1 Mt CO2-e on the previous year. This decline in emissions reflects events and activities in several
sectors:

               •              Ongoing reductions in emissions from electricity (down 4.9 per cent);
               •              Fugitive emissions down 8.8 per cent due, in part, to a reduction in coal production and
                              increases in Gorgon’s carbon capture and storage; and
               •              The continuing but short term effects of COVID restrictions on emissions from transport,
                              which fell 12.1 per cent.

Since their peak in the year to June 2007, Australia’s greenhouse gas emissions have declined
22.6 per cent. The emissions in the year to December 2020 are the lowest levels recorded in the
National Inventory and were 20.1 per cent below emissions for the year to June 2005 (Figure P1).

Figure P1: Emissions1, by quarter, December 2000 to December 2020 (including preliminary March
2021)

                            170

                            160

                            150
     Emissions (Mt CO2-e)

                            140

                            130

                            120

                            110

                            100

                              90

                                                                                Actual emissions                  Trend

Source: Department of Industry, Science, Energy and Resources

On a quarterly basis, national emission levels2 for the December quarter 2020 decreased 0.1 per
cent or 0.1 Mt CO2-e on the previous quarter, in trend terms. On a seasonally adjusted and weather
normalised basis, there were continuing signs of recovery in activity and emissions despite an overall

1 ‘Actual’,                 ‘seasonally adjusted, ‘weather normalised’ and ‘trend’ are defined in Section 5 - Technical notes
2   National emissions levels are inclusive of all sectors of the economy, including Land Use, Land use Change and Forestry (LULUCF) and includes the
    application of the IPCC’s natural disturbance provision.

Quarterly Update of Australia’s National Greenhouse Gas Inventory: December 2020                                                                        3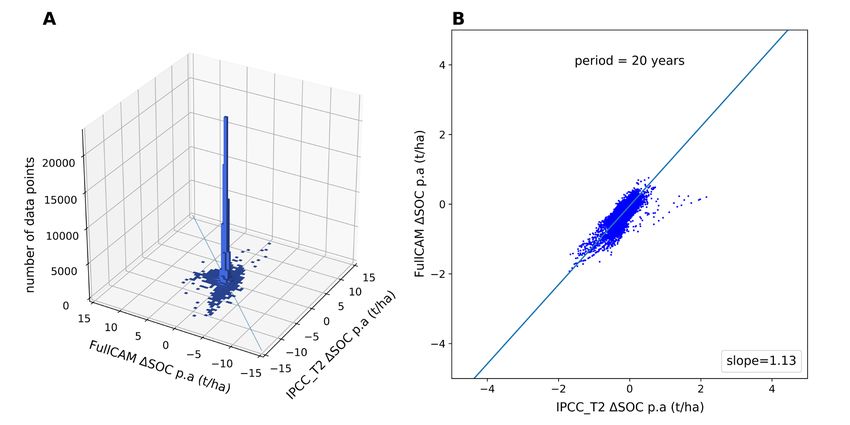
decrease (0.6 per cent); Transport emissions increased 6.2 per cent, continuing its recovery from the
deepest impacts of COVID-related restrictions.

In the year to December 2020, emissions per capita and the emissions intensity of the economy
were at their lowest levels in 31 years. Emissions per capita were lower than 1990 by 46.7 per cent
while the emissions intensity of the economy was 66.1 per cent lower than in 1990.

In the March quarter, emissions from the National Electricity Market (NEM) decreased 2.7 per cent
on a seasonally adjusted and weather normalised basis compared with the previous quarter and
were 5.6 per cent lower over the year to March 2021 compared with the same period in 2020.

Overall, national emissions are preliminarily estimated to be 495 Mt CO2-e in the year to March
2021, a decrease of 5 per cent on the previous year.

On an annual basis, the consumption-based inventory decreased 2.7 per cent or 11.5 Mt CO2-e to
419.6 Mt CO2 e in the year to December 2020. Emissions associated with production of exports
declined by 15.3 Mt CO2 e (down 6.4 per cent) to 224.5 Mt CO2-e and emissions associated with
consumption of imports declined by 0.6 Mt CO2 e (down 0.4 per cent) 145.1 Mt CO2-e.

Quarterly Update of Australia’s National Greenhouse Gas Inventory: December 2020                      4
Contents
Preface .............................................................................................................................................. 3
1.     Overview ................................................................................................................................... 6
2.     Sectoral Analysis ...................................................................................................................... 11
     2.1.    Energy – Electricity ............................................................................................................ 11
     2.2.    Energy – Stationary energy excluding electricity ................................................................ 13
     2.3.    Energy – Transport ............................................................................................................ 14
     2.4.    Energy – Fugitive emissions ............................................................................................... 16
     2.5.    Industrial processes and product use ................................................................................. 17
     2.6.    Agriculture ........................................................................................................................ 18
     2.7.    Waste ................................................................................................................................ 19
     2.8.    Land Use, Land Use Change and Forestry ........................................................................... 20
3.     Emissions per capita and per dollar of GDP .............................................................................. 21
4.     Consumption-based national greenhouse gas inventory .......................................................... 23
Special Topic – Reporting soil carbon emissions and sequestration .................................................. 26
5.     Technical notes ........................................................................................................................ 34
6.     Data tables .............................................................................................................................. 44
7.     Related publications and resources.......................................................................................... 62

Quarterly Update of Australia’s National Greenhouse Gas Inventory: December 2020                                                                      5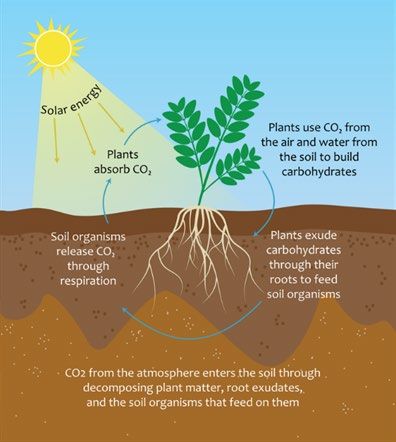
1. Overview
Table 1: National Greenhouse Gas Inventory 3, December quarter 2020, rates of change

                                                                                                                 December               Year to December
                                                                                                                quarter 2020                  2020

    Quarterly change – seasonally adjusted and weather normalised4                                                  -0.6%

    Quarterly change – seasonally adjusted and weather normalised – trend4                                          -0.1%

    Annual Change                                                                                                                               -5.0%

Table 2: National Electricity Market (NEM) 5, March quarter 2021, rates of change
                                                                                                                March quarter              Year to March
                                                                                                                    2021                       2021

    Quarterly change – seasonally adjusted and weather normalised4                                                   -2.7%

    Quarterly change – seasonally adjusted and weather normalised – trend4                                           -2.5%

    Annual Change                                                                                                                                -5.6%

Summary of emissions in the December quarter 2020
National emissions for the December quarter 2020 decreased 0.1 per cent or 0.1 Mt CO2-e on the
previous quarter in trend terms. This decrease is not as marked as the decrease in the September
2020 quarter, mainly reflecting an increase in transport emissions, with an easing of COVID travel
restrictions. On a seasonally adjusted and weather normalised basis, emissions were lower by 0.6
per cent or 0.7 Mt CO2-e on the previous quarter, where milder than normal temperatures and the
continuing shift towards renewable generation offset increases in transport activty. (Figure
1 and Figure 2). While transport emissions increased by 6.2 per cent or 1.3 Mt CO2-e, this was offset
by decreased emissions in the electricity sector (3.6 per cent or 1.5 Mt CO2-e), fugitives sector (4.6
per cent or 0.6 Mt CO2-e), and the Agriculture sector (0.8 per cent or 0.2 Mt CO2-e).

3   National emissions levels are inclusive of all sectors of the economy, including Land Use, Land Use Change and Forestry (LULUCF).
4   ‘Actual’, ‘seasonally adjusted, weather normalised’ and ‘trend’ are defined in Section 5: Technical notes
5 The NEM includes grid electricity in the Eastern and South Eastern states and accounts for approximately 83 per cent of total electricity estimates in the year

to December 2020.

Quarterly Update of Australia’s National Greenhouse Gas Inventory: December 2020                                                                               6
Figure 1: Emissions6, by quarter, December 2010 to December 2020
                                     160

                                     150
     Emissions (Mt CO2-e)

                                     140

                                     130

                                     120

                                           Actual emissions       Seasonally adjusted and weather normalised           Trend

Source: Department of Industry, Science, Energy and Resources

Figure 2: Change in emissions, by quarter, December 2010 to December 2020
                                    4%

                                    2%
Quarterly change in emissions (%)

                                    0%

                                    -2%

                                    -4%

                                    -6%

                                    -8%

                                                      Seasonally adjusted and weather normalised               Trend

Source: Department of Industry, Science, Energy and Resources

6       ‘Seasonally adjusted’, ‘weather normalised’, and ‘trend’ are defined in Section 5: Technical notes

Quarterly Update of Australia’s National Greenhouse Gas Inventory: December 2020                                               7
Summary of carbon dioxide emissions
Carbon dioxide contributes the largest share of aggregate emissions in Australia at around 68 per
cent of total emissions.

Since the peak in September 2006, there has been a 27.5 per cent or 31.7 Mt decline in emissions of
carbon dioxide to 83.6 Mt in December 2020 (Figure 3). The most important factors causing this long
term decline in carbon dioxide emissions include the continuing shift in the generation of electricity
towards renewable fuel sources, and away from coal, and decreasing emissions in the land sector.

Against these downward forces, the long term growth of emissions from transport activity and the
expansion of LNG exports has placed upward pressure on this time series.

Figure 3: CO2 Emissions, by quarter, December 1999 to December 2020

                     130
                     125
                     120
                     115
Emissions (Mt CO2)

                     110
                     105
                     100
                      95
                      90
                      85
                      80

Source: Department of Industry, Science, Energy and Resources

Quarterly Update of Australia’s National Greenhouse Gas Inventory: December 2020                     8
Summary of annual GHG emissions
Emissions for the year to December 2020 are estimated to be 499.0 Mt CO2-e. The 5.0 per cent or
26.1 Mt CO2-e decrease in emissions over the year to December reflects annual decreases in
emissions from the electricity, transport, fugitives, industrial processes, and waste sectors. These
decreases in emissions were partially offset by increases in emissions from the stationary energy
(excluding electricity) and land use, land use change and forestry sectors (Table 3).

Table 3: ‘Actual’ annual emissions, by sector, for the year to December 2019 and 2020
                                                                                    Annual emissions (Mt CO2-e)

 Sector                                                                             Year to              Year to         Change (%)
                                                                                 December 2019        December 2020

 Energy – Electricity                                                                 176.2                  167.5          -4.9

 Energy – Stationary energy excluding electricity                                     101.5                  101.7          0.2

 Energy – Transport                                                                    99.8                  87.8          -12.1

 Energy – Fugitive emissions                                                           54.5                  49.7           -8.8

 Industrial processes and product use                                                  31.5                  30.7           -2.4

 Agriculture                                                                           72.9                  72.9           0.0

 Waste                                                                                 13.5                  13.3           -1.7

 Land Use, Land Use Change and Forestry                                                -24.8                 -24.5          1.0

 National Inventory Total                                                             525.1                  499.0          -5.0

Figure 4: Share of total emissions, by sector, for the year to December 2020

  40%
           Electricity
  35%        33.6%

  30%
                          Stationary energy
                         excluding electricity
  25%
                                20.4%
                                                 Transport
  20%                                              17.6%                                       Agriculture
                                                                                                 14.6%
  15%
                                                             Fugitive emissions Industrial
                                                                   10.0%       processes and
  10%                                                                           product use
                                                                                   6.2%                          Waste
   5%                                                                                                            2.7%

   0%

   -5%
                                                                                                                           LULUCF
  -10%                                                                                                                      -4.9%

Source: Department of Industry, Science, Energy and Resources

Over the year to December 2020 the 4.9 per cent decrease in emissions from the electricity sector
was mainly due to a 4.4 per cent reduction in coal generation, a 19.4 per cent reduction in gas

Quarterly Update of Australia’s National Greenhouse Gas Inventory: December 2020                                                      9
generation and a corresponding 13.5 per cent increase in supply from renewable sources in the
NEM.
Transport emissions decreased 12.1 per cent over the year to December reflecting an 11.5 per cent
decrease in petrol consumption and a 50.9 per cent decrease in domestic jet fuel consumption
related to the COVID restrictions on movement.
Emissions from the agriculture sector were flat in the year to December (72.9 Mt CO2-e), reflecting
improving conditions after the drought.
Emissions from total export industries decreased 6.4 per cent (15.2 Mt CO2-e). This decrease
occurred despite an increase LNG exports, up 1.4 per cent to 78.1 Mt of liquefied gas. Net fugitive
emissions from LNG production declined over the same period due to reduced levels of venting and
flaring. Lower emissions associated with LNG production and lower coal and agriculture exports
drove much of the trend in export industries emissions.
In the year to March 2021, the preliminary estimate for total emissions is 495 Mt CO2-e. This would
be a decline of 5 per cent or 27 Mt CO2-e on the year to March 2020.
Long term sectoral trends
The most important sectoral drivers of Australia’s long-term emissions trend have been:
• Electricity – where emissions have fallen by 20.9 per cent since June 2009, as renewables
have displaced coal as a fuel source, reversing the long term increases experienced in earlier
years;
• Stationary energy (excluding electricity) – where emissions experienced the largest increase
in percentage terms since 1990. Emissions have increased 52.3 per cent or 34.9 Mt CO2-e
driven, in particular, by recent growth in the export of LNG;
• Transport - where emissions have increased 43.0 per cent or 26.4 Mt CO2-e since 1990,
despite recent volatility due to the impacts of the COVID pandemic;
• Fugitives – where emissions have increased 27.2 per cent or 10.6 Mt CO2-e since 1990.
Emissions were relatively stable until 2015 but have increased strongly as a result of the
growth of the LNG industry;
• Agriculture – where emissions have declined by 20.4 per cent or 18.7 Mt CO2-e since 1990, in
line with declining cattle and sheep populations; and,
• Land Use, Land Use Change and Forestry (LULUCF) – where emissions have decreased by the
largest margin of any sector since 1990 (113.2 per cent or 210.6 Mt CO2-e) due to reductions
in land clearing and native forest harvesting and improvements in soil carbon.
The changes in emissions from each sector from the year to June 1990 to 2020 in percentage terms
are presented in Figure 5.
Quarterly Update of Australia’s National Greenhouse Gas Inventory: December 2020 10Figure 5: Percentage change in emissions, by sector, since year to December 1990
80% Electricity
60%
Per cent change in emissions on 1990 (%)
Stationary energy
40% excluding
electricity
20% Transport
0%
-20% Fugitive
emissions
-40%
Industrial
-60% processes and
product use
-80% Agriculture
-100%
Waste
-120%
-140%
LULUCF
Source: Department of Industry, Science, Energy and Resources
2. Sectoral Analysis
2.1. Energy – Electricity
Electricity generation is the largest source of emissions in the national inventory, accounting for
33.6 per cent of emissions in the year to December 2020 (Figure 4).
Electricity sector emissions are experiencing a long term decline, down 20.9 per cent (44.2 Mt CO2-e)
from the peak recorded in the year to June 2009 (Data Table 1A).
Electricity sector emissions decreased 3.6 per cent in the December quarter of 2020 on a seasonally
adjusted and weather normalised basis 7 (Figure 6). This reflected a 4.4 per cent decline in coal
generation and a consequent increase of 16.1 per cent in renewable generation. Mild conditions
during the December quarter 2020 also saw metered demand in the NEM lower by 2.9 per cent than
in the December quarter 2019.
Over the course of the whole year to December 2020, emissions from electricity decreased
4.9 per cent compared with the year to December 2019, due to the ongoing substitution of
renewable energy sources for coal-fired power.
7 Two adjustments are made:
a) Seasonal adjustment is a first-order adjustment using Eurostat software that systematically corrects emissions data for average fluctuations in
seasonal conditions which, for example, controls for the effects of two seasonal peaks in electricity demand: one in winter (associated with demand
for heating) and one in summer (associated with demand for cooling); and
b) Weather normalisation is a second-order adjustment that systematically corrects emissions data for atypical temperature effects on electricity
demand within the year which, for example, controls for the effects of unusually cold winters or unusually hot summers.
The weather normalisation methodology is described in detail in ‘Section 7: Special Topic’ of the December 2011 Quarterly Update
Quarterly Update of Australia’s National Greenhouse Gas Inventory: December 2020 11Figure 6: Electricity sector emissions, by quarter, December 2010 to December 2020
56
54
Emissions (Mt CO2-e)
52
50
48
46
44
42
40
38
Actual emissions Seasonally adjusted and weather normalised emissions
Source: Department of Industry, Science, Energy and Resources, Australian Energy Market Operator (AEMO, 2021), obtained using NEM-
Review software
National Electricity Market (NEM) emissions
Emissions in the NEM for the March quarter 2021 decreased 2.7 per cent on a seasonally adjusted
and weather normalised basis compared with the previous quarter (Figure 7).
Figure 7: NEM electricity emissions, by quarter, March 2010 to March 2021
48
46
44
Emissions (Mt CO2-e)
42
40
38
36
34
32
30
Actual emissions Seasonally adjusted and weather normalised emissions
Source: Department of Industry, Science, Energy and Resources, Australian Energy Market Operator (AEMO, 2021), obtained using NEM-
Review software
Quarterly Update of Australia’s National Greenhouse Gas Inventory: December 2020 12For the March 2021 quarter, generation from renewables increased 8.5 per cent in trend terms
(Figure 8). This was due to increases in wind, hydro and solar generation.
Figure 8: Cumulative change in electricity generation in the NEM, trend, by fuel, by quarter, March
2010 to March 2021
6
4
2
Electricity Generation (TWh)
Coal
0
-2 Gas
-4
Wind
-6
-8 Hydro
-10
Solar
-12
Source: Department of Industry, Science, Energy and Resources, Australian Energy Market Operator (AEMO, 2021), obtained using NEM-
Review software
2.2. Energy – Stationary energy excluding
electricity
Stationary energy excluding electricity includes emissions from direct combustion of fuels,
predominantly from the manufacturing, mining, residential and commercial sub-sectors.
In the year to December 2020, stationary energy excluding electricity accounted for 20.4 per cent of
Australia’s national inventory (Figure 4).
Emissions from stationary energy excluding electricity in the December quarter of 2020 decreased
0.7 per cent (0.2 Mt CO2-e) in trend terms compared with the September quarter. Emissions over the
year to December 2020, increased 0.2 per cent in trend terms when compared with the previous
year (Figure 9) reflecting, in part, an increase in LNG exports in the year to December 2020 (Figure
10).
Quarterly Update of Australia’s National Greenhouse Gas Inventory: December 2020 13Figure 9: Stationary energy excluding electricity emissions, actual and trend, by quarter, December
2010 to December 2020
34
29
Emissions (Mt CO2-e)
24
19
14
9
4
Stationary energy excluding electricity - Actual Stationary energy excluding electricity - Trend
Source: Department of Industry, Science, Energy and Resources
Figure 10: LNG exports, by quarter, December 2010 to December 2020
20
15
Exports (Million tonnes)
10
5
0
Source: Department of Industry, Science, Energy and Resources
2.3. Energy – Transport
The transport sector includes emissions from the direct combustion of fuels in transportation by
road, rail, domestic aviation and domestic shipping. The main fuels used for transport are
automotive gasoline (petrol), diesel oil, liquefied petroleum gas (LPG) and aviation turbine fuel.
In the year to December 2020, transport accounted for 17.6 per cent of Australia’s national
inventory (Figure 4).
Quarterly Update of Australia’s National Greenhouse Gas Inventory: December 2020 14Emissions in the December 2020 quarter increased 11.1 per cent in actual terms on the September
quarter 2020 recovering some of the declines experienced in the March and June quarters (Figure
11). This result reflects some degree of a return towards normal levels of transport activity following
the most severe impacts from the restrictions on movement imposed in the June quarter 2020.
Emissions from transport over the year to December 2020 decreased 12.1 per cent when compared
with the previous year. This decline in transport emissions was partly the result of an 11.5 per cent
annual decline in petrol consumption associated with the impacts of the COVID pandemic. In
contast, diesel consumption declined by 0.8 per cent over the same period (Figure 12).
Figure 11: Transport emissions, actual and trend, by quarter, December 2010 to December 2020
28
27
26
Emissions (Mt CO2-e)
25
24
23
22
21
20
19
18
Transport - actual Transport - Trend
Source: Department of Industry, Science, Energy and Resources
Quarterly Update of Australia’s National Greenhouse Gas Inventory: December 2020 15Figure 12: Consumption of primary liquid fuels, actual and trend, by quarter, December 2010 to
December 2020
8000
7500
7000
6500
Million Litres
6000
5500
5000
4500
4000
3500
3000
Petrol Diesel Petrol - Trend Diesel - Trend
Source: Department of Industry, Science, Energy and Resources
2.4. Energy – Fugitive emissions
Fugitive emissions occur during the production, processing, transport, storage, transmission and
distribution of fossil fuels. These include coal, crude oil and natural gas. Emissions from
decommissioned underground coal mines are also included in this sector.
Fugitive emissions in the December quarter decreased by 4.6 per cent in trend terms.
Total gas production was unchanged in the December 2020 quarter, while LNG exports increased
11.9 per cent. Underground carbon dioxide injection from the Gorgon project and reduced levels of
flaring acted to reduce fugitive emissions from the crude oil and natural gas sub-sector. Coal
production declined by 5.0 per cent in the December 2020 quarter, contributing to the overall
decrease in fugitive emissions.
Annual emissions in this sector decreased 8.8 per cent over the year to December 2020 (Figure 13).
Quarterly Update of Australia’s National Greenhouse Gas Inventory: December 2020 16Figure 13: Fugitive emissions, actual and trend, by sub-sector, by quarter December 2010 to
December 2020
10
8
Emissions (Mt CO2-e)
6
4
2
Coal - actual emissions Crude oil and natural gas - actual emissions
Coal - trend Crude oil and natural gas - trend
Source: Department of Industry, Science, Energy and Resources
2.5. Industrial processes and product use
Emissions from industrial processes and product use occur as the result of by-products of materials
and reactions used in production processes. This sector includes emissions from processes used to
produce chemical, metal, and mineral products. It also includes emissions from the consumption of
synthetic gases.
In the year to December 2020, industrial processes and product use accounted for 6.2 per cent of
Australia’s national inventory (Figure 4). Emissions declined 2.4 percent or 0.8 Mt CO2-e over the
year to December 2020 (Figure 14) mainly reflecting declines in emissions from the metals sector.
Trend emissions for industrial processes and product use increased 1.8 per cent in the December
quarter on the previous quarter.
Quarterly Update of Australia’s National Greenhouse Gas Inventory: December 2020 17Figure 14: Industrial processes and product use emissions, actual, by sub-sector, by quarter,
December 2010 to December 2020
4.0 Chemical
industry
3.5
3.0
Products
substituted for
Emissions (Mt CO2-e)
2.5 Ozone Depleting
Substances
2.0
Metal industry
1.5
1.0
Mineral industry
0.5
0.0
Other production
and lubricant use
Source: Department of Industry, Science, Energy and Resources
2.6. Agriculture
Emissions from agriculture include methane, nitrous oxide and carbon dioxide. Methane and nitrous
oxide emissions are estimated for enteric fermentation and manure management in livestock. They
are also estimated for rice cultivation, agricultural soils and field burning of agricultural residues.
Carbon dioxide emissions are reported from the application of urea and lime.
In the year to December 2020, agriculture accounted for 14.6 per cent of Australia’s national
inventory (Figure 4). Emissions from agriculture have remained unchanged at 72.9 Mt CO2-e over the
year to December 2020 (Figure 15).
Quarterly Update of Australia’s National Greenhouse Gas Inventory: December 2020 18Figure 15: Agriculture emissions, trend, by quarter, December 2010 to December 2020 8
24
22
Emissions (Mt CO2-e)
20
18
16
14
12
10
8
Source: Department of Industry, Science, Energy and Resources
Drought conditions have eased in the December quarter 2020. More favourable seasonal conditions
have led to herd and flock rebuilding, however, livestock population numbers are yet to fully
recover 9. There has been some rebound in crop production in the December quarter 2020 due to
more favourable climatic conditions. Emissions from crop production should continue to increase in
future quarters, with wheat production forecast to rebound strongly 10.
2.7. Waste
The waste sector includes emissions from landfills, wastewater treatment, waste incineration and
the biological treatment of solid waste. Emissions largely consist of methane, which is generated
when organic matter decays under anaerobic conditions.
In the year to December 2020, waste accounted for 2.7 per cent of Australia’s national inventory
(Figure 4).
Emissions from waste decreased 1.7 per cent (0.2 Mt CO2-e) over the year to December 2020 due to
increased gas capture at solid waste disposal sites (Figure 16).
8 The nature of the data underpinning the agriculture estimates creates an anomaly in the actual quarterly data which is managed through seasonal
adjustment and weather normalisation (Data Tables 1B and 1C).
9 Australian Bureau of Agricultural and Resource Economics and Sciences (2021). Agricultural Commodities Report, March 2021.
10 Australian Bureau of Agricultural and Resource Economics and Sciences (2021). Australian Crop Report, March 2021.
Quarterly Update of Australia’s National Greenhouse Gas Inventory: December 2020 19Figure 16: Waste emissions, actual, by sub-sector, by quarter, December 2010 to December 2020
4.0
3.5
3.0
Emissions (Mt CO2-e)
2.5
2.0
1.5
1.0
0.5
0.0
Solid waste disposal on land Wastewater handling Waste incineration and biological treatment of solid waste
Source: Department of Industry, Science, Energy and Resources
2.8. Land Use, Land Use Change and Forestry
The Land Use, Land Use Change and Forestry (LULUCF) sector of the national inventory includes
estimates of net anthropogenic emissions for forests and agricultural lands and changes in land use.
In the year to December 2020, the LULUCF sector 11 accounted for -4.9 per cent of Australia’s
national inventory – a net sink (Figure 4).
Net emissions for the LULUCF sector in the year to December 2020 are estimated to be -24.5 Mt
CO2-e (Figure 17). This net sink has declined by 1.0 per cent (0.2 Mt CO2-e) on the previous twelve
months due to an increase in emissions from agricultural soil, partially offset by a continuing decline
in land clearing emissions (Figure 17).
11 LULUCF includes Forest converted to other uses, Forest land remaining forest land, Land converted to forest land, Grassland remaining grassland (including
Wetlands and Settlements) and Cropland remaining cropland.
Quarterly Update of Australia’s National Greenhouse Gas Inventory: December 2020 20Figure 17: LULUCF net anthropogenic emissions, by sub-sector, year to December, 1990 to 2020
200
Forest land
remaining forest
land
150
Cropland remaining
100
Emissions (Mt CO2-e)
cropland
50
Grassland remaining
grassland (including
Wetlands and
0 Settlements)
Land converted to
forest
-50
-100 Forest converted to
other uses
Year to December
Source: Department of Industry, Science, Energy and Resources
3. Emissions per capita and per dollar of GDP
In the year to December 2020 emissions per capita, and the emissions intensity of the economy are
at their lowest levels in 31 years 12.
National inventory emissions per capita were 19.4 t CO2-e per person in the year to December 2020.
This represents a 46.7 per cent decline in national inventory emissions per capita from 36.4 t CO2-e
per person in the year to December 1990.
Over the period from 1989-90 to December 2020, Australia’s population grew strongly from 17.2
million to around 25.7 million13,14. This represents a growth of 49.8 per cent.
Australia’s real GDP (chain volume measures) also experienced significant growth over this period,
expanding from $0.8 trillion in 1990 to around $1.9 trillion in the year to December 2020 15. This
represents a growth of 136.7 per cent.
National inventory emissions per dollar of real GDP fell from 0.8 kg CO2-e per dollar in the year to
December 1990 to 0.3 kg CO2-e per dollar in the year to December 2020 (Figure 18). This represents
a decline of 66.1 per cent from the year to December 1990.
12Emissions per capita and per dollar of real GDP levels are inclusive of all sectors of the economy, including Land Use, Land Use Change and Forestry
(LULUCF)
13 Australian Bureau of Statistics (2021), Australian Demographic Statistics, pub. no. 3101 http://www.abs.gov.au/ausstats/abs@.nsf/mf/3101.0
14 Australian Bureau of Statistics (2021), Population Clock. http://www.abs.gov.au/AUSSTATS/abs@.nsf/Web+Pages/Population+Clock
15Australian Bureau of Statistics (2021), National Accounts: National Income, Expenditure and Product, Cat. No. 5206.0
http://www.abs.gov.au/ausstats/abs@.nsf/mf/5206.0
Quarterly Update of Australia’s National Greenhouse Gas Inventory: December 2020 21Figure 18: Emissions per capita and per dollar of real GDP, actual year to December 1990 to 2020
0.80
36
34 0.75
32 0.70
30 0.65
kg CO2-e per $ of real GDP
28 0.60
t CO2-e per person
26
0.55
24
22 0.50
20 0.45
18 0.40
16
0.35
14
0.30
12
10 0.25
8 0.20
Year to December
Emissions per capita Emissions per dollar of real GDP
Source: Department of Industry, Science, Energy and Resources
Quarterly Update of Australia’s National Greenhouse Gas Inventory: December 2020 224. Consumption-based national greenhouse
gas inventory
Table 4: Consumption-based national greenhouse gas inventory 16, December quarter and year to
December 2020, emissions growth rates
December quarter Year to December
2020 2020
Quarterly change – seasonally adjusted 17 -1.5%
Quarterly change – seasonally adjusted– trend 0.3%
Annual Change -2.7%
The consumption account estimates the impacts on emissions in Australia and in other countries due
to Australian consumption or demand.
On an annual basis, the consumption-based inventory decreased 2.7 per cent or 11.5 Mt CO2-e to
419.6 Mt CO2 e in the year to December 2020, largely as a result of a 26.2 Mt CO2 e decline in
national greenhouse gas inventory emissions (down 5.0 per cent). Emissions associated with
production of exports declined by 15.3 Mt CO2 e (down 6.4 per cent) and emissions associated with
consumption of imports declined by only 0.6 Mt CO2 e (down 0.4 per cent).
Emissions in the national greenhouse gas inventory associated with the production of goods for
export are not included in the consumption-based inventory. The national greenhouse gas inventory
is increasingly driven by producing goods for exports. After deducting these emissions, national
greenhouse gas inventory emissions that are associated with domestic consumption declined by 3.9
per cent (12.5 Mt CO2-e).
Household consumption was the most significant contributor to the consumption-based inventory at
307.7 Mt CO2-e (or 73.3 per cent of total consumption emissions), followed by private fixed capital
formation at 85.9 Mt CO2-e (or 20.5 per cent of total consumption emissions). Combining
consumption emissions from final government consumption and gross fixed capital formation from
government and public corporations, the government sector was responsible for emissions of 63.9
Mt CO2-e (or 15.2 per cent of consumption-based emissions across the economy) (Table 5).
Emissions generated by Australian consumption are 139.5 Mt CO2-e or 24.9 per cent lower
compared to the year to June 2005. The analysis also shows that the emissions generated to support
Australia’s consumption are less than those reported as the (production-based) national greenhouse
gas inventory by 79.3 Mt CO2-e or 15.9 per cent in the year to December 2020 (Figure 19).
On a seasonally adjusted basis, Australia’s consumption-based inventory was lower relative to the
previous quarter (1.5 per cent or 1.6 Mt CO2-e).
16 National emissions levels are inclusive of all sectors of the economy, including Land Use, Land Use Change and Forestry (LULUCF).
17 ‘Actual’, ‘seasonally adjusted and ‘trend’ are defined in Section 5: Technical notes
Quarterly Update of Australia’s National Greenhouse Gas Inventory: December 2020 23Consumption-based emissions are approximately 16.3 tonnes per person per year, which is around
3.1 tonnes per person less than the per capita emission calculation using the national greenhouse
gas inventory.
Table 5: Consumption-based national greenhouse gas inventory, year to December 2020, by sector
Consumption-based inventory sector Year to December
2020
Household consumption 307.7
Government consumption 41.0
Fixed capital – Government & Public corporations 23.0
Private fixed capital 85.9
Change in inventoriesa -37.8
Total consumption-based inventory 419.6
a. Includes carbon sequestered in forests and plantations available to be utilised in wood and paper production in the future.
Figure 19: National Greenhouse Gas and Consumption-based inventories, Australia, by quarter,
December 2005 to December 2020
Source: Department of Industry, Science, Energy and Resources
Quarterly Update of Australia’s National Greenhouse Gas Inventory: December 2020 24Figure 20: Global emissions generated during production of Australia’s imports and exports, by
quarter, December 1990 to December 2020
70
60
50
40
Emissions (Mt CO2-e)
30
20
10
0
Emissions generated by imports Emissions generated by exports Emissions generated by imports (trend)
Emissions generated by exports (trend) Emissions in Australia from production of exports
Source: Department of Industry, Science, Energy and Resources
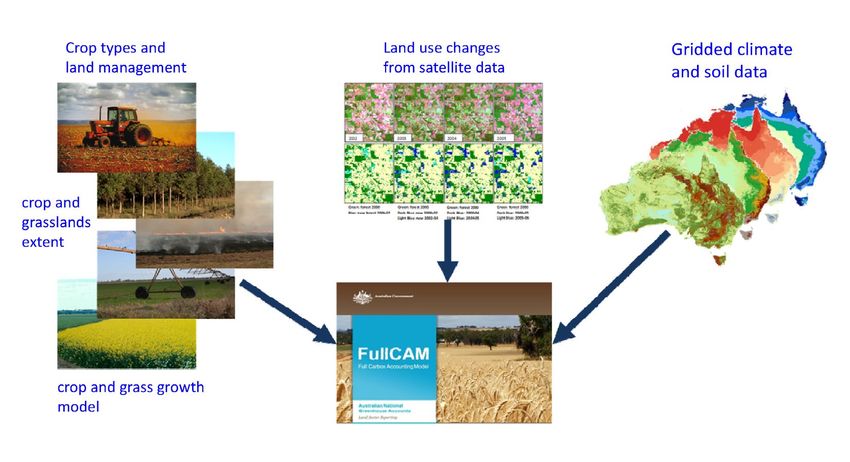
Quarterly Update of Australia’s National Greenhouse Gas Inventory: December 2020 25Special Topic – Reporting soil carbon emissions and sequestration Summary The Government’s First Low Emissions Technology Statement 2020 18 identifies improvements to soil carbon as an opportunity to enhance national abatement efforts. The Department of Industry, Science, Energy and Resources (the department) is well-placed to monitor these enhanced efforts to improve national soil carbon levels and report them in the national greenhouse gas inventory (National Inventory). This Special Topic provides a brief introduction to soil carbon, how changes are estimated and reported in Australia’s National Inventory consistent with international guidelines and requirements, and work underway to further improve Australia’s world class Full Carbon Accounting Model (FullCAM) used to estimate such changes in the National Inventory. Australia’s soils store around 25 billion tonnes of organic carbon, which varies from year to year depending on climate and land management activities such as cropping and grazing. These changes have the potential to make a significant contribution to national abatement efforts, and are reported in Australia’s National Inventory. The National Inventory fulfils Australia’s emission reporting obligations under the UN climate treaties and provides the basis for tracking Australia’s progress towards its Paris Agreement 2030 target. Changes in soil carbon over all lands are estimated using the national inventory system’s FullCAM. FullCAM is a leading example of integrated vegetation and soil carbon stock models, drawing on detailed inputs of climate, soil type and land use. It has maintained this status through ongoing review and improvement programs. Originally supported through the commissioning of around 40 scientific reports, FullCAM has since been continuously calibrated and improved using studies of Australian soils and land use activities. It has also been subject to many rigorous domestic and international reviews, including fifteen UNFCCC audits by teams of international experts and two Australian National Audit Office reviews. Growing interest in increasing soil carbon to help meet Australia’s international emission reduction targets lends further importance to current and future work to further improve ways of measuring soil carbon and precisely estimating changes in the National Inventory. What is soil organic carbon? Soil organic carbon (SOC) is the carbon component of soil organic matter (SOM), which is the debris and chemical remains of organic material contained within soil. SOM is composed mainly of carbon, hydrogen and oxygen, and has small amounts of other elements, such as nitrogen, phosphorous, sulphur, potassium, calcium and magnesium. It contains both living and dead components and can range from very recent inputs, such as stubble and roots, to largely decayed materials that are thousands of years old. 18 https://www.industry.gov.au/sites/default/files/September%202020/document/first-low-emissions-technology-statement-2020.pdf Quarterly Update of Australia’s National Greenhouse Gas Inventory: December 2020 26
CSIRO scientists have identified four biologically significant types or fractions of soil organic
carbon 19:

        •    crop residues – shoot and root residues less than 2 mm found in the soil and on the soil
             surface
        •    particulate organic carbon – individual pieces of plant debris that are smaller than 2 mm but
             larger than 0.053 mm
        •    humus – decomposed materials less than 0.053 mm that are dominated by molecules stuck
             to soil minerals
        •    recalcitrant organic carbon – this is biologically stable; typically in the form of charcoal.

Organic matter makes up just a few per cent of most soils’ mass and plays an important role in the
physical, chemical and biological function of agricultural soils. Organic matter contributes to nutrient
retention and turnover, soil structure, moisture retention and availability, degradation of pollutants,
and carbon sequestration.

Figure ST1: How carbon cycles in and out of soil

Source: Jocelyn Lavallee, CC BY-ND

How does soil organic carbon change?
The amount of carbon stored in the soil is the balance between the rate at which organic matter is
added and the rate at which it decomposes, releasing carbon dioxide (CO2) into the atmosphere.
Because one carbon atom combines with two oxygen atoms to form CO2, the loss of one tonne of
soil carbon results in the emission of 3.67 tonnes of carbon dioxide.

Carbon can be added to the soil through the decay of plants, manure and microbes. Research
supported by the Government suggests that where soil carbon was previously run down by more
intensive farming practices, planting certain perennial pasture types can capture more soil organic
carbon 20. A range of other farm practices are being investigated to determine their long–term effect

19   https://csiropedia.csiro.au/soil-carbon-research-program/
20   https://www.agriculture.gov.au/ag-farm-food/climatechange/australias-farming-future/soil-carbon

Quarterly Update of Australia’s National Greenhouse Gas Inventory: December 2020                        27
on soil carbon. These include fallow management, tillage practices, grazing practices in rangelands,
crop rotations in irrigation areas, and fertiliser application and timings.
Carbon can be lost from the soil through the conversion of organic carbon to CO2, through erosion
and by leaching of dissolved carbon through the soil.
How does the Australian Government report it?
Following the Intergovernmental Panel on Climate Change (IPCC) Guidelines for National
Greenhouse Gas Inventories, soil carbon appears in the Land Use, Land-Use Change and Forestry
(LULUCF) sector. While the National Inventory includes carbon stock changes in soils on all lands,
including forest lands, the focus of this Special Topic is agricultural lands (croplands and grassland).
Although nitrous oxide (NO2) emissions from agricultural soils are included in the Agriculture sector
of the National Inventory, soil carbon changes are included in LULUCF under Grassland and Cropland
separately. Australia’s annual National Inventory Report to the UNFCCC, and its associated data
tables, report these subsectors disaggregated to the level of Grassland Soils and Cropland Soils. Full
details of the methods can be found in Volume 2 of the National Inventory Report 21.
Soil Carbon in the National Inventory
Soil carbon emissions estimates for cropland and grassland for the period 1990 to 2019 are shown in
Figure ST2. While climate has important cyclical effects, the uptake of reduced, minimum and no-till
management techniques through the 1980s and 90s (Figure ST3) is reflected in the tendency
towards decreasing emissions from croplands during this period as a new soil carbon equilibrium is
reached. In the year to December 2020, soil carbon contributed a net sink of 5.6 Mt CO2-e to the
National Inventory.
Figure ST2: Soil carbon emissions from cropland and grassland in the Australian National Inventory
1990-2019
30
20
Emissions (Mt CO2-e)
10
0
-10
-20
-30
1990 1995 2000 2005 2010 2015 2020
grassland soils cropland soils
Source: DISER, National Inventory Report 2019 (published 2021)
21 https://www.industry.gov.au/data-and-publications/national-greenhouse-accounts-2019/national-inventory-report-2019
Quarterly Update of Australia’s National Greenhouse Gas Inventory: December 2020 28Figure ST3: Changing land management practices on cropland.
1
fraction of land managemnet practice per cropland area
0.9
0.8
0.7
0.6
0.5
0.4
0.3
0.2
0.1
0
No till Tilled Grazed
Source: ABS Agricultural census (5-year smoothing, to reflect the 5-yearly census)
Soil carbon in FullCAM
Emissions from the LULUCF sector, including forestry, grasslands, croplands, and harvested wood
products, are estimated using the national inventory system’s Full Carbon Accounting Model
(FullCAM). Because Australia is so large, (approximately 769 million hectares), it is not practical to
measure these emissions and removals using direct estimation methods, such as field sampling and
observations. This is especially true for soil carbon, which is not visible from the surface. Although
the carbon is often concentrated in the upper layers, the IPCC Guidelines require the estimation of
changes in soil carbon to a depth of 30 cm. Modelled data sets in FullCAM are generally designed to
reflect the amount of soil carbon to a depth of 30cm, but the model allows for changes to soil
carbon below 30cm, as appropriate, such as in mangrove areas. Soil carbon can also be highly
variable over short distances, and also through time when there are climate or land disturbance
events. In such situations, management practices can cause changes in carbon stocks which are
challenging to measure directly with sufficient precision using current technology. The same applies
to small changes in carbon over large areas, and yet these changes may make a significant
contribution to the National Inventory.
The best way to estimate these changes over the whole continent is with a modelling framework,
which is the approach adopted by all UNFCCC countries with the resources and information to do so.
FullCAM estimates the carbon stock change in ecosystems including above and belowground
biomass; standing and decomposing debris; and soil carbon resulting from land use and
management activities. This sophisticated modelling approach is subject to annual review by
international teams of experts as part of UNFCCC national inventory review processes.
Quarterly Update of Australia’s National Greenhouse Gas Inventory: December 2020 29Within FullCAM, soil organic carbon is modelled using the Rothamsted Carbon Model (RothC). This
model was developed over decades by the Rothamsted agricultural research centre in the UK.
RothC models the turnover of organic carbon, taking into account clay content, temperature,
moisture content, plant and manure inputs, and plant cover. FullCAM is simulated in monthly time
steps commencing in 1970 (Figure ST4), and all on-site carbon pools (living biomass, dead organic
matter (DOM) and soil) are estimated. Consistent with the IPCC guidelines, a mean incremental
change in SOC for the transitions near steady states is derived from the simulated monthly data, as
shown for Cropland in Figure .
Figure ST4: Carbon stock change from cropland remaining cropland, 1970–2020
Source: DISER, National Inventory Report 2019 (published 2021), section 6.6.1
To make these calculations, FullCAM requires a lot of up-to-date input data over the whole country
(Figure ) including:
• initial estimates of clay content and soil carbon fractions
• climate datasets for rainfall, temperature and evaporation
• crop and pasture management data, including the crop species grown and the management
activities (e.g. tillage)
Quarterly Update of Australia’s National Greenhouse Gas Inventory: December 2020 30Figure ST5: data inputs required to model soil carbon for the whole of Australia using FullCAM Source: DISER Comparison with other Soil Carbon Inventory methods A comparison study published this year shows that FullCAM’s modelling of changes in soil carbon is consistent with that of a recently released IPCC model. The sophisticated soil carbon model in FullCAM, calibrated for use in Australia, is known as an IPCC “Tier 3” method. In its guidelines for greenhouse gas inventories, the IPCC has classified the methods in three tiers: Tier 1 is the basic method, Tier 2 intermediate and Tier 3 the most demanding in terms of complexity and data requirements. Higher tier methods are generally considered to be more accurate provided that adequate data are available to develop, evaluate and apply the method. In 2019, the IPCC published a refinement of the greenhouse gas inventory guidelines22, which for the first time included a Tier 2 model method for cropland soil carbon. This provided a valuable opportunity to compare estimates of soil carbon change with those produced by FullCAM used in Australia’s National Inventory. This analysis showed good agreement between the models over timescales relevant to observing the impact of changing farming practices, and is outlined in Australia’s most recent National Inventory Report 23, and described in detail in Baldock et al. (2021) 24. There are some differences between the two models: the IPCC Tier 2 model (IPCC_T2) is based on the Century model with three conceptual carbon sub-pools, while FullCAM, with a soil module based on the RothC model, has five conceptual sub-pools. In addition, the FullCAM model has been calibrated and verified with measured data points for Australian conditions, and includes variable land management practices such as stubble and tillage events, while the IPCC_T2 has been calibrated with global datasets that overwhelmingly represent the northern hemisphere. In the comparison, the same land management, yield data (to generate carbon inputs) and climate datasets were used for both FullCAM and IPCC_T2. Simulations were carried out from 1970–2018 22 https://www.ipcc-nggip.iges.or.jp/public/2019rf/index.html 23https://www.industry.gov.au/data-and-publications/national-greenhouse-accounts-2019/national-inventory-report-2019, Volume 2, Appendix 6.B.7.1, page 220 24 Baldock, J., Karunaratne, S., Reddy, S., Shepherd, N., 2021. Application of the IPCC Tier2 SOC model to Australian Croplands. CSIRO, Australia. Quarterly Update of Australia’s National Greenhouse Gas Inventory: December 2020 31
using 1818 cropland sites collated from the Australian Soil Carbon Research Program (SCaRP),
covering the main cropping regions of Australia. The estimates of soil carbon stocks at these sites
show very good agreement (a Lin’s concordance correlation coefficient of 0.96–0.98).

Annual emissions result from the change in stocks. Plotting the annual change in soil carbon for the
two models as a 3D bar plot (Figure ST6.A) shows that the vast majority of data points fall on the
concordance line close to zero, although IPCC_T2 is more volatile with outlying values twice as large
as FullCAM’s. Over longer periods, the two models showed close agreement, particularly over an
interval of 20 years (Figure .B). This is the period noted by the IPCC Guidelines as the typical time to
achieve new equilibrium following a change in management conditions.

Figure ST6: A) Comparison of annual soil carbon emissions from FullCAM with IPCC Tier 2 Steady-
State model, and B) averaged over a period of 20 years

Source: DISER, National Inventory Report 2019 (published 2021), Appendix 6.B.7.1

Ongoing improvements
Like every aspect of the National Inventory, the methods for estimating changes in soil carbon are
under continuous improvement. These improvements are based on research procured from soil
science experts at the CSIRO and universities, and are described in the annual National Inventory
Report when they have been implemented.

Current method development areas include:

     •     Developing methods of detecting land use activities (such as tilling and harvesting) from
           satellite imagery. Use of satellite imagery will enable the systematic spatial tracking of the
           effects of management practices such as actions to improve pasture, the use of minimum
           tillage and the burning of agricultural residues. In the past this information has been drawn
           from the Australian Bureau of Statistics’ Agricultural Census, which is conducted every five
           years and is reported by SA2 statistical area 25. A method based on remote sensing would
           provide more frequent updates at higher spatial resolution.

25 Statistical Areas Level 2 (SA2) are medium-sized general purpose areas, chosen by the ABS to represent a community that interacts

together socially and economically.

Quarterly Update of Australia’s National Greenhouse Gas Inventory: December 2020                                                       32
• Improving estimates of the initial soil carbon stock at the start of the FullCAM simulation
(although the national inventory reports emissions from 1990 onwards, the simulation starts
at 1970). Using Bayesian statistical techniques, soil carbon measurements and the FullCAM
model can be used to reconstruct the initial stocks, with an associated estimate of the
confidence in these values.
As well as these activities, the Government’s Frst Low Emissions Technology Statement 26 set an
economic stretch goal to enable soil carbon measurement under $3 per hectare per year. While the
requirements for measuring changes in soil carbon stocks over the area of an individual
sequestration project differ from the National Inventory’s need to make an estimate over the whole
continent, the same soil processes and management practices apply at large and small scales.
Innovations that are being explored to meet this stretch goal, such as the expanded use of remote
and proximal sensing technologies, improved national soil carbon datasets and the development of
improved soil carbon computer models are also expected to yield benefits for the National
Inventory.
26 https://www.industry.gov.au/sites/default/files/September%202020/document/first-low-emissions-technology-statement-2020.pdf
Quarterly Update of Australia’s National Greenhouse Gas Inventory: December 2020 335. Technical notes Quarterly Coverage The Quarterly Update uses emissions estimates based on our United Nations Framework Convention on Climate Change (UNFCCC) inventory time series to better support implementation of Australia’s 2030 target. This UNFCCC inventory will be used to track progress towards Australia’s commitment to reduce emissions levels by 2030 under the Paris Agreement. The inventory used by Australia to acquit its Paris Agreement target includes all sources and sinks across Australia’s economy. This comprehensive approach is consistent with the one adopted by the Biden Administration and ensures Australia’s accounting is complete. International guidelines The Quarterly Update has been prepared in accordance with the international guidelines agreed for use for the Paris Agreement including the Intergovernmental Panel on Climate Change (IPCC) 2006 Guidelines for the Preparation of National Greenhouse Gas Inventories and, where applicable, the 2019 IPCC Refinement to the 2006 IPCC Guidelines. The Quarterly Update reports on the national inventory with the application of the IPCC’s natural disturbances provision since the Government indicated in its 2015 Nationally Determined Contribution (NDC) submission that it would meet its emission reduction commitments using this provision. The national inventory prepared without the application of the natural disturbances provision is reported in the Australian Government’s National Inventory Report submitted to the UNFCCC Secretariat each year between 15 April and 27 May. This submission will provide full details of estimates of annual emissions from bushfires and sequestration from subsequent biomass recovery. Greenhouse gases Emissions are expressed in terms of tonnes of carbon dioxide equivalents using the Global Warming Potential (GWP) weighting factors indicated in Table 6. GWPs have been used for each of the major greenhouse gases to convert them to carbon dioxide equivalents (CO2-e). As greenhouse gases vary in their radiative activity and in their atmospheric residence time, converting emissions into CO2-e allows the integrated effect of emissions of the various gases to be compared. Commencing with the September Quarter 2020 the Department has applied the 100-year time GWP values from the Intergovernmental Panel on Climate Change (IPCC) Fifth Assessment Report (AR5) to estimate emissions, consistent with rules adopted under the UN Framework Convention on Climate Change (UNFCCC) Paris Agreement (Decision 18/CMA.1 Annex 2.D Paragraph 37). This approach will also be used to track Australia’s progress towards its Paris Agreement Nationally Determined Contribution of 26-28% below 2005 levels by 2030, on an emissions budget basis. Paris Agreement update to Global Warming Potential for emission estimation According to Paris Agreement Decision 18/CMA.1 Annex 2.D Paragraph 37 - “Each Party shall use the 100-year time-horizon global warming potential (GWP) values from the IPCC Fifth Assessment Quarterly Update of Australia’s National Greenhouse Gas Inventory: December 2020 34
You can also read