LIMERICK DEVELOPMENT PLAN 2022-2028 - People & Places
←
→
Page content transcription
If your browser does not render page correctly, please read the page content below

LIMERICK
 DEVELOPMENT
  PLAN 2022-2028
  Background Paper
   People
    & Places

Contents
1.0 – Introduction…………………………………………………………………………………………………………… 3
2.0 – Population, Population Distribution and Housing Densities…………………………………….. 4
        2.1 – Introduction………………………………………………………………………………………………… 4
        2.2 – Age structure and dependency…………………………………………………………………… 8
        2.3 – Headship Rates and Household Rates………………………………………………………… 11
        2.4 – Labour Market…………………………………………………………………………………………… 11
        2.5 – Ethnicity, Nationality and Religion……………………………………………………………… 12
        2.6 – Demographic Factors for Change: Migration and Natural Changes……………… 13
3.0 – National and Regional Policy…………………………………………………………………………………… 15
        3.1 – Core Strategy – what it means and its importance……………………………………… 15
        3.2 – National Planning Framework……………………………………………………………………… 15
        3.3 – Implementation Roadmap for the National Planning Framework……….……… 19
        3.4 – Regional Spatial and Economic Strategy for the Southern Region..…………….. 20
4.0 – Review of existing Core Strategies as set out in the existing Development Plans…… 22
5.0 – Rural Housing………………………………………………………………………………………………………… 23
        5.1 – Introduction………………………………………………………………………………………………… 23
        5.2 – National Planning Framework……………………………………………………………………… 24
        5.3 – Regional Spatial and Economic Strategy for the Southern Region……………… 25
        5.4 – Section 28 Guidelines………………………………………………………………………………… 26
        5.5 – Planning Policy in Limerick City and County………………………………………………… 28
        5.6 – Rural Limerick Profile………………………………………………………………………………… 30
        5.7 – Settlement Pattern……………………………………………………………………………………… 31
        5.8 – Age Structure………………………………………………………………………………………………. 32
6.0 – Conclusion………………………………………………………………………………………………………………. 34

List of Tables
Table 1 – Limerick City and County Council, age structure groups distinguished between City
and County………………………………………………………………………………..…………………………………… 9
Table 2 – Age Dependency ratios Limerick City and County, distinguished Between City and
County............................................................................................……………………………….… 9
Table 3 – Population Projections for Limerick from the Implementation Roadmap for the
National Planning Framework………………………………………………………………………………………… 19
Table 4 – Population Projections 2026 and 2031 for the Limerick – Shannon Metropolitan
Area………………………………………………………………………………………………………………………………… 21
Table 5 – Irish State and Limerick City and County Aggregate, Urban and Rural Populations
1996, 2011, and 2016……………………………………………………………………………………………………… 31

                                                                                                                1
List of Figures
Figure 1 – Population Trends Limerick City and County 1951 – 2016………………………..……. 4
Figure 2 – Limerick City and County Population Trends Census every 10 years 1951 – 2016
per Settlement Category…………………..………………………………………....………………………………… 5
Figure 3 – Percentage Population Change 2011 – 2016 per Electoral District, Limerick City
and County………………………..…………………………………………………………………………………………… 6
Figure 4 – Percentage Population Change 2011 – 2016 per Electoral District, Limerick City
and Environs…..………………………..………………………………………………….………………………………… 6
Figure 5 – Population Increase/Decrease in all Settlements identified with a Central Statistics
Office Settlement in Limerick……………………………………………………..……………………................ 8
Figure 6 – Youth Dependency Ratio by Small Area of Population – Limerick City and County
2016……………………………………………………………………………………………………………………………… 10
Figure 7 – Limerick City and County existing and projected Populations 2006 – 2016…… 22
Figure 8 – One off Dwellings Houses permitted 2009 – 2019 in Limerick………………………… 29
Figure 9 – Number of Dwelling Units permitted in Limerick 2001 – 2019………………………… 30
Figure 10 – Residential Vacancy by Geo Directory in Limerick………………………………………… 32
Figure 11 – Old Age Dependency by Small Area of Population – Limerick 2016……………… 33

                                                                                             2
1. 0 – Introduction
Ireland’s population increased by 173,613 persons over the five years since April 2011, to
reach 4,761,865 persons recorded in the Census, carried out in 2016. This represents a total
increase of 3.8% over the 5 years, or 0.8% on an annual average basis. This compares with
an annual average increase of 1.6% over the previous inter-censal period 2006 to 2011.
Limerick City and County has experienced some population growth between 2011 and 2016.
However, the City and County shares in the national slowdown in growth, which has been
occurring since the years of peak growth in the late 1990s and years leading up to 2008.
Between the 2011 and the 2016 Census periods, Limerick’s population grew by 3,090
people.
The settlement structure of Limerick has traditionally been dominated by Limerick City,
located at the lowest bridging point of the River Shannon. There is a rich network of towns
and villages, throughout County Limerick, but the settlements are for the most part quite
small and the settlement pattern has remained quite dispersed. The open rural area, which
includes 34 non-census settlements, accounts for 30% of the entire Council area’s
population, including the City. Since 1996 of the 21-zoned settlements in County Limerick,
only six exceeded the average growth rate for the settlements on aggregate. The City itself
is an important industrial and commercial centre for the Mid-West region, the location of a
university, a teaching hospital, and two third level institutes and a large employment base.
The population in Limerick City and Suburbs includes a small part of Co Clare, as defined by
the Central Statistics Office, was recorded as 94,192, in 2016.
For areas outside of the City, it is clear that there has been a considerable slow-down in
population growth between 2011 and 2016, and population decline in some instances. Out-
migration is a common response of rural communities to lack of local employment
opportunities. It is clear that one of the principal challenges for the rural economy as a
whole is to compensate for the losses of employment in farming, a long term trend that
preceded the recent economic crash.
The proposed Limerick Development Plan 2022 – 2028 is required to set out a strategy for
the growth and development of the city and county, which is consistent with national and
regional policy. Since the adoption of the existing Development Plans in 2010, there has
been significant change in the policy and regulatory environment for land use planning in
Ireland. The adoption of Project Ireland 2040 National Planning Framework (NPF) in 2018
and the Regional Spatial and Economic Strategy for the Southern Region (RSES) in 2020,) set
out the population targets for the country. These statutory plans are aligned in setting out
unprecedented and ambitious growth targets for Limerick, which seek to harness its
potential to achieve balanced regional development that counter balances the growth the
east of the Country.

This background paper explores issues in relation to people and places in Limerick. It sets
out the historical trends in population, households and housing growth in Limerick up to the
last Census in 2016. In addition, it also sets out the future population for Limerick, following
on from the targets set out in the National Planning Framework (NPF) and Regional Spatial
and Economic Strategy (RSES) looking to the horizon years of 2026, 2031 and ultimately to
2040. Finally, the paper considers development trends in rural housing in Limerick and the
impact of this on the overall population growth of the City and County.

                                                                                              3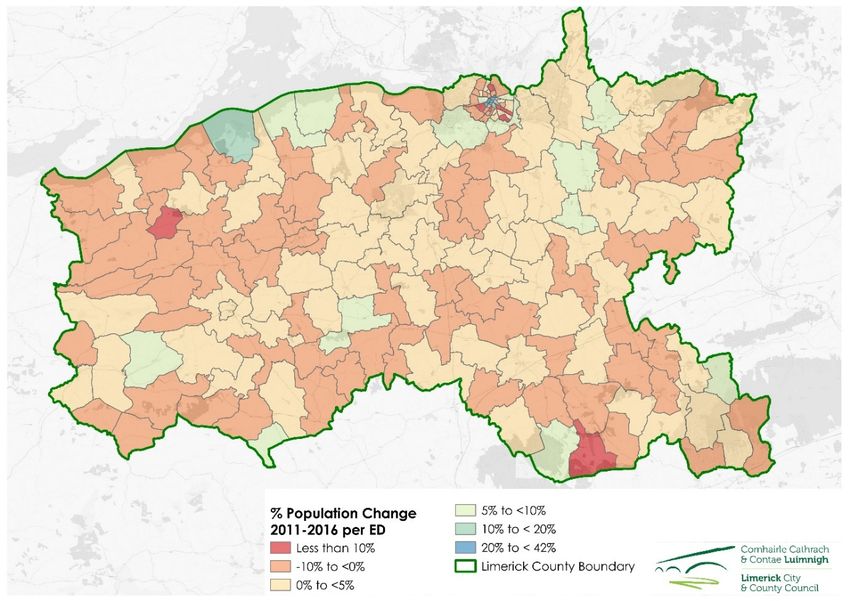
2.0 – Population, Population Distribution and Housing Densities
2.1 – Introduction
In the last seventy years, Limerick City and County, taken in aggregate, has grown in
population in every inter-censal period since 1961, reversing a previous long-term trend of
decline, and this growth continued, with the exception of the 1986-91 period, as shown in
the table and graph below. The overall growth is 27% from 1951; this is below the rate of
growth of population in the State, which is 37.8% of the 1951 base. Quite a lot of growth
has taken place since 1991, when the overall growth in the population of Limerick City and
County has been 20%, translating to 0.8% annual average growth. The 2016 Census,
recorded a population of 194,899 in Limerick City and County.

                     250,000

                                                                                                            194,899
                     200,000                                                                     183,547

                                                                            164,569    167,038
                                                                                                       191,809
                                                             151,052                        175,293
  Popuation totals

                     150,000             137,881   137,357        161,661        161,956

                               141,239                  140,459
                                             133,339
                     100,000

                      50,000

                          0
                                1951 1955 1961 1966 1971 1976* 1981 1986 1991 1996 2001* 2006 2011 2016
                                                              Every five years since 1951

Figure 1 – Population Trends Limerick City and County 1951 – 2016 – Source: CSO, Census
records, all years are census years except years with asterisks, which are estimated pro-
rata from nearest census years of 1979 and 2002 to yield even 5 - year periods of change
There has been a long-term trend of increased urbanisation of the city and county council
area, and concentration of development in and around the city. In these respects, Limerick
is like a mirror of wider national trends. The trend towards both urbanisation and
concentration into larger settlements can be seen in the following chart, Limerick City and
Suburbs have seen continuous growth over the period since 1951, with a current population
of almost 95,000. The current national and regional policy seeks to build on this growth and
seeks to ensure that 50% of all new development in located within the existing built up
footprint of the City, ensuring compact growth is at the heart of the Development Plan
policy.

                                                                                                                      4
100,000
                                                                                                                         87,081
                         90,000
                             75,267                                                                          76,498
                         80,000                                                73,210        72,656
                         70,000                64,169
                                                               62,658                                                    70,758
           Population

                         60,000
                                                                               65,783        63,422          72,854
                         50,000
                                                               60,045
                              50,820
                         40,000                51,732
                         30,000
                         20,000
                         10,000
                             0
                              1951               1961             1971          1981           1991            2002       2011

                                  Population of Limerick city (incl suburbs)    Population in other settlements >1,500
                                  Other Settlements (>200 only)                 Rural area outside of settlements

Figure 2 – Limerick City and County population trends Census every 10 years 1951 – 2011
per broad settlement category
Limerick is a low density city. Its overall population density is over the entire land area of the
city is 1,600 persons per km2 (or c16 people per hectare). This places it close to the norm for
Irish cities outside of Dublin, Dublin City being an outlier with a population density of 3,700
persons per km2. These low densities are associated with high car usage for daily journeys to
work, school or college: in 2016, only 32.6% of journeys to work, school or college were by
sustainable modes of transport. In Dublin city the equivalent percentage is 47.9%.
The city centre is an important centre for retail, offices and a range of support services, and
is an extensive area which is also focal with respect to public transport routes and services.
Key features of the city centre are high levels of vacancy (at 17% in 2016 Census, though a
marked improvement from 2011 when the rate was 24%), low household size, the
importance of the private rented sector and of in-migrants. There are large ‘transformation’
sites in an around city centre; and many of the city centre’s Georgian blocks offer
opportunities to rehabilitate the existing building stock, or as the case may be to develop
new residential units through sensitive infill.

Limerick County has many nucleated settlements, generally small in size, and most of which
are in the fertile lowlands in the east and centre of the county. The county, outside the city
environs, has lagged behind the city in terms of growth. Limerick’s settlement structure is
such that the next largest town after the city is only 7% of the city’s population. This
settlement network and dispersed settlement pattern have their roots in the county’s
important, mainly pastoral agricultural economy, landownership structures, and at a time
where people travelled less.

                                                                                                                         5
Figure 3 – Percentage Population Change 2011 – 2016 per Electoral District Limerick City
and County

Figure 4 – Percentage Population Change 2011 – 2016 per Electoral District – Limerick City
and Environs

                                                                                           6
Rural out-migration has left its mark on some communities by reducing the number of
younger adults that might stay and establish households, often making it harder for these
communities to sustain themselves into the future. However, this depends on the area’s
proximity or remoteness from big towns and cities or transport corridors. The likelihood of
net out-migration depends on how the local rural economy is structured and how it rates in
terms of its diversity, openness and dynamism. It also depends on its demographic structure
and population density, where in Limerick at least the rural areas of lowest population
density tend to be the most prone to population stagnation and decline. Not just open rural
areas, but many towns and villages too are vulnerable to the effects of economic changes,
which have rendered many of their traditional functions economically marginal or
redundant, and hence narrowed the range of local employment opportunities, and
increased their reliance on jobs further away.
Limerick shares in the national trend towards increased urbanisation of the population, but
it also has been the case that the development of towns and villages has been very uneven
in Limerick, not helped by their great number, generally small size, and their economic
obsolescence in a transformed rural economy. Over the last twenty year there has been
growth of satellite settlements within the commuting belt of Limerick. There has been
considerable development in attractive villages and towns such as Adare, Castleconnell,
Clarina and Ballyneety. The development of towns and villages has been uneven, and
hampered in many cases by the difficulty of securing the development of adequate capacity
in infrastructure and supply of wastewater and water supplies. This is an issue in Hospital,
Askeaton and Dromcollogher. Patrickswell illustrates very well the crucial importance having
an adequate public sewerage system can make to a town. This village should have
benefitted from its proximity to the city, however lack in wastewater facilities, resulted in
very limited development, until 2017, when facilities became available.

Economic decline, property dereliction and vacancy are inter-related issues in many towns
and villages, issues which are well established but made worse in recent years from the
2008 banking crisis. In general there seems to be an inverse correlation between housing in
the open countryside and in the outskirts of towns and villages that occur somewhat
randomly, and how poorly towns and villages fare. National and regional policy shifts the
dial in terms of towns and village and places a strong focus on revitalising towns and
villages, so become desirable places to live and work, with economic development and
associated services.
The Map identified in Figure 5 highlights the population increase or decrease in settlements
identified by the Central Statistics Office, as having a settlement boundary, between the
Census periods 2011 – 2016. Some of the towns and villages in Limerick have seen
substantial growth, while others have declined.

There is a need to prioritise and promote the development of Limerick’s existing network of
towns and villages, both as service centres and as places people wish to live, work and visit.

                                                                                            7
Figure 5 – Population increase/decrease in all Settlements identified with a Central
Statistics Office Settlement Boundary in Limerick

2.2 – Age structure and dependency
The age structure is important to examine as it affects the prospects for future natural
increase through family formation; it affects the requirements for a range of services and
facilities, and impacts on employment demand, purchasing power and on household
formation. An age pyramid showing the age structure for the city and county in 2016 is
shown below, then comparing the county and the city area separately. Secondly, age
dependency rates are compared by area and area type, starting with the broadest level of
the city versus the county. Age dependency is a measure of the proportion of people not of
working age population to those of working age population (those aged 15-64). Youth age
dependency is the proportion of those under 15 years to the population of working age; old
age dependency is the proportion of those aged 65 years and over to the population of
working age.

                                                                                        8
2016 Limerick City 2016 City and Former City County outside of
and County Suburbs within council area city and environs
council area 2016 2016
Age group Total % Total % Total % Total %
numbers Number Number Number
0-4 years 13,135 6.74 6,050 6.75 3,610 6.20 7,085 6.73
5-14 years 26,459 13.58 10,916 12.18 6,789 11.66 15,543 14.76
15-24 years 25,834 13.26 14,078 15.71 8,331 14.31 11,756 11.16
25-49 years 68,250 35.02 33,522 37.42 21,169 36.36 34,728 32.98
50-64 years 33,803 17.34 13,875 15.49 9,972 17.13 19,928 18.92
65-79 years 21,405 10.98 8,685 9.69 6,520 11.20 12,720 12.08
80 years+ 6,013 3.09 2,462 2.75 1,829 3.14 3,551 3.37
TOTAL 194,899 89,588 58,220 105,311
Table 1 – Limerick City and County, Age structure groups, distinguishing between City and
County
The data in this above table can be used to show that the proportion of those of working
age, ie those aged between 15 and 64 years, is higher in the city and suburbs than in the
rest of the county. The percentage of those of working age in the city and suburbs is 68.62%,
whereas it is 63.06% in the rest of the county, derived by summing up the returns for these
areas in the relevant age categories.
The following age dependency table shows the differences between the city and the rest of
the council area, with the total age dependency ratio being 13% greater outside of the city
and environs than inside the city. Age dependency is a measure of the proportion of people
not of working age to those of working age.
Limerick City City and Former Council area
and suburbs city outside of
County Council within Council city and
Council area environs
Youth dependency ratios (age 30.96% 27.60% 26.35% 34.07%
0-14 as % of aged 15-64)
Old age dependency ratios 21.44% 18.13% 21.15% 24.50%
(age 65+ as % of aged 15-64)
Total age dependency ratios 52.40% 45.73% 47.50% 58.57%
Table 2 – Age dependency ratios Limerick City and County Council distinguishing between
City and County
9Examining age dependency and distribution across the City and County by Small Area of
Population, the following map show the young age dependency ratios in bands per Small
Area, highlights the population distribution and the specific needs that certain areas may
have.
Figure 6 – Youth Dependency Ratio by Small Area of Population – Limerick 2016
The map identified in Figure 6, identifies young age dependency ratios per Small Area of
Population, showing that there is clustering of Small Area together in the same or adjacent
bands of ratios. The areas with particularly low young age dependency ratios tend to be in
the hilly fringes of the county, where there also are few settlements and a low population
density.
Within the City and also comparing Small Areas immediately adjacent to city, the lowest age
dependency ratios are found in the city centre, where many young adults choose to live
often in rented accommodation close to work. In the suburbs, the variation in age
dependency ratios is significant, but there are clear patterns. The regeneration areas of
Moyross, Southill and St Mary's Park have high young age dependency ratios. Some of the
newer suburbs in the outer periphery of the city in the south-west also have high levels of
dependency. A significant exception to the newer suburbs having a high young age
dependency is Ballysimon ED. This is largely accounted for by third level students living in
Castletroy and enrolled in University of Limerick, in this area. The older inner suburbs of the
city are characterised by low young age dependency ratios principally due to an older age
profile and to a lesser extent, by houses occupied by third level students.
102.3 – Headship rates and household size
The demand for new housing is related to the number of people setting up new households,
which in turn is driven by demographic factors, cultural patterns, and economic capacity.
The overall trend in Ireland has been for a decline in household size as family units are
becoming smaller. The average household size in the Republic of Ireland in 2016 was 2.75,
which compares with 3.34 in 1991. The household size in Limerick in 2016 was 2.7 (rounded
up); this compares to 3.37 in 1991.
This trend was interrupted in the 2011 – 2016 Census period, a consequence of the delays in
new household formation amongst younger adult age categories due to the uncertain
economic climate, the sharp reduction in in-migration, and the shortages of affordable
accommodation. The average household size in Limerick in 2011 was 2.693, so that the
household size in 2016, which was actually 2.698 is slightly larger.
Another measure commonly used in assessing housing demand is the headship rate. The
age specific ‘headship rate’ is the term given to the proportion of heads of household per
100 population in that age group. Where the headship rate is high and increasing, this
means that the average household size is low and decreasing. Nationally headship rates
have been increasing over the long term. In 1991, the overall headship rate was 28.9 in the
State, but it has increased every census year since then to reach 35.9 by 2016.
There are broadly two approaches that can be used to assess the future need for housing,
bearing in mind that this need is not only a function of population changes and future
household formation, but also of current need as yet un-met, such as would be reflected in
social housing waiting lists.
2.4 – Labour Market
The demand for jobs is related to the number of people aged 15 years or over who are
available for work and this in turn is as one might expect contingent on the overall
population size, its sex and age structure and the impact of natural change and migration on
the population. The labour force participation rate is the percentage of people of all aged 15
and over who are available for work. Low labour force participation rates are often
associated with problems with access to or disengagement from the labour market. It
should also be borne in mind that many people are not available for work due to
commitments to care at home or voluntary work. In addition, the base population from
which the labour force is derived includes people of age 65 or over, many of whom will be
retired.
The CSO produce ‘Population and Labour Force projections’ every few years, to provide a
reference framework and guidance for Government at all levels, and other development
agencies. In making projections as to labour force participation, the CSO disaggregates the
population of working age into different segments, each defined by different specific
participation rates. These segments are based on gender, age, marital status or participation
in third level education.
It is important that a distinction is made between the employment of residents of Limerick
and the number of jobs based in Limerick, and also a further distinction between where the
jobs are located and where the workers reside for Limerick city. These distinctions are
important to gauge the significance of challenges and opportunities for employment
11generation in the local and regional context and to define commuter zones and travel to
work catchments.
The number of jobs in Limerick in 2016 was 67,986, according to Powscar returns; this is a
7.8% increase over the 2011 total, which was 63,054. It should be noted that these figures
exclude those who failed to provide information on their workplace and those who
indicated that they had no fixed place of work. According to calculations made in the ESRI
report ‘Prospects for Our Regions’ (2018) based on Powscar 2011 1, 76,500 jobs were based
in Limerick City and County, and 149,200 in the Mid-West region as a whole (comprising of
Limerick, Clare and North Tipperary). The jobs figures were total figures and were not
confined to jobs in fixed places of work, they also allowed for those responses to the Census
that were not coded.
2.5 – Ethnicity, Nationality, Language and Religion
The Census has questions on ethnicity and nationality, language and religious affiliation. It is
important to identify the patterns and trends of population categorised according to
different ethnicities, or/and where their birthplaces are outside the State. It is important for
various reasons, including as an indicator of migration trends. It is also important to help
define the size, characteristics and distribution of people in distinctive minority ethnic
groups, which might have specific set of needs that are strongly associated with their
identity and with special challenges faced by these groups.
Language and faith are two important markers of identity, giving people a sense of
community, purpose and belonging. They are also useful barometers of change in social
attitudes, and may reflect the introduction of new cultures through migration. There are
two distinct themes in relation to language, firstly in respect of the Irish language the
frequency with which this is spoken and whether or not within or outside the education
system; secondly in relation to migrants, what are the main languages spoken other than
English, and levels of ability to speak English.
In respect of religious affiliation, the proportion of the population of Limerick that stated
that they were Roman Catholic has declined from 92.3% in 2002 to 82.7% in 2016, a decline
that principally reflects increasing secularisation. In respect of language, the influx of
immigrants whose first language is not English has resulted in a more diverse tapestry of
languages spoken, although most non-English speaking immigrants state that they can
speak English either well or very well.
In respect of the Irish language, Limerick does not have any areas where Irish is spoken as a
community language. The high percentage of people who claim that they can speak it and
the stark contrast between that high percentage and the low number of people who speak
it on a daily basis outside of the education system is a noteworthy feature in Limerick as it in
most areas outside of the official Gaeltachtai.
In Limerick, there are two patterns of particular importance to note in relation to ethnicity
and international migration.
1
Edgar Morgenroth ‘Prospects for Irish Regions and Counties: Scenarios and Implications’ ESRI, January 2018,
p31. The 2016 results of powscar were not available at the time of writing of this report.
121) In a relatively short space of time, Limerick has experienced a noticeable inflow of
international migrants, at a scale and diversity that is unprecedented, and in this
respect, it shares much in common with the changes experienced in the rest of
Ireland in the last 20 to 25 years.
2) International migrants are not the only source of ethnic difference. In Limerick as in
many other parts of Ireland, travellers form a small but distinct ethnic group.
The number of those resident in the city and county who were born outside of the State has
more than trebled in size between 1996 to 2016, from 8,791 to 27,984, and as a proportion
of the population increased from 5.46% in 1996 to 14.09% in 2016. The composition of
migrants has changed as well, with the proportion of those born in Great Britain decreasing
from 68.9% to 30%. Europe has overtaken Britain as the most important source of
international migrants into Ireland; Britain is second ranked, with the remaining proportion,
25%, accounted for by a wide range of countries outside of Europe. The biggest expansion
occurs of migrants coming from the European accession countries in central and Eastern
Europe that joined from 2004 onwards. They account for 85% of the European increase.
Within Limerick, most international migrants settle in the urban settlements (of population
1,500 or over), which of course is dominated by Limerick City. 85% of all European migrants
live in the urban settlements of Limerick, and 87% of non-European migrants.
Travellers are a small but distinct ethnic group. Though only forming 0.8% of the population
of Limerick according to the census, there is an important concentration of people of this
ethnicity in Rathkeale, where 23% of its population state themselves as ‘White Irish
traveller’.
2. 6 – Demographic Factors for Change: Migration and Natural Changes
Population changes are based on natural change (births minus deaths), and net migration
flows (i.e. those that are added to the population by in-migration minus those that are taken
away through out-migration). Natural change reflect various factors, including fertility and
mortality rates, age structure and demographic profile (affecting the numbers of women of
child-bearing age for example). Migration is sensitive to national and regional economic,
health and public policy, perceptions, and push and pull factors external to the country, and
within the State. Migration tends to be age selective, with inwards migration favouring
younger adults and households; and outwards migration often leaving a legacy of higher
than expected population aged 65 or over, or empty nester households.
If we take as our starting point the beginnings of a national recovery in 1991, there are a
few important trends to note in relation to these drivers of population change, and how
they have operated across the State and amongst counties and regions. Most of the
following trends are noted in the recent report by ESRI ‘Prospects for Irish Regions and
Counties: Scenarios and Implications’ (2018)2 except in relation to the specific point about
international migration which is noted in CSO reports ‘Labour Force and Population
projections’.
• The population has been increasing nationally, with 1.1 million more people in the
State in 2016 than in 1991, representing an average annual growth of 1.4%.
2
Edgar Morgenroth ‘Prospects for Irish Regions and Counties: Scenarios and Implications’ ESRI, January 2018,
p16-19 on ‘Population’.
13• As might be expected, the growth has not been spread evenly over time or amongst
regions. The Mid-East region got a much greater share of the growth
disproportionate to its share of the State’s population, the Mid-West region, of
which Limerick is a part, got a smaller share of the growth disproportionate to its
share. The only regions to grow at a rate greater than the national average over this
period were the Midlands and the Mid-East.
• The variation of changes amongst counties is even more marked than the variation
amongst regions. As noted in this ESRI report (and as referred to above), Limerick
city and county are amongst the Local Authorities to have the lowest rates of
population growth in the State. Also, as noted in the ESRI report, Limerick city and
county account for the second highest drop in the share of the national population
between 1991 and 2016.
• To an extent unlike previous stages of growth, international migration accounted for
a significant component of this increase up until 2006, together with a reduction in
out-migration. This is illustrated in tables showing the factors of change in a 2008
report by CSO 3. As noted in a subsequent report by CSO, estimated net in-migration
peaked in 2007, and for the years 2010 to 2014 there was net out-migration, which
was replaced by net in-migration in 2015 and 2016 but at lower levels than
previously.
• Natural increase was also an important factor in population growth in this recent
period. Natural increase peaked in 2011, reflecting the higher proportion of women
of child-bearing age compared to other European countries.
• Since 2011 natural increase has been declining. On average natural increase has
decreased by 25% since peaking. This is mainly due to the outcome of decline in
fertility rates, already low, to a level where in 2016, it was at 1.81 children per
female, which is below the replacement rate (the replacement rate is 2.1). The long
term trend is of a decline in fertility rates in Ireland, and this trend follows a trend
that is already well established in Europe. This trend is closely associated with the
empowerment of women, the increasing costs of raising and educating children, and
with changing social norms.
• The reduction in natural increase, together with a reduction in net in-migration,
accounts for the slow-down in population increase after 2011 in comparison with
previous inter-censal periods.
• Future population growth is likely to depend highly on inwards migration, as natural
change of the existing population base on its own cannot be guaranteed to deliver
population growth given the low fertility rates and ageing population. It is possible
that with favourable circumstances the fertility rates may increase again, but it is
difficult to gauge what would need to happen to change this trend and then to
estimate where and by how much it would change.
• Both the volatility and importance of migration whether this is internal to the State
or international, makes it difficult to make population projections.
3
CSO Population and Labour Force Projections 2011-2041, Central Statistics Office, Dublin, 2008, table A, p7.
According to the figures in this table, estimated net migration accounts for 48,000 people annually between
2002 and 2006 and 26,000 between 1996 and 2002, whereas the natural increase for these periods in
respective order were 33,000 and 23,000.
143.0 – National and Regional Policy
In reviewing the City and County Development Plans, Limerick City and County Council are
obliged to work within a statutory planning policy framework set down at national level and
as elaborated and refined by regional planning policy. The context within which these plans
are being reviewed and replaced with a consolidated Development Plan for both the City
and the County, is very different from the context in which both the City and County
Development Plans were prepared in 2010, although with some common features.
3.1 – Core Strategy, what it means and its importance
The Planning and Development Act 2000 (as amended) outlines the various elements that a
Core Strategy should contain, including the population targets for the Local Authority area,
as a whole and for each settlement and settlement tier, the expected number of dwelling
units required to meet these targets, where and how much land (in hectares) is proposed to
be zoned, serviced and phased to meet these targets.
The purpose of the Core Strategy is to articulate a medium to longer term quantitatively
based strategy for the spatial development of the area of the planning authority and in so
doing to demonstrate that, the development plan and its objectives are consistent with
national and regional development objectives.
The Core Strategy must provide a transparent evidence-based rationale for the amount of
land proposed to be zoned for residential and allied mixed-use zonings in the
development plan and associated compliance with relevant EU Directives. The Core
Strategy should:
• identify the quantum, location and phasing of development for the plan period
(allowing for market choice) linked back to regional population targets;
• demonstrate how future development supports public transport/existing services
etc.;
• ensure that Councils and key stakeholders assess the needs and priorities for their
area on a plan-led basis in their assessment of existing zoned/serviced land and
new zonings; and
• provide the framework for deciding on the scale, phasing and location of new
development, having regard to existing services and planned investment over the
coming years.
3.2 National Planning Framework
The National Planning Framework (NPF) is the Government’s high-level strategic plan for
shaping the future growth and development of our country out to the year 2040. It is a
framework to guide public and private investment, to create and promote opportunities for
our people, and to protect and enhance our environment - from our villages to our cities,
and everything around and in between. By 2040 there will be roughly an extra one million
people living in our country. This population growth will require hundreds of thousands of
new jobs and new homes. If we fail to plan for this growth and for the demands it will place
on our built and natural environment, as well as on our social and economic fabric, then we
will certainly fail in our responsibility to future generations of Irish men and Irish women.
15The NPF sets out the governing principles behind its strategy and some of the key
mechanisms of implementation that will be brought into play; and a broad framework of
population scenarios for the regions and their key city hubs and their metropolitan spatial
planning areas. The NPF lays out broad parameters for the distribution of growth that needs
to happen by the horizon year of 2040, if growth is to be regionally balanced, economic and
sustainable. These include accessible centres of scale in the regions to counter the
dominance of the eastern and midlands region, and means that Limerick city should be
allowed to grow by 60% by 2040. Another goal is that development of cities and towns
should be compact, with 50% of ‘all new homes that are targeted for the cities’ to be within
the footprint of the settlement in the case of the cities, including Limerick city, and 30% of
all new homes targeted for other urban settlements to be within their footprints. The NPF
envisage that the population of the State could grow by 1.1 million by 2040, but that
allowance should be made for 550,000 new dwelling units. This reflects an assumption that
the average household size will be 2.5 by the target year, and that extra provision should be
made to allow for obsolescence and for the current deficit in housing supply.
The NPF also sets out a range of objectives to strengthen Local Authorities Core Strategies,
including the introduction of a tiered approach to land use zoning, in which for example,
land that is not serviceable during the lifetime of the Development Plan should not be
zoned. The NPF sets out the framework which the Regional Assemblies should incorporate
into their Regional Economic and Spatial Strategies, including ‘key future planning and place
making policy priorities’ for their areas, specifically Metropolitan Area Strategic Plans
(MASPs) for the cities and their surrounding areas, and key enablers for the sustainable
development of these areas. The NPF then contains a range of National Planning Objectives
arranged by theme that apply across the State and are not particular to any region or area.
In summary for Limerick the NPF seeks to grow Limerick City and Suburbs by an additional
56,000 people, with the overall Southern Region, growing to 2 million people, it seeks that
50% of the growth be located built up footprint of the existing city and 30% of the growth
elsewhere, also be within the built up footprint.
The responsibilities of the Regional Assemblies and the Local Planning Authorities are to
flesh out and realise the National Planning objectives and general principles of the National
Planning Framework. The Regional Assemblies are statutorily obliged to prepare ‘Regional
Spatial and Economic Strategies’ (RSES) as a framework for their constituent Local
Authorities’ Development Plans, and consistency with these strategies should be clearly
articulated in the ‘Core Strategies’ of these Development Plans. The RSES also informs the
Local Authorities’ priorities and programmes in executing its various responsibilities, that
complement and inform the Development Plan and which are vital in securing its
development objectives. Local Authorities are statutorily obliged to prepare and keep up to
date ‘Local Economic and Community Plans’ (under the Local Government Reform Act 2014)
and ‘Housing Strategies’ (under Part V of the Planning and Development Act 2000). It is also
recommended that Local Authorities have other strategies that are relevant and up to date,
such as ‘Retail Strategies’ to help inform them and plan for what might be specially complex
and contentious issues.
163.2.1 National Planning Framework ‘Implementation’ and Core Strategies
Chapter 10 concerns ‘Implementation’, and this contains objectives of key importance for
consideration in the formulation of Core Strategies in Development Plans:
• The formation of a State led strategic Land Development Agency to manage and
enhance the potential of the State’s own lands, to deliver on public policy (NPO66).
• The introduction of a ‘Metropolitan Strategic Area Plan’ (MASP) to be formulated in
tandem with the Regional Spatial and Economic Strategies, for the cities and their
surrounding hinterlands, to provide a 12 year planning and investment framework
for high level and long term strategic development issues.
• In connection with the MASPs, an allowance is made for up to 20% of the city’s
phased growth to be accommodated in the Metropolitan area in addition to growth
identified for the Metropolitan area.
• To ensure there is proper integration between spatial use and transport planning
‘statutory arrangements between spatial and transport planning in the Greater
Dublin area will be extended to other cities’ (NPO 69).
• In connection with Development Plans, and directly concerning the Core Strategies
themselves, and the linkages between zoning for development, proposed phasing
and enabling infrastructure:
o NPO71 states a commitment to further develop ‘Core Strategies’:
‘standardised methodologies introduced to ensure a co-ordinated and
balanced approach to future population and housing requirements across
urban and rural areas’.
o Three National Policy Objectives (72a, b and c) require that Planning
Authorities exercise a structured tiered approach to land use zoning.
NPO72a: ‘to differentiate between zoned land that is serviced and zoned
land that is serviceable during the lifetime of the Development Plan’. When
considering lands that require investment in service infrastructure, the
Planning Authority should provide a ‘reasonable estimate of the full cost of
delivery’. When considering zoning of land, if the land is not serviceable
within the lifetime of the Plan, that land should not be zoned for
development.
o Section 28 Guidelines will be issued to enable Local Authorities to apply an
order of priority for development of lands, particularly in the case of
interdependent landholdings (NPO73a). Planning Authorities will use
compulsory purchase powers to facilitate the delivery of enabling
infrastructure to prioritize zoned lands (NPO73b). ‘Planning authorities and
infrastructure delivery agencies will focus on the timely delivery of enabling
infrastructure to priority zoned lands’ (NPO73c).
Another key requirement that should have an important bearing on the Core Strategy is the
requirement to have a Housing Need Demand Assessment (HNDA) under National Policy
Objective 37 (NPO 37), an Objective the details of which are elucidated further below in
Section 2.2.3 ‘Housing’.
173.2.2 – National Planning Framework – Key parameters national population and
employment distribution and other themes
The first set of National Policy Objectives (1 to 3) concern the distribution and composition
of future population and employment growth and how it should be steered, or supported.
National Policy Objective NPO1a states ‘that population and employment growth in the
Eastern and Midlands Regional Assembly area would be at least matched by population and
employment growth in the other two regional assembly areas’. The NPF recognises that
current trends which favour the eastern region at the expense of other important cities and
towns is not sustainable and so planning in a manner in which ‘business as usual’ is the
outcome is no longer good enough.
The NPF also recognises that there is a need for concentration of development in the larger
centres that serve the different regions, and which are themselves connected to each other
with high quality transport and communication corridors. Hence the National Policy
Objectives to create ‘accessible centres of scale to build strong regions’.
The NPF has another series of National Policy Objectives to secure ‘compact and sustainable
growth’. This is against the background of the tendency of towns and cities to expand along
its fringes and peripheral areas in the form of low density urban sprawl , which increases car
dependence and leads to the ‘gradual run-down’ of many of the older areas of towns and
cities.
‘A preferred approach would be compact development that focuses on reusing
previously developed, ‘brownfield’ land, building up infill sites, which may not have
been built on before and either reusing or redeveloping existing sites’.
Hence the following objectives:
NPO 3b to ‘Deliver at least half (50%) of all new homes that are targeted in the five
cities and suburbs of Dublin, Cork, Limerick, Galway and Waterford within their
existing built-up footprints’.
NPO 3c to ‘Deliver at least 30% of all new homes that are targeted in settlements other
than the five cities and their suburbs within their existing built-up footprints’.
The NPF outlines the approaches towards ‘effective regional development’. This contains a
geographical profile of the Regional Assembly areas, ‘key future planning and development
and place making policy priorities’ for the Regional Assembly areas, and ‘key growth
enablers’ focussing on their cities and their cities’ surrounding ‘Metropolitan Areas’. Key
growth enablers can refer to any one of a variety of sectors, which singly or in combination
contain the proven potential to enable the required growth of the area in question to occur,
based on existing resources, commitments and programmes.
3.2.3 – Housing
Section 6.6 of the NPF under Chapter 6 ‘People, Homes and Communities’, deals with
Objectives in relation to housing. The approach of the NPF in relation to the delivery of
housing is clearly set out at the beginning of this section in the form of a set of ‘national
core principles to guide the delivery of housing, at every level of governance’. The first
18Objective (NPO32) in respect of housing is ‘To target the delivery of 550,000 homes by
2040’. This number would not be justified by the additional 1.1 million in population
projected for 2040 if divided by household size (which by 2040 is projected to be 2.5), but it
takes into account the current deficit in housing supply and future obsolescence. The
importance of ensuring housing takes place to support ‘sustainable’ development in line
with infrastructure delivery and to best contribute to place making informs NPO 33 ‘to
prioritize the provision of new homes at locations that can support sustainable development
and at an appropriate scale relative to location’ .
Other objectives in relation to housing concern supporting the provision of life-time
adaptable homes (NPO34); and to ‘increase residential density in settlements through a
range of measures’ (NPO35).
Each Local Authority in turn is required to develop a ‘Housing Need Demand Assessment’
(HNDA), to form a robust methodology that will inform policies and funding initiatives
around housing and associated land requirements for the Housing Strategy and for the
Development Plan (NPO37). The required evidence inputs into the HNDA are in three parts.
They include ‘demographic trends, affordability trends and wider economic trends’;
‘housing stock profile pressures and management issues’ and ‘estimated future housing
need and demand’.
Housing affordability in Limerick is better than in Dublin, Cork and Galway. Median house
prices in Limerick city and county have grown by almost 18% in the year to September 2019,
but remain 18% lower than the national median. Likewise, rent levels are up 6% in Limerick
city in the year to September 2019, but remain 15% below the national average. Rents in
Limerick County, while also rising, are almost 35% below the national average. Meanwhile,
the latest CSO data shows that Limerick is the only Irish city, apart from Dublin, where
disposable incomes are greater than the national average. This means that first time buyers
in Limerick are in a relatively stronger position to borrow to buy a house or apartment than
their equivalents in Dublin. Housing affordability in Limerick impacts on demand and as
many people either return to Limerick for family or work purposes, this impacts on the
demand for housing.
3.3 – Implementation Roadmap for the National Planning Framework
The Department of Housing, Planning and Local Government as guidance for the Regional
Assemblies in July 2018 published the Implementation Roadmap for the National Planning
Framework. The Roadmap seeks to align the current Local Authority population projections
with those of National Planning Framework, to outline governance mechanisms.
The Implementation Roadmap set out figure on a County basis and the following table sets
out the projections for Limerick to 2031.
County Population 2016 Projected Population Projected Population
2026 2031
Limerick 195,000 229,000 – 235,500 246,000 – 256,500
Table 3 – Population Projections for Limerick from the Implementation Roadmap for the
National Planning Framework
19You can also read