Limits on performance and survival of juvenile sockeye salmon (Oncorhynchus nerka) during food deprivation: a laboratory-based study - Oxford ...
←
→
Page content transcription
If your browser does not render page correctly, please read the page content below
Volume 9 • 2021                  10.1093/conphys/coab014

                                                                                                                              Research article

Limits on performance and survival of juvenile
sockeye salmon (Oncorhynchus nerka) during
food deprivation: a laboratory-based study

                                                                                                                                                             Downloaded from https://academic.oup.com/conphys/article/9/1/coab014/6185140 by guest on 13 October 2021
Samantha M. Wilson1, *, Kendra A. Robinson2 , Sarah Gutzmann1 , Jonathan W. Moore1 and
David A. Patterson2

1 Earth to Ocean Research Group, Simon Fraser University, 8888 University Drive, Burnaby, British Columbia V5A 1S6, Canada
2 Fisheries and Oceans Canada, Cooperative Resource Management Institute, School of Resource and Environmental Management, Simon Fraser

University, Burnaby, British Columbia V5A 1S6, Canada
*Corresponding author: Earth to Ocean Research Group, Simon Fraser University, 8888 University Drive, Burnaby, British Columbia V5A 1S6,
Canada. Email: swilson471@gmail.com

..........................................................................................................................................................

Long-distance migrations can be energetically demanding and can represent phases of high mortality. Understanding
relationships between body condition and migratory performance can help illuminate the challenges and vulnerabilities
of migratory species. Juvenile anadromous sockeye salmon (Oncorhynchus nerka) may migrate over 1000 km from their
freshwater nursery habitats to estuary and ocean feeding grounds. During the period corresponding to the seaward migration
of sockeye salmon, we held smolts in the laboratory to ask the following: (i) Does non-feeding migration duration influence
prolonged swim performance and survival? (ii) What are the relationships between individual body condition and swim
performance and survival? Wild sockeye salmon were intercepted during their migration and held without food for up to
61 days to represent the non-feeding freshwater migration and the extremes of poor estuary habitat. We conducted 40 sets
of prolonged swim trials on 319 fish from 3 treatment groups that represented entrance to the marine environment on (i) an
average,(ii) a delayed and (iii) a severely delayed migration schedule. Experimentally controlled freshwater migration duration
did not impact swim performance or survival. Swim performance decreased concomitant with condition factor, where smolts
with a Fulton’s condition factor of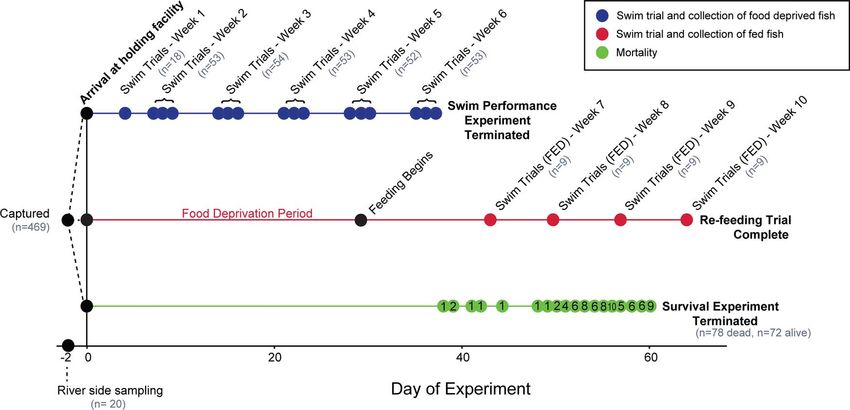
Research article                                                                                           Conservation Physiology • Volume 9 2021
..........................................................................................................................................................

Introduction                                                                   over 1000 kilometres and can take anywhere between a
                                                                               few days to several weeks to complete (Johnson and Groot,
Long-distance migrations are often challenging life history                    1963; Groot and Margolis, 1991; Quinn, 2005; Clark et al.,
phases with higher mortality rates compared to stationary                      2016). Many authors suggest that during this time, smolts
phases (Sillett and Holmes, 2002; Alerstam et al., 2003;                       do not feed extensively and instead primarily use endogenous
Klaassen et al., 2014; Lok et al., 2015; Clark et al., 2016).                  energy stores (Stefansson et al., 2003; Quinn, 2005; Hinch et
Migratory success or failure may be controlled by variation in                 al., 2006), although it should be noted that direct empirical
individual condition and energetics within and across popula-                  evidence is scant and the evidence that has been recorded
tions. For instance, body condition can be a strong indicator                  is mixed (Larsson et al., 2011). Indeed, endogenous energy
of migration success (Drent et al., 2003; Duijns et al., 2017),                stores of long-distance migrating smolts can approach very
as long-distance migrants often rely heavily on endogenous                     low levels (Rondorf et al., 1985; Stefansson et al., 2003).
energy stores to fuel migrations (McKeown, 1984; Dingle,                       For example, Rondorf et al. (1985) found that whole body

                                                                                                                                                             Downloaded from https://academic.oup.com/conphys/article/9/1/coab014/6185140 by guest on 13 October 2021
1996) and could be a potential tool for predicting migra-                      lipids of hatchery-origin Chinook salmon (Oncorhynchus
tion success. For example, red knots (Calidris canutus rufa)                   tshawytscha) migrating in the Columbia River decreased from
with higher body condition (size-corrected mass) had faster                    4.3% to 1.4% (a 65% decline) during the ∼700 km migration
migration to breeding grounds, higher migration success (sur-                  between the release site and the estuary and that survival was
vival), and were more likely to have bred successfully, than                   higher for fish that had higher percent body lipid at the time of
those of lower body condition (Duijns et al., 2017). Lower                     their release (Rondorf et al., 1985). Thus, endogenous energy
quality individuals are also more likely to be predated during                 levels may decrease to very low levels during freshwater
migration (Dierschke, 2003; Tucker et al., 2016). Thus, body                   migration.
condition at the beginning of the migration can influence
subsequent performance, thereby driving carryover effects                         The physiology and energetic condition of individual fish
across life stages and habitats. Understanding the relationship                could control their performance during migration. Under typ-
between body condition and the survival of migrating animals                   ical migration conditions, migrating fish rely primarily on fats
could help clarify their limits and vulnerabilities to environ-                and proteins for fuel (Driedzic and Hochachka, 1978; Brett
mental or anthropogenic disturbances in habitat or migratory                   and Groves, 1979). Fish migrants also commonly use protein
conditions.                                                                    during periods of food deprivation (Persson et al., 2018).
                                                                               However, during periods of starvation, protein catabolism can
    While energy and migration success are presumably related                  compromise muscle tissue and likely comes at the expense
for many populations (Drent et al., 2003), these relationships                 of performance (Moon and Johnston, 1980; Sullivan and
remain relatively poorly described for many important migra-                   Somero, 1983; Black and Love, 1986; Kiessling et al., 1990;
tory species. It is possible that there is an abrupt threshold,                Martinez, 2003). Thus, prolonged swim performance should
where performance remains robust until physical or energetic                   decline as protein content declines. Lipid levels of 1.4%–2.0%
condition decreases to a threshold at which point perfor-                      are thought to be the lowest levels possible, as the remaining
mance decreases dramatically. Alternatively, the relationship                  lipids are likely structural phospholipids of cell walls and
could be more linear, where a unit decrease in condition would                 are essential for survival (Castledine and Buckley, 1980).
result in a proportional decrease in performance (Huggett,                     Indeed, Pacific salmon smolts are rarely observed to have lipid
2005; Ficetola and Denoël, 2009). It is also possible that there               levels lower than 2.0% in the wild (DFO unpublished data),
is not a single condition metric that accurately predicts perfor-              suggesting that this may be a threshold for survival. Therefore,
mance given the number of different physiological processes                    migration success seems likely to be positively related to body
that support a single type of performance. Understanding                       condition, especially lipid levels. Furthermore, both condition
the form of condition–performance relationships, and the                       and ionoregulation could shift through time during migration
thresholds they may contain, is important for predictions                      (Berggren and Filardo, 1993; Bassett et al., 2018) and affect
of migration success. For example, identifying an energetic                    swim performance and survival during initial transfer to
condition–performance threshold could help identify the pro-                   saltwater. Thus, the duration of freshwater migration could
portion of individuals in a population that may be at risk of                  also influence swim performance and survival upon transition
not completing their migration. Such thresholds could also                     to saltwater.
be used to understand the vulnerabilities of different popu-
lations to changes in migratory conditions, such as anthro-                       It has been proven challenging to link observed changes
pogenic flow alteration that results in slowed migration rates                 in physical or energetic condition during migration to per-
(Raymond, 1968, 1979).                                                         formance or survival. Few studies have examined swim per-
                                                                               formance of salmon smolts in relation to condition (Bams,
   Juvenile Pacific salmon (Oncorhynchus spp.) complete                        1967; Snyder, 1980; Persson et al., 2018). More have stud-
long-distance, and sometimes energetically expensive, migra-                   ied condition-dependent survival, but mostly with hatch-
tions from their natal rearing lakes and streams to estuarine                  ery fish in a laboratory setting (LeBrasseur, 1969; Connolly
and ocean feeding grounds (Brett, 1995; Hinch et al., 2006).                   and Petersen, 2003; Simpkins et al., 2003, 2004; Ferguson
These freshwater migrations range in distance from tens to                     et al., 2010) with several attempting to infer condition and

..........................................................................................................................................................
2
Conservation Physiology • Volume 9 2021 Research article
..........................................................................................................................................................
survival from natural settings (size: Ricker, 1954; Ward et al., nine different fish from this fed group completed swim
1989; Henderson and Cass, 1991; proximate body condition: performance trials each week for five weeks to determine
Gardiner and Geddes, 1980; Biro et al., 2004; Finstad et al., whether swim performance could be recovered after a
2004). Thus, there is a need for robust laboratory studies of period of food deprivation. The re-feeding experiment would
the relationship between condition, performance and survival ensure that energetic condition was the main factor that
of out-migrating wild salmon. changed during holding and that a decrease in condition
was related to a decrease in swim performance, rather
Here we quantified the relationship between freshwater than an artefact of holding time. We compared swim
migration duration, body condition, swim performance and performance and survival between the three migration
survival in a wild population of migratory sockeye salmon duration treatment groups and found no difference between
(O. nerka) held in a laboratory environment. Specifically, groups. Since there was no difference between groups, we
we asked the following questions: (i) How does duration of measured and calculated a variety of energy condition
Downloaded from https://academic.oup.com/conphys/article/9/1/coab014/6185140 by guest on 13 October 2021
freshwater migration impact swim performance and survival? metrics (i.e. energy density, lipid content, moisture content,
(ii) What are the relationships between energetic and phys- protein content and triglycerides (TAG)) for the 7D group,
ical condition and (a) prolonged swim performance or (b) a subset of fish swam in experiment 1, and all the fish that
survival? We found that freshwater migration duration did died to determine the relationship between condition and
not influence prolonged swim performance or survival. We prolonged swim performance (experiment 2) and survival
compared energetic condition metrics (i.e. proximate body (experiment 3).
composition and derived energy values) and physical condi-
tion (i.e. size, weight and condition factor) and found that
condition factor best predicted prolonged swim performance, Fish collection
whereas energy density and protein content were predictive of
survival. The swim performance threshold occurred approx- Wild juvenile sockeye salmon were caught during their sea-
imately five weeks before the survival threshold, suggesting ward migration at the outlet of Chilko Lake (51.63 ◦ N,
that swim performance may be a more biologically relevant 124.14 ◦ W). Chilko Lake is an indicator population for man-
endpoint for predicting survival in wild juvenile salmon. As agement of Fraser River sockeye salmon and is one of the most
a result, condition factor could be a useful tool for under- productive sockeye salmon lakes in the Fraser River basin,
standing how changes to freshwater habitat, which impact producing an average of ∼30 million sockeye salmon smolts
fish condition, could affect survival during seaward migration annually (running average, since 1994). The predominate age
and the early marine life stage of salmon. class of Chilko Lake smolts is age 1; however, Chilko Lake
produces some 2-year-old smolts typically ranging from 2%
to 10% of the total outmigration cohort. Only 1-year-old
fish (i.e. fish with fork lengths (FLs) of less than 110 mm)
Methods were used in this study. Migration takes 4–12 days as smolts
travel the ∼700 km from Chilko Lake through the Chilko,
Overall study approach Chilcotin and Fraser Rivers to the Strait of Georgia (Clark
et al., 2016; Stevenson et al., 2019). It takes an additional
We held juvenile sockeye salmon smolts without food 30–45 days before salmon leave inland coastal waters after
for 61 days in three treatment groups modelled after traversing the Strait of Georgia and Johnstone Strait (Clark et
freshwater migration durations of the Chilko Lake sockeye al., 2016; Stevenson et al., 2019). Previous work has shown
salmon population used in this study: (i) transferred to that Chilko sockeye salmon smolts migrate at a rate of 30–
saltwater after 7 days, 7D group, which matches closely 220 km/day in freshwater and 10–25 km/day in the marine
with average migration duration of Chilko Lake salmon environment along the east coast of Vancouver Island (Welch
smolts; (ii) transferred to saltwater after 14 days, 14D group, et al., 2009; Clark et al., 2016; Stevenson et al., 2019).
representing a delayed migration; and (iii) transferred to
saltwater after 21 days, 21D group, representing a severely Juvenile sockeye salmon were captured by dip net on the
delayed migration (Clark et al., 2016; Stevenson et al., evening of 3 May 2017 at the Chilko smolt enumeration
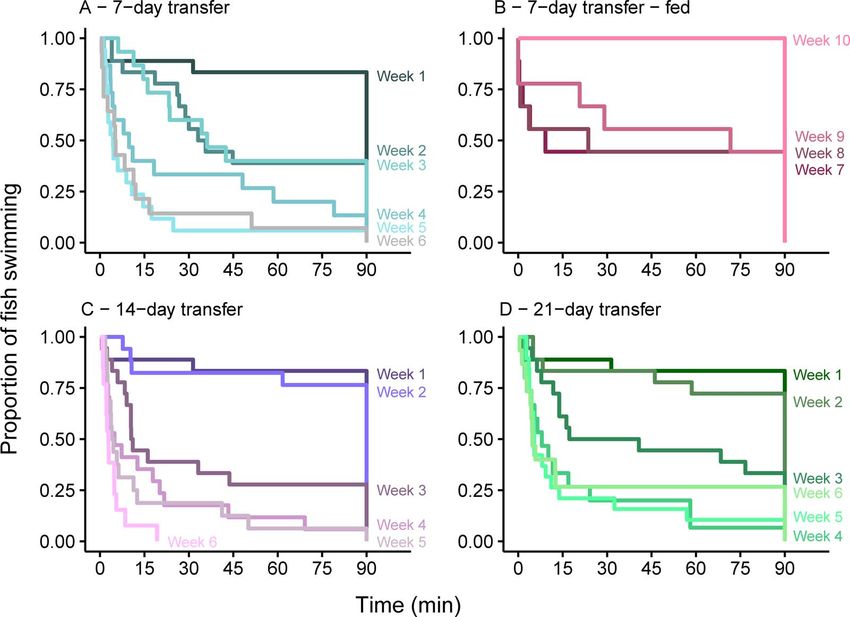
2019) (Fig. 1). Different smolts from each of the three fence, a full fence weir managed by Fisheries and Oceans
treatment groups completed a prolonged swim performance Canada Fraser River Sockeye Stock Assessment Program.
challenge each week for six weeks, until, for two successive Twenty fish were euthanized on site with an overdose of
weeks, >80% of fish could not finish the trial (swim MS222 (0.5 g/L) and preserved at −80 ◦ C for energetic anal-
performance endpoint). After the swim trials were completed, ysis. Remaining fish were held overnight in an aerated 1000-
we continued to observe fish for mortality, and once L holding tank (5.8–7.5 ◦ C; 80.1%–109.9% O2 saturation)
half of the remaining fish being held had died (n = 78, and the next day were driven ∼12 hr to the holding facility
survival endpoint) the experiment was terminated. After at Simon Fraser University in Burnaby, BC. The present study
28 days of food deprivation, we began feeding a subset was conducted in accordance with the Canadian Council on
of the 7D treatment group to monitor swim performance Animal Care, as administered by Simon Fraser University
during recovery from starvation (n = 36). Approximately (1238B-17).
..........................................................................................................................................................
3Research article Conservation Physiology • Volume 9 2021
..........................................................................................................................................................
Downloaded from https://academic.oup.com/conphys/article/9/1/coab014/6185140 by guest on 13 October 2021
Figure 1: Experiment timeline, where fish were captured and a subset were sampled at the river (Day -2), before transportation to a holding site
on Day 0. Fish were distributed evenly among three treatment groups (7D, 14D, 21D) and among three tanks within each group, for a total of
nine tanks. Fish either were food deprived and completed a swim performance trial each week for 6 weeks (blue), held for 28 days before
feeding for 2 weeks and then completed swim performance trial weekly for 4 weeks (pink) or held without food until death (green). Fish were
randomly selected for swim trials across tanks from each treatment group for the swim performance experiment. A randomly selected subset
from the 7D group were moved to a different tank and fed for the re-feeding trial. Grey ‘n’ indicates the number of different fish that completed
the swim trial each week. Black ‘n’ indicates the daily mortality in the survival experiment.
Fish holding consistent with ambient May/June Fraser River water temper-
ature (MacDonald et al., 2019). A water pump temporarily
Smolts were divided into the three treatment groups, 7D went out on 6 June 2017 and water temperature increased
(n = 179), 14D (n = 180) and 21D (n = 182), and were ran- in all tanks to 13–14.5 ◦ C for ∼14 hrs, no mortalities were
domly assigned to three tanks per treatment, thus sockeye recorded resulting from that event and 14.5 ◦ C is within the
salmon smolts were held in nine oval holding tanks (200 L) range of temperatures experienced by smolts in the natural
for up to 64 days (61 days for survival experiment, 64 days
environment (MacDonald et al., 2019). Smolts were held in
for fed treatment; 4 May–7 July 2017; Fig. 1) at a density
12:12 hr light:dark conditions.
of 2 L per minute. Holding tanks were covered Holding tanks were checked at least twice daily. Dead fish
with plexiglass, half of which was black to allow for shad- were removed, FL (mm) and weight (g) were recorded and
ing in the tanks. A single air stone was used to enhance fish were frozen at −80 ◦ C for later analysis. Any distressed
oxygen saturation, which never decreased below 90% in fish, characterized by gasping at the water surface or loss
any tank (Handy Polaris, OxyGuard Internation A/S, Farum, of equilibrium, were euthanized with an overdose of MS222
Denmark). Smolts were originally held in dechlorinated and (0.5 g/L). Food was withheld from fish in the nine tanks
UV-sterilized freshwater and were transitioned to saltwater at until approximately half of the fish had died. Remaining fish
the three respective time points (7D, 14D, 21D). Fish in each were euthanized with an overdose of MS222 (0.5 g/L). All
group were transitioned gradually over 36 hrs to saltwater fish were measured, weighed and frozen at -80 ◦ C for later
at a similar concentration to what they would experience analysis.
during migration through the Fraser River estuary and coastal
Vancouver Island (28–30 ppt; Thomson, 1981). Saltwater was
made to a concentration of 28–30 ppt (Instant Ocean® Sea
Re-feeding
Salt) and allowed to sit for 24 hrs before being added to the After 28 days of food deprivation, we transferred a subset
circulation system. As it was being recirculated among tanks, of 36 smolts from the 7D group to a 150-L holding tank
saltwater was filtered through carbon filters. Approximately and began feeding them (7D-fed) twice daily with commercial
30% of saltwater was replaced every 2 to 3 days to keep pellets (EWOS Canada Ltd Surrey, Canada) in excess (∼2%
ammonia concentrations below 2 ppm. Water temperature body weight). Nine different fed fish were swum each week
was held constant with a mean of 10.7 ◦ C (7.8–12.9 ◦ C) after 2, 3, 4 and 5 weeks of feeding.
..........................................................................................................................................................
4Conservation Physiology • Volume 9 2021 Research article
..........................................................................................................................................................
Swim flume swim performance data are available in the supplemental
information (Fig. S1). The evening before each swim trial, 18
Prolonged swim performance tests were completed in a fixed fish were removed from their holding tanks and individually
velocity flow-through swim flume (14-cm wide, 25-cm tall, marked using a fin clip. Fish were anaesthetized in MS222
240-cm long; a plexiglass insert was used to narrow the swim (0.05 g/L), and the tips of the ventral and/or anal fins were
arena to 9-cm wide, 15-cm tall, 142-cm long to increase clipped, enabling unique identification of each fish. Fish were
water velocity), where water was pumped into the front of recovered overnight in two 150-L aquarium with 9 fish in
the flume, flowed through a honeycomb structure to increase each tank. For fish that were being fed, food was withheld
laminar flow, and through a mesh net out the back into a 24 hrs before the swim trial was completed. We chose to cease
recirculating tank. At the farthest end of the flume, a vertically swim trials after 6 weeks as >80% of the different fish swum
sliding plexiglass door could be adjusted to ensure the water in each trial could not finish the first test in 2 consecutive
level in the flume was at 15 cm. A black plastic cover provided weeks (weeks 5, 6; swim performance endpoint).
Downloaded from https://academic.oup.com/conphys/article/9/1/coab014/6185140 by guest on 13 October 2021
shade in the centre of the flume and lights in front and behind
the shaded region were used to encourage fish to swim in the For each test, 9 individually marked fish were placed in the
shaded middle of the swimming arena where the flow was swim flume for a 12 min acclimation period at a flow rate of
most consistent. Flow was measured at the top, middle and ∼0.085 m/s (∼1 BL/s). Following the acclimation period, flow
bottom of the water column in both salt and freshwater. rate was steadily increased to 0.50 m/s (4.5–6.4 BL/s) over a
period of 12 min. Fish that did not swim before the flume
Prolonged swimming experiment reached full flow were gently prodded three successive times
with a blunt instrument to encourage swimming. If they still
Of the three types of swim performance tests (burst swim per- refused to swim, they were removed from the study. Once at
formance (6
Research article
Table 1: Changes in sockeye salmon smolt morphometrics, energy density and proximate body constituents during the experiment for fish collected at Chilko River sampling site, for fish
from the 7-day saltwater transfer group and for fish that had died during experiment
River Week 1 Week 2a Week 3 Week 4 Week 5 Week 6 Deathsb
sampling
Completed trial? (Y/N) NA N Y N Y N Y N Y N Y N Y NA
Sample size 20 3 15 11 7 9 6 13 2 16 1 13 1 78
FL (mm) 87.2 83.0 86.7 82.5 87.3 84.4 84.0 86.9 86.0 85.2 88.0 86.4 85.0 81.8
(SE) ±0.9 ±1.5 ±1.3 ±1.6 ±1.5 ±1.5 ±2.4 ±1.6 ±1.0 ±1.2 ±1.3 ±0.6
Weight (g) 4.91 4.84 4.97 3.72 4.55 3.86 3.82 3.97 4.31 3.63 4.14 3.68 3.87 2.81
(SE) ±0.15 ±0.09 ±0.22 ±0.23 ±0.26 ±0.25 ±0.34 ±0.21 ±0.26 ±0.17 ±0.16 ±0.06
Fulton’s condition 0.74 0.85 0.76 0.65 0.68 0.63 0.64 0.60 0.68 0.58 0.61 0.57 0.63 0.51
factor (SE) ±0.01 ±0.06 ±0.02 ±0.01 ±0.01 ±0.01 ±0.01 ±0.01 ±0.17 ±0.01 ±0.01 ±0.01
Energy density (MJ/kg) 4.29 4.39 4.27 4.85 4.60 4.44 4.49 3.96 4.37 4.00 4.18 3.83 4.00 2.82
(SE) ±0.06 ±0.06 ±0.08 ±0.12 ±0.07 ±0.09 ±0.21 ±0.06 ±0.20 ±0.08 ±0.06 ±0.02
Water (% wet weight) 78.77 77.89 77.92 74.62 75.48 76.39 76.34 78.51 77.20 77.82 76.74 78.49 77.87 82.96
(SE) ±0.20 ±0.24 ±0.27 ±0.57 ±0.33 ±0.42 ±0.70 ±0.25 ±0.29 ±0.41 ±0.25 ±0.15
Protein (% wet weight) 16.14 17.12 17.49 19.68 19.22 18.13 17.91 16.40 17.59 16.76 18.49 15.86 17.05 11.32
(SE) ±0.15 ±0.17 ±0.14 ±0.49 ±0.29 ±0.31 ±0.56 ±0.23 ±0.04 ±0.36 ±0.22 ±0.10
Lipid (% wet weight) 2.88 2.62 2.09 2.46 2.04 2.21 2.45 1.84 2.31 1.77 1.29 1.78 1.57 1.49
(SE) ±0.16 ±0.25 ±0.15 ±0.21 ±0.11 ±0.15 ±0.32 ±0.10 ±0.58 ±0.05 ±0.09 ±0.03
TAG (% lipid) 24.9 46.7 39.6 28.8 21.8 17.4 14.2 16.9 41.3c 15.1c NA 16.9c 24.6 21.1c
(SE) ±2.6 ±9.8 ±4.3 ±4.3 ±3.6 ±1.7 ±4.3 ±1.3 ±6.5 ±1.3 ±1.4 ±1.1
a
Fish were transferred to saltwater 3 days before Week 2 sampling/swim performance trials.
b
Deaths that occurred before survival endpoint was reached.
c
One TAG sample was removed because a precipitate formed, thus TAG was calculated from a n-1 sample size for that group.
..........................................................................................................................................................
Conservation Physiology • Volume 9 2021
..........................................................................................................................................................
Downloaded from https://academic.oup.com/conphys/article/9/1/coab014/6185140 by guest on 13 October 2021Conservation Physiology • Volume 9 2021 Research article
..........................................................................................................................................................
to all lipid content, as TAG is the main form of stored lipids stituted with isopropanol, was also used to ensure chloro-
in vertebrates (Driedzic and Hochachka, 1978), and therefore form did not affect absorbance. Average absorbance was
their depletion could represent a decrease in energy condition measured at 530–550 nm using a FLUOstart Omega mul-
(Driedzic and Hochachka, 1978; Cleary et al., 2012). timode microplate reader (BMG Labtech, Ortenberg, Ger-
many). Final TAG values were reported in percent TAG of
Proximate body analysis was completed according to lipid (g TAG/g lipid∗100). TAG samples from 5 fish were
methods of Crossin (2003) that were adapted from Higgs excluded from analyses (2 from 7D group: 1 from week 4 and
et al. (1979) and Bligh and Dyer (1959). Briefly, whole fish 1 from week 5; 2 from 7D-fed group in week 9; and 1 that
were homogenized in a SPEX SamplePrep 2010 Geno/Grinder died during the experiment), as they developed a precipitate
(SPEX, Metuchen, NJ) at 1500 rpm for 2-min. intervals when added to the isopropanol and the solids interfered with
until completely homogenized. A sample of 0.3 g plus/minus absorbance, leading to an overestimate of TAG concentration.
symbol as in percent water and ash sections 0.015 g of
Downloaded from https://academic.oup.com/conphys/article/9/1/coab014/6185140 by guest on 13 October 2021
homogenate was weighed for each of lipid, water and ash Calculations: We calculated smolt condition parameters:
analysis. Together, lipid, water and ash percentages can be
used to calculate protein content and energy density. Fulton’s condition factor (K) was calculated using
equation (1):
Lipid extraction: A mixture of methanol, chloroform and
water in ratio of 1:1:0.48 was added to the sample and Wt
K= ∗ 100, (1)
homogenized. Samples were filtered with a Büchner funnel FL3
and the supernatant was decanted into a graduated cylinder.
Once biphasic layers of chloroform–lipid and methanol– where weight (Wt) is in grams and fork length (FL) is in
water formed, the volume of the lipid–chloroform layer was centimetres.
measured and the top water–methanol solution was aspirated
The percent of whole body protein (P) was calculated from
away. A 100-μL sub-sample of the lipid–chloroform layer was
percentages of water (W), lipids (L) and ash(A) (Hendry et al.,
removed and stored at −80 ◦ C for determination of TAG
2000) using equation (2):
concentration. The remaining chloroform–lipid solution was
pipetted into pre-weighed aluminium boats, and the remain-
ing lipid was weighed when chloroform had completely evap- P = 100 − (W + L + A) . (2)
orated. All samples were analysed in duplicate, and only
samples that differed by less than 0.5% were retained. Lipid
values are reported in percent lipid of total fish wet mass.
Energy density (D; MJ/kg) can be calculated from the
Percent water: Whole body moisture content was deter- amount (g/kg) of lipid (l) and protein (p) using equation (3):
mined by drying a 0.3 g ± 0.015 g sample of homogenate in
an oven overnight (16–20 hr) at 100 ◦ C. Samples were then D = l ∗ 0.0362 + p ∗ 0.0201, (3)
placed in a desiccator for 15 min and weighed. All samples
were analysed in duplicate, and only replicates that differed
by less than 1.5% were retained. Body moisture values are where 0.0363 and 0.0201 are the energy densities of lipid and
reported in percent water of total fish wet mass. protein, respectively (Brett and Groves, 1979).
Ash: A 0.3 g ± 0.015 g sample of each homogenate was
transferred to the furnace and combusted at 600 ◦ C for Statistical analyses
2.5 hrs. Samples were placed in a desiccator for 15 min
and then weighed a final time. All samples were analysed in Survival analysis was used to compare prolonged swim per-
duplicate, and only samples that differed by less than 0.5% formance or survival among the three treatment groups: 7D,
were retained. 14D, 21D. Failure time, or survival analysis, is used to com-
pare groups of right-censored data (Therneau and Grambsch,
Triglyceride: TAG concentration was determined using a 2000). Swim trials were a form of right-censored data, as
colorimetric assay kit (Cayman Chemicals, Ann Arbour, MI, trials were ended after 90 min and thus a fish could have
# 10010303). Briefly, the 100-μL sub-samples of the lipid– continued to swim for 1 min or several more hours and this
chloroform layer were thawed and chloroform was evap- information was lost. A Cox proportional hazards model
orated using nitrogen gas (15 PSI). Samples were reconsti- was used to determine significance of the effect of treatment
tuted with isopropanol, vortexed for 15 sec and incubated group on swim time or survival. Analysis of variance was
at room temperature for 1 hr. Ten microlitres of either TAG used to compare each physical variable (i.e. FL, weight and
standard (0, 3.125, 6.25, 12.5, 25, 50, 100, 200 mg/dl) condition factor) across 7D, 14D and 21D treatment groups
or sample were assayed in duplicate. Note that the stan- to determine if variables differed across groups. Post hoc
dard was prepared with isopropanol. A chloroform blank, Bonferroni pairwise tests were used to compare physical and
in which 100 μL of chloroform was evaporated and recon- energetic condition variables between fish that were dead or
..........................................................................................................................................................
7Research article Conservation Physiology • Volume 9 2021
..........................................................................................................................................................
Table 2: Model comparison for generalized linear models predicting swim success/failure for 7D group
K Log likelihood AIC ωAIC
Condition factor 2 −44.07 0.00 0.71
Condition factor + TAG 3 −44.03 2.06 0.25
TAG + weight 3 −46.14 6.27 0.03
Weight 2 −48.83 9.52 0.01
TAG + FL 3 −51.38 16.76 0.00
TAG 2 −52.48 16.82 0.00
Downloaded from https://academic.oup.com/conphys/article/9/1/coab014/6185140 by guest on 13 October 2021
Protein content + FL 3 −53.83 21.67 0.00
Energy density + FL 3 −53.89 21.77 0.00
Protein content 2 −55.25 22.37 0.00
Energy density 2 −55.32 22.50 0.00
Intercept 1 −57.29 24.34 0.00
Lipid content 2 −56.65 25.16 0.00
FL 2 −56.68 25.21 0.00
Lipid content + FL 3 −55.78 25.55 0.00
Moisture content 2 −56.98 25.82 0.00
Moisture content + FL 3 −55.97 25.93 0.00
TAG = percent triglycerides of lipid, FL = fork length (mm), AIC = difference in AIC between models, ωAIC = Akaike weight of model. FL, weight and condition factor
were determined from fish before they were frozen; n = 90.
alive at the end of the survival experiment (Table S3). We water, percent protein and TAG) in 16 models (Table 2).
calculated a Bonferroni correction (0.05/8 tests) and applied For the survival model, we used energetic variables from all
a significance level of α = 0.00625. three groups combined and compared 16 models, as with
the swim performance model (Table 3). All variable combi-
We used generalized linear models to test specific hypothe- nations, except those that were highly correlated (correlation
ses of the relationship between energetics and swim per- coefficient, >0.6; Fig. S4) or not independent (i.e. condition
formance and survival. Use of a generalized linear model factor was not independent for length or weight, since it is
resulted in some loss of data precision [data were compressed calculated from length and weight), were used in models. All
to either ‘completed’ trial (finished 90 min swim trial) or variables were standardized and centred. Model comparison
‘failed’ trial (swam for less than 90 min of swim trial), was completed using Akaike Information Criterion corrected
resulting in loss of individual swim time], at the benefit of for small sample sizes (AICc ), where models withConservation Physiology • Volume 9 2021 Research article
..........................................................................................................................................................
Table 3: Model comparison for generalized linear models predicting swim failure/death for all treatment groups combined
K Log likelihood AIC ωAIC
Energy density 2 0.00a 0.00 0.37
a
Protein content 2 0.00 0.00 0.37
Protein content + FL 3 0.00 a
2.09 0.13
Energy density + FL 3 0.00 a
2.09 0.13
Moisture content 2 −4.70 9.39 0.00
Moisture content + FL 3 −4.64 11.38 0.00
Downloaded from https://academic.oup.com/conphys/article/9/1/coab014/6185140 by guest on 13 October 2021
Lipid content 2 −59.93 119.87 0.00
Lipid content + FL 3 −59.86 121.82 0.00
Condition factor + TAG 3 −68.84 139.80 0.00
Condition factor 2 −76.52 153.04 0.00
TAG + FL 3 −81.48 165.07 0.00
TAG 2 −83.33 166.67 0.00
TAG + weight 3 −82.85 167.82 0.00
Weight 2 −90.46 180.91 0.00
Intercept 1 −91.73 181.40 0.00
FL 2 −90.84 181.67 0.00
a
Energy density and protein content of fish separate perfectly allowing for probabilities of 0 or 1. As a result model estimates of confidence intervals approach infinity.
TAG = percent triglycerides of lipid, FL = fork length , AIC = difference in AIC between models, ωAIC = Akaike weight of model. FL, weight and condition factor were
determined from fish before they were frozen; n = 133.
Results increase in energy density (4.00 MJ/kg to 4.84 MJ/kg) due
to an increase in lipid content (1.77% to 4.28%), as protein
Food deprivation and individual attributes content stayed relatively stable. TAG levels also increased
from 15% in week 5 at the start of feeding to 54% TAG of
Wild sockeye salmon smolts kept for up to 61 days without
lipid (Table S2).
food decreased in condition factor, energy density and lipid
and protein content, and increased in water content through-
out the period of food deprivation. Between collection in the Experiment 1: migration duration and swim
river and termination of the experiment (61 days), smolts
performance/survival
(both alive and dead at the end of the experiment) lost an
average of 1.74 g (35% of initial body weight), resulting Swim performance decreased equally for all unfed groups
in a 28% decrease in Fulton’s condition factor (K) (0.74 to with >80% of fish not being able to finish the swim test
0.53) and a 34% decrease in energy density (4.29 MJ/kg to after greater than four weeks of food deprivation (based on
2.83 MJ/kg). Lipid values decreased on average from 2.88% 283 fish in 32 trials). Twenty-one smolts (7.4%) would not
to 1.49%, and protein content decreased from 16.14% to swim in the flume, instead falling to the back of the flume
11.41%. TAG did not change, shifting from 25% of lipid to and remaining there during the acclimation period (Table S1).
22% of lipid. These fish were removed from the study. Fish that were
included in the swim trials swam actively in the flow, and
Shifts in body energy metrics and condition factor were generally did not exhibit any ‘cheating’ behaviours such as
due to the experimental treatments of food deprivation rather swimming near the front of the flume where current was
than an artefact of holding, given that fish condition metrics more irregular or drifting behind another fish. More fish
returned to pre-experiment levels within 3 to 4 weeks for the completed the trial in week 1 (83%), compared to week 6
7D-fed group that were food deprived for 28 days (Fig. 2). (12%) (Figs 3 and 4). When swim performance was compared
Over the 28 days of re-feeding, 7D-fed fish almost doubled across the three treatment groups (timing of switch to salt-
their initial average weight of 3.63 g in week 5, growing to an water) using Cox proportional hazards (weeks 2–6, week 1
average of 6.89 g and had begun to grow in length (∼10 mm), was not included in this analysis), the hazard rate (i.e. effect
which led to a 60% increase in Fulton’s condition factor (0.5 size) was not significantly affected by group (Wald test = 1.35,
to 0.8). Fish also recovered energetic condition with a 20% df = 2, P = 0.5). Swim trials were terminated in week 6, because
..........................................................................................................................................................
9Research article Conservation Physiology • Volume 9 2021
..........................................................................................................................................................
the swimming endpoint had been exceeded (more than two
successive weeks where >80% of fish failed the trial). Fish
were held for an additional three weeks, until half of the
remaining fish had died (50% mortality, survival endpoint).
There were no differences in mortality across all three groups
(Wald test = 1.92, df = 2, P = 0.4). Despite a decrease in over-
all physical and energetic condition no mortalities occurred
during or close to the transfer of smolts to saltwater. Groups
did not differ in FL (ANOVA, df = 2, F-value = 0.895, P = 0.41)
and weight (ANOVA, df = 2, F-value = 2.956, P = 0.05).
Downloaded from https://academic.oup.com/conphys/article/9/1/coab014/6185140 by guest on 13 October 2021
Experiment 2: prolonged swimming and
condition
Concomitant with a decrease in swim performance, condition
decreased throughout the swim trials. Since swim perfor-
mance did not differ among groups, we determined the rela-
tionship between swim performance and condition metrics
using data from the 7D group (7D, n = 108; Table 1). Over
the 6 weeks that the swim trials were completed, smolts from
the 7D transfer group lost an average of 1.25 g (25% of
initial body weight), resulting in a 26% decrease in Fulton’s
condition factor (K) (0.77 to 0.57) and 11% decrease in
energy density (4.29 MJ/kg to 3.83 MJ/kg). Lipid values
decreased on average from 2.20% to 1.74%, protein from
17.42% to 15.94% and TAG from 41% of lipid to 17% of
lipid (Table 1, Table S4).
Grouped across weeks, fish that completed the swim test
had 14% higher condition factor (0.71 complete vs. 0.61
incomplete), higher energy density (4.39 MJ/kg complete vs.
4.20 MJ/kg incomplete) and higher protein, lipid and TAG
content, compared to those that did not complete the swim
test (Fig. 5). We compared generalized linear models using
AICc to determine which set of energetic variables best pre-
dicted whether fish completed the 90 min swim test or failed
the test (stopped swimming before 90 min) (Tables 2 and 4).
Energetic variables were highly correlated (Fig. S4). We found
that the most parsimonious model predicting completion of
the swim test included only condition factor as a predictor
variable (AIC < 2; Fig. 6, left). This model was followed by
one that included condition factor and TAG (AIC = 2.06).
We used k-fold model validation to determine that the top
model accurately predicted whether a fish would pass or fail
the swim test ∼79.5% of the time.
Swim performance rebounded in 7D-fed group confirming
Figure 2: Physical and energetic condition variables changed that the manipulation of energy levels was the determinant
throughout the holding period for individuals that were measured of changes in swim performance. When fed for 21 days,
immediately after being caught (square), held without food and alive subsequent to 28 days of food deprivation, swim performance
(7D group only; closed circle), held without food and died (all increased (57% percent of fish finished the swim trial after
treatment groups; cross) and fed after 28 days of starvation (7D-fed 3 weeks of feeding); however, swim performance did not
group; triangle). Shaded region represents fish sampled in
freshwater, non-shaded region represents fish held in saltwater.
immediately return to pre-starvation levels. It took ∼3 weeks
Generally, condition metrics decreased through time. Protein content of feeding for energetic correlates to return to or increase
and energy density (calculated from protein and lipid content) above capture levels, suggesting some effects of either holding
increased after transfer to saltwater, likely due to short-term or legacy effects from starvation (Table S2). After 35 days
dehydration during the physiologic transition to life in seawater. (week 10) of feeding 100% of fish completed the test, however
..........................................................................................................................................................
10Conservation Physiology • Volume 9 2021 Research article
..........................................................................................................................................................
Downloaded from https://academic.oup.com/conphys/article/9/1/coab014/6185140 by guest on 13 October 2021
Figure 3: Swim performance (time swimming up to 90 min) of fish held without food and transferred to saltwater after (A) 7 days, (C) 14 days
and (D) 21 days and (B) fish that were transferred to saltwater after 7 days, food deprived for 28 days before beginning feeding in week 5 such
that week 7 represents two weeks of feeding, week 8 represents three weeks of feeding and so forth. Each shade of a colour represents a week
of swim trials, which were conducted weekly.
fish had begun growing which could have affected the results swim trial and fish that died during the experiment separated
of the test (Fig. 3, Table S2). nearly completely (did not overlap), thus linear models with
these covariates were predicted perfectly (Fig. 4) and were
the best fit models (Tables 3 and 4). For example, the range
Experiment 3: survival and condition of energy density values for dead fish was 2.40–3.46 MJ/kg,
Mortality during the 61-day holding period was biased whereas the range of values for a fish that did not swim was
towards the end of the experimental period, with the majority 3.49–5.57 MJ/kg. Similarly, the range of protein for fish that
of fish dying in the last 10 days of the experiment. At the died before the end of the experiment was 9.36–14.13% and
termination of the survival experiment, 78 fish had died 14.27–23.94% for fish that failed to swim. Thus, thresholds
while 72 fish remained alive and were euthanized. Fish for fish surviving based on energy density and/or protein were
that remained alive at the end of the experiment were 3.47 MJ/kg and 14.20%.
slightly larger than fish that died during the experiment
(FL = 86.3 mm vs. 81.8 mm: Bonferroni t-test, P > 0.0001;
weight = 3.58 g vs. 2.81 g: Bonferroni t-test, P > 0.0001, Discussion
respectively; Table S3, Fig. S5). Energy density and proximate
body constituents were not markedly different. Fish at the end We held sockeye salmon smolts for 61 days during which
of the experiment were likely close to death, which makes it we observed swim performance and survival and found that
difficult to compare energy metrics between those alive or a continuous decline in condition factor was predictive of
dead at the termination of the experiment. Therefore, it is swim performance, while a threshold existed between energy
more useful to compare fish condition of fish that failed density/protein content and survival. We chose two exper-
to swim (i.e. fish that could not complete the swim trial, imental endpoints (swim performance: 80% of fish could
but were still alive at the swim performance endpoint) and not finish the first test; survival: 50% of the fish had died)
fish that died by the end of the experiment (Table 1). Energy to represent both a biologically relevant and more clinical
density and protein content values between fish that failed the endpoint, respectively. The first endpoint, a lack of swimming
..........................................................................................................................................................
11Research article Conservation Physiology • Volume 9 2021
..........................................................................................................................................................
linear model framework, we found that Fulton’s condition
factor was the best predictor variable of the swim perfor-
mance endpoint. Indeed, k-fold validation indicated that using
Fulton’s condition factor alone could predict whether a fish
could successfully complete a 90-min prolonged swim trial
79.5% of the time. We also compared the group of fish that
could not finish the swim trial to the group of fish that died
and found an energy density threshold of 3.47 MJ/kg below
which a fish will die. The swim performance endpoint was
reached at higher energy levels, and well before the survival
endpoint was reached. The swim performance endpoint was
observed in individuals with energy levels close to the lowest
Downloaded from https://academic.oup.com/conphys/article/9/1/coab014/6185140 by guest on 13 October 2021
levels observed in natural systems (Rondorf et al., 1985; D.
Patterson, personal communication), indicating that swim
performance and therefore condition factor, may be a more
accurate representation of survival estimates in natural pop-
ulations.
Contrary to our prediction, condition factor, rather
than energetic variables, was the best predictor of swim
performance. Swim performance decreased as condition
factor decreased. Length and condition factor are low effort,
low cost and non-lethally collected variables, which are often
measured in field studies and have been related to smolt
survival (Healey, 1982; Ward et al., 1989; Henderson and
Cass, 1991; Duffy and Beauchamp, 2011). This is not the
first study to find that condition factor rather than energetic
variables or metabolites better predicted swim performance
in fishes (Atlantic cod Gadus morhua, Martinez, 2003;
largemouth bass Micropterus salmoides, Gingerich et al.,
2010; gilthead seabream Sparus aurata, Faria et al., 2011).
Here we demonstrate this relationship in salmon smolts.
Energetic variables were the best predictors of survival.
Interestingly, TAG was not the best predictor of either swim
performance or survival, and in fact appeared stable through-
out the experiment. Energy density (energy from lipid and
Figure 4: Weekly proportion of food-deprived fish that completed
the 90 min swim trial (top) or survived (bottom) for each treatment protein) and lipid content have been related to survival in
group, transferred to saltwater after 7 days (blue), 14 days (light salmon and other species (LeBrasseur, 1969; Simpkins et al.,
purple) and 21 days (green). Grey vertical line represents the end of 2003, 2004; Ferguson et al., 2010; Persson et al., 2018),
the testing/observation period. Observation periods ended after and since TAG is a non-structural lipid, we predicted that
>80% of the fish could not finish the test for over two weeks (top) this variable would better predict survival compared to lipid
and after 50% of fish had died (bottom).
content. However, energy density and protein content were
most distinct between the fish that failed the swim test and
the fish that died, rather than lipid or TAG. The importance
capacity, represents a more ecologically relevant endpoint of energy density, rather than lipid content, is likely due to the
than a clinical diagnosis of death because fish with decreased inter-individual variance in use of protein and lipid as energy
swim performance likely have a higher probability of being storage (McCue, 2010). It is also possible that variables other
predated (Plaut, 2001). The second endpoint can be used than what we measured could have better predicted swim
to compare with other starvation studies and represents a performance and/or survival. For example, metabolic rate,
‘true’ clinical endpoint, where outside of external factors such metabolic enzymes, organ mass (e.g. liver somatic index)
as predation, a fish would die. There was no difference in and glycogen have been correlated with condition and per-
swim performance or survival between treatment groups (7D, formance (Martinez, 2003, 2004; Gingerich et al., 2010).
14D, 21D) suggesting that freshwater migration duration did However, in these previous studies the fish were not starved
not influence these two metrics. Using swim performance and the utility of these measurements likely changes during
data from the 7D group as a response variable and physical starvation (McCue, 2010). Alternatively, fatty acids could be
or energetic condition predictor variables in a generalized correlated with performance as Pierce et al. (2005) found
..........................................................................................................................................................
12Conservation Physiology • Volume 9 2021 Research article
..........................................................................................................................................................
Downloaded from https://academic.oup.com/conphys/article/9/1/coab014/6185140 by guest on 13 October 2021
Figure 5: Swim performance and survival by energetic correlates for starved fish. Completed, fish that finished the 90 min swim; Failed, fish
that did not complete the 90 min swim; and Dead, fish that died during the survival experiment. This analysis groups all weeks of swimming
together. Significance of post hoc Bonferroni pairwise tests are indicated by either ∗ P ≤ 0.05, ∗∗ P ≤ 0.01, ∗∗∗ P ≤ 0.001 or ∗∗∗∗ P ≤ 0.0001.
that dietary fatty acid influenced performance in a migratory origin Columbia River Chinook salmon smolts nearing the
bird. Thus, future research could clarify the roles of different estuary after completion of freshwater migration. The energy
components of energy stores in performance and survival. density values found in their study fall close to the group of
fish that did not complete the swim trial in our experiment,
Energy values observed in our experiment were similar to whereas the lipid values fall closer to those that died during
what has been observed in natural systems and other studies. our experiment. Persson et al. (2018) found a threshold for
The median lipid content for those that failed the trial was survival of 3.5 MJ/kg and condition factor of 0.65 in starved
1.93%, approaching values previously estimated to be the Atlantic salmon (Salmo salar) smolts, consistent with our
lower threshold for survival in the wild (DFO, unpublished findings. Another study held juvenile chum salmon (O. keta)
data). Indeed, wild sockeye salmon smolts have rarely been captured in the Icy Strait, AK, USA, without food for 45 days
found in the wild with lipid values lower than 2.0% or con- in saline water in living-stream tanks and found that energy
dition factors less than 0.57 (DFO, unpublished data). This density (determined using a bomb calorimeter) decreased to
study examined fish just prior to migration, and so likely rep- ∼650 cal/g (2.72 MJ/kg) (Ferguson et al., 2010), similar to
resents fish with reserved energy for migration. Rondorf et al. the lowest energy densities measured in fish held for 61 days
(1985) found that lipid values approached 1.4% and energy in our experiment (Table S3). At the end of our experiment,
density decreased to 1.02 Kcal/g (4.27 MJ/kg) for hatchery surviving fish were longer than dead fish (Fig. S1), which is
..........................................................................................................................................................
13Research article Conservation Physiology • Volume 9 2021
..........................................................................................................................................................
Table 4: Top model parameter coefficients for generalized linear models predicting swim success/failure and swim failure/death
Top model Parameter Coefficient
(95% CI)
(Success/failure) = condition factor
Intercept −1.62
(−2.38, −0.97)
Condition factor (K) 1.68
(0.95, 2.56)
(Swim failure/death) = energy density
Downloaded from https://academic.oup.com/conphys/article/9/1/coab014/6185140 by guest on 13 October 2021
Intercept −1299a
Energy density 379a
(Swim failure/death) = protein content
Intercept −4601a
Protein content 324.1a
a
Energy density and protein content of fish separated perfectly allowing for probabilities of 0 or 1. As a result model estimates of confidence intervals approach infinity.
consistent with Simpkins et al. (2004) who found that for be observed in natural settings, with actual time to 80%
sedentary fish held without food, smaller fish died before failure being much less than four weeks, depending on water
larger fish, perhaps due to decreased lipid stores. Together temperature. Similarly, we would expect that fish in a natural
with the swimming results, this suggests that smaller, lower setting would likely die much earlier than the 51–61 days in
condition fish might be more likely to die under conditions which we observed the majority of mortality in our experi-
of starvation (Biro et al., 2004). Furthermore, these examples ment. Longevity in the natural environment is likely less than
could represent species- or population-specific differences in the 3–6 weeks in which we observed fish complete swim
physiological response to starvation. Indeed, swim perfor- trials, yet juvenile salmon migrations in altered rivers can
mance differs across populations of fed coho (O. kisutch) and take over two weeks to complete (Giorgi et al., 1997; Smith
sockeye salmon (Taylor and McPhail, 1985; Eliason et al., et al., 2002).
2017). However, our findings that fish with energy densities
ofConservation Physiology • Volume 9 2021 Research article
..........................................................................................................................................................
Downloaded from https://academic.oup.com/conphys/article/9/1/coab014/6185140 by guest on 13 October 2021
Figure 6: Top model predicted probabilities of 7D fish completing the swim trial (1 = complete, 0 = incomplete; left) and top model predicted
probabilities of fish failing the swim test (1) or dying (0) for all un-fed groups (right). Grey shaded regions represent 95% confidence regions.
hatchery fish, due to their availability, readiness to live in some fraction of the marine migration corridor is food-limited
aquaculture facilities and ease of access. However, swim (McKinnell et al., 2014), and therefore condition-dependent
performance of hatchery fish can be much lower than that swim performance and survival relationships could clarify
of wild fish (Bams, 1967; Beamish, 1978; McDonald et al., individual and population-level sensitivity to starvation.
1998; Simpkins et al., 2003, 2004; Pedersen et al., 2008).
For example, we used the same apparatus as Collins et al. Using wild salmon smolts and an experimental approach,
(2013), which examined prolonged swim performance of we have developed a model to predict swim performance
hatchery-reared sockeye salmon. The majority of fish in their given condition factor. Condition factor is a simple and
experiment tired by 20 min; however, we required a 90-min inexpensive tool that represents a likely avenue for measur-
swim to achieve variability in swim performance in the first ing swim performance and thus survival probability. Indeed,
week of the swim trials. McDonald et al. (1998) made a prolonged swim performance collapsed three weeks prior to
similar observation when they compared swim performance and at higher energy levels than the onset of mortalities.
of hatchery reared and wild Atlantic salmon. Wild fish had Survival was better predicted by energy density and protein
better fin quality, higher anaerobic capacity and higher swim content than condition factor. Energy density is a more clinical
endurance than hatchery fish (McDonald et al., 1998). Hatch- predictor of survival and is a more labour intensive and
ery fish may differ from wild fish which makes it challenging expensive measurement and requires lethal sampling. Given
to draw conclusions about swim performance of wild fish and that different individuals and populations of salmon have
velocity barriers in natural systems, using hatchery-reared fish different energetic status and condition (MacDonald et al.,
(McDonald et al., 1998). 2019), or may use estuary stopover habitat for different dura-
tions (Moore et al., 2016), here we provide the foundation for
Understanding condition-dependent swim performance understanding the impacts of this variation. This study offers
and survival could help elucidate carry-over effects and limits a new tool for contextualizing population-specific sensitivity
on survival during seaward and early marine migration in to changes in migratory conditions or pre-migratory condi-
Pacific salmon. Survival through the early marine life history tioning phase.
stage is size-dependent, and likely condition-dependent, as
juvenile salmon must grow quickly to escape gape-limited
predators and expand prey options (Pope et al., 1994). Funding
Schooling behaviours may decrease predation risk through
‘predator swamping’, but these schooling behaviours require This work was supported by Vanier Canadian Graduate
some level of swim performance (Furey et al., 2021). In Scholarship, Weston Family Scholarship awarded to S.M.W.
fact, predation may be condition-dependent, where lower- Additional funding was from the Liber Ero Foundation for
condition individuals are preferentially predated (Tucker et J.W.M. [421208] and support from Pacific Salmon Com-
al., 2016). Thus, condition-dependent swim performance rela- mission Southern Endowment Fund and DFO Environmental
tionships could help predict probability of survival in natural Watch
systems. Additionally, most of the freshwater migration and Program.
..........................................................................................................................................................
15You can also read