Liquidity Landscape November 10, 2020 - Liquidnet
←
→
Page content transcription
If your browser does not render page correctly, please read the page content below

Liquidity
Landscape
November 10, 2020

Disclaimer
This document is confidential between you and Liquidnet and should not be disclosed to anyone else without Liquidnet’s prior permission. It is published
only for Liquidnet Members, customers, and anyone who has been sent this document directly from Liquidnet. This document is not investment advice or
intended as a recommendation to buy or sell any instrument covered with it. Although the statements within this document are believed to be correct,
they have not been verified by the author and should not be relied upon when considering the merits of any particular investment. A recipient should
consider their own financial situation, investment objectives and seek independent advice, where appropriate, before making any investment. This
document does not and is not intended to constitute legal advice. It is provided on a non-reliance basis and all recipients should seek their own independent
legal advice in relation to the matters discussed in this document. All presented data may be subject to slight variations. All data and figures are Liquidnet
internal data unless stated otherwise.

                                                                                                                                                      1
Liquidity Landscape: Post Covid-19
Brexit
With the end of the transition period fast approaching and the continued uncertainty regarding
the outcome of negotiations, regulators on both sides of the channel continue to look for
pragmatic solutions to mitigate any negative effects resulting from a hard Brexit. Both the FCA
and ESMA have issued statements on limiting the impact of the Share Trading Obligation. While
the UK intend to allow trading to continue as it does today by extending Temporary Transitional
Power (TTP) to March 2022,1 ESMA instead are restricting the impact of the STO to ISIN and
currency only.2 However, despite the regulators’ efforts to reduce any immediate impact, the
industry needs to be aware and prepared for changes that could be in play 1 January 2021.

OTC Trade Reporting
Following the end of the transition period, trading venues established in the UK will, with effect
from 1 January 2021, no longer be considered EU trading venues. Consequently, transactions
concluded on UK trading venues would be considered OTC-transactions and subject to the
post-trade transparency requirements (Articles 20 and 21 of MiFIR).3

While UK trading venues have been positively assessed as third-country venues provided that
they meet all relevant criteria,4 UK SI will not. Trades conducted on UK SI together with OTC
activity will now need to be trade reported by both parties, and as such, EU investment firms will
need to make public transactions concluded OTC with UK counterparties via an APA
established in the EU.

There are a number of issues in relation to this; firstly, that any type of reporting by an EU firm
does not impact the use of waivers; secondly, there needs to be alignment of the deferral
regime to increase harmonisation of reporting and finally ISINs need to be in scope under the
DTO (Derivatives Trading Obligation).

Share Trading Obligation (STO)
In the short term the STO looks to be resolved, but in reality, the issue has merely been kicked
down the road. While the UK intend to use the TTP to mitigate any market disruption, they also
state clearly that they reject ESMA’s proposal to reduce the scope of the STO to ISIN and
currency.5 The UK approach of allowing open markets between trading venues globally is likely
to lead to a response from the EU Commission next year when they revisit MiFID II in Q4 2021,
given concerns of a liquidity drain to the UK in a similar manner to the outcome of Swiss
Equivalence negotiations.

1 https://www.fca.org.uk/brexit/onshoring-temporary-transitional-power-ttp/previous-ttp-updates
2 https://www.esma.europa.eu/sites/default/files/library/esma70-155-
7782_statement_brexit_share_trading_obligation_q42020.pdf
3 https://www.esma.europa.eu/sites/default/files/library/esma70-155-
10962_statement_brexit_mifid_remaining_issues_2020_q4.pdf
4 https://www.esma.europa.eu/press-news/esma-news/esma-adds-uk-venues-opinions-third-country-trading-
venues-1
5 https://www.esma.europa.eu/sites/default/files/library/esma70-155-
7782_statement_brexit_share_trading_obligation_q42020.pdf

2

As it stands currently, EU asset managers will still be able to trade dual listed stocks on the LSE in
GBP under the new scope of ISIN plus currency, however dealing in EU instruments traded in
euro will need to be executed on EU venues. Looking at the list of dual listed stocks which
appear to have meaningful activity (>5% of the total shares traded across both lines), out of 36
dual listed stocks starting with an EU27 ISIN, seven names have their main pool of liquidity in the
UK reducing the scope of the EU STO to only two names: Bank of Cyprus and Greencoat
Renewables, both of which are traded in Euros in the UK. This will remain one to watch given that
the FCA also notes its intention to keep its approach under review. In particular, the FCA have
highlighted discussions with market participants on whether or not to keep the current MiFID II
transparency calibrations if equivalence is not achieved.

Exhibit 1: Dual listed EU stocks most likely impacted by EU/UK STO only
                                                                            EuropeP    UKPerc  EU % UK %
    ISIN       Europe              UK          SWISS        TotalVol                                                      Names
                                                                            erc 2020    2020   2019   2019
AT0000641352      1,363,852         100,561                    1,464,413         93%        7%      1      1   CA IMMOBILIEN ANLAGEN AG
AT0000652011    14,046,943        1,685,139                  15,732,082          89%       11%      1      1   ERSTE GROUP BANK AG
AT0000743059      7,792,625       2,927,078                  10,719,703          73%       27%      1      1   OMV AG
AT0000831706      2,805,819       1,178,780                    3,984,599         70%       30%      1      1   WIENERBERGER AG
AT0000APOST4        797,796           85,027                     882,823         90%       10%      1      1   OESTERREICHISCHE POST AG
BE0003826436      2,243,697         236,996                    2,480,693         90%       10%      1      1   TELENET GROUP HOLDING NV
DE000TUAG000    28,641,957      15,511,482                   44,153,439          65%       35%   48%    52%    TUI AG-DI
ES0171996087    15,883,628        1,651,299                  17,534,927          91%        9%      1      1   GRIFOLS SA
ES0177542018   319,411,547     521,772,488                  841,184,035          38%       62%   28%    72%    INTL CONSOLIDATED AIRLINE-DI
FI0009005987    13,583,518        1,180,915                  14,764,433          92%        8%      1      1   UPM-KYMMENE OYJ
FI0009013403      8,717,981         889,249                    9,607,230         91%        9%      1      1   KONE OYJ-B
FI4000153309        605,813         521,864                    1,127,677         54%       46%      1      1   FARON PHARMACEUTICALS OY
FR0000045072    74,075,316      14,275,958                   88,351,274          84%       16%      1      1   CREDIT AGRICOLE SA
FR0000120271    78,755,127      28,942,962      3,920,603   107,698,089          73%       27%      1      1   TOTAL SE
FR0000121972    10,863,903        1,379,233                  12,243,136          89%       11%      1      1   SCHNEIDER ELECTRIC SE
FR0000125007    20,256,012        2,142,094        22,500    22,398,106          90%       10%      1      1   COMPAGNIE DE SAINT GOBAIN
FR0010397232    71,910,083      25,172,180                   97,082,263          74%       26%      1      1   NOVACYT
IE0000020408           7,883           7,376                       15,259        52%       48%      1      1   ABBEY PLC
IE0000669501      4,216,569         326,999                    4,543,568         93%        7%      1      1   GLANBIA PLC
IE0001827041    18,053,210        9,267,378                  27,320,588          66%       34%   58%    42%    CRH PLC
IE0004906560      2,018,672         239,941                    2,258,613         89%       11%   88%    12%    KERRY GROUP PLC-A
IE0004927939      4,030,097         598,687                    4,628,784         87%       13%   86%    14%    KINGSPAN GROUP PLC
IE0007214426        430,398           26,353                     456,751         94%        6%      1      1   CPL RESOURCES PLC
IE00B1RR8406      7,373,844       3,714,713                  11,088,557          66%       34%   62%    38%    SMURFIT KAPPA GROUP PLC
IE00B66B5T26      4,332,351     49,959,839                   54,292,190           8%       92%      1      1   PROVIDENCE RESOURCES PLC
IE00BD1RP616    53,289,376        5,569,226                  58,858,602          91%        9%      1      1   BANK OF IRELAND GROUP PLC
IE00BD5B1Y92        343,247         486,226                      829,473         41%       59%      1      1   BANK OF CYPRUS HOLDINGS PLC
IE00BD6JX574    14,754,117        2,137,108                  16,891,225          87%       13%      1      1   GLENVEAGH PROPERTIES PLC
IE00BF0MZF04      4,827,418     57,202,429                   62,029,847           8%       92%   15%    85%    ORMONDE MINING PLC
IE00BF2NR112      9,176,328     63,157,380                   72,333,708          13%       87%   42%    58%    GREENCOAT RENEWABLES PLC
IE00BWB8X525        473,304         128,278                      601,582         79%       21%   90%    10%    PERMANENT TSB GROUP HOLDINGS
IE00BWT6H894      1,300,164       2,879,292                    4,179,456         31%       69%   35%    65%    FLUTTER ENTERTAINMENT PLC
IE00BWY4ZF18    24,225,002        3,221,656                  27,446,658          88%       12%   71%    29%    CAIRN HOMES PLC
IE00BXC8D038      1,114,891         881,579                    1,996,470         56%       44%   42%    56%    APPLEGREEN PLC
IE00BYTBXV33    18,991,357      14,068,567                   33,059,924          57%       43%   57%    43%    RYANAIR HOLDINGS PLC
NL0012650360          70,272        489,539                      559,811         13%       87%      1      1   RHI MAGNESITA NV

Delegation
In addition to the STO, ESMA is also looking at delegation rules as part of its review of the AIF and
UCITS framework.6 This could impact delegate dealing capacity by requiring this to be licensed
in Europe. ESMA has requested legal clarification from the EU Commission in relation extent of
delegation including a list of core or critical functions that must always be performed internally
and may not be delegated to third parties. However, this remains at a theoretical stage for now
given the letter from ESMA to the European Commission has no legal basis. It highlights the
remaining concerns regarding the outcome of the Brexit negotiations, and ESMA could respond
rapidly if they deem it necessary to prevent liquidity draining from Europe.

6 https://www.esma.europa.eu/sites/default/files/library/esma34-32-551_esma_letter_on_aifmd_review.pdf

3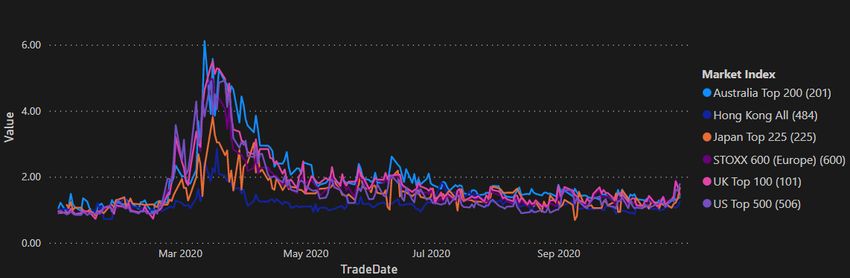
Post Covid Capital Market Recovery Package
As a result of the pandemic, the MiFID II review has been significantly reduced in scope, with the
bulk of industry concerns being pushed into Q4 2021. The elements that will be included in the
Capital Markets Recovery package proposed by the European Commission in July 2020 is slowly
working its way into the legislate.

Timeline

    Parliament review of               Translation of                      Immediate publication
    Presidency proposal                proposals in four                   expected in November
    and amendments to                  languages
    MiFID II currently
    underway

Product governance
     • Product governance requirements on more complex products should no longer apply to
       non-complex bonds where they are marketed or distributed on an execution-only basis
     • Eligible counterparties are also deemed to have sufficient knowledge on financial
         instruments and can be exempt from product governance requirements. The exemption
         only applies to financial instruments exclusively marketed and distributed to eligible
         counterparties
Cost and charges disclosures
     •   Services provided to eligible counterparties and professional clients should be exempt
         from cost and charges disclosure requirement
     •   The exemption does not apply to services of investment advice and portfolio
         management
Cost benefit analysis
   • Exemption for professional investors from cost benefit analysis in case of switching
      financial instrument but possibility for professional investors to opt-in
Best execution reports
     •   To facilitate the communication between investment firms and their clients, investment
         information should be provided electronically and no longer on paper

     •   Retail clients should however be able to request the continued provision of information
         on paper
Service reports
     •   Reports deemed unhelpful in extreme volatile markets given their high frequency
     •   Professional clients often react to those service reports by not reading them at best or
         by rushing into investment decisions rather than continuing with a long-term strategy
     •   Eligible counterparties should be exempt from receiving such reports while professional
         clients should have the possibility to opt-in

4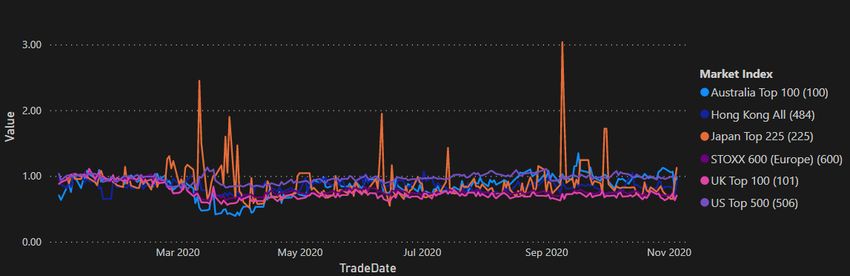
Other topics reviewed by Europe
    •   Reversing Research Unbundling for
          o SMEs along with expanding the definition of small and mid-cap issuers to issuers with
            a market capitalization threshold of up to EUR 10 billion over a 12-month period
    •   Fixed income research: Proposal considers if fixed income research is received without
        impacting the spread, it can be exempt from MiFID II research rules.

Longer-term change
Despite the immediate focus on Brexit and the MiFID II Review, market participants should focus
on the longer-term direction of policy. Europe has re-launched Capital Markets Union in support
the recovery of SMEs and the real economy post-Covid. Although MiFID II improved liquidity for
large caps, it is the regulators view that secondary markets have failed to improve liquidity for
SMEs. Given these companies are now at a greater risk due to increased levels of debt incurred
and the recent fall in economic activity, EU policy makers are looking to stimulate re-equitisation
of SMEs. To achieve this, they plan to significantly reduce red-tape in terms of listing
requirements, improve research exposure and look at alternative means of bolstering
secondary market activity. The latest discussions include a new paper by the AMF based on the
introduction of a new auction model for SMEs,7 this will be another area to watch going forward,
as well as the outcome of future relations between the EU and the UK. While regulators on both
sides of the channel are searching for pragmatic solutions, ultimately what they are able to
implement will all come down to politics.

Global Liquidity
Despite lockdown measures being lifted progressively over the summer and governments
making every attempt to re-start their respective economies, Top of Book Liquidity8 has not
returned to pre Covid levels for the UK Top 100 and EU STOXX 600 trading respectively 32% and
30% lower than the January average, whereas Australia and Japan is now higher than pre Covid
levels. There has been little change in US TOB liquidity.

Global Top of Book Liquidity
Exhibit 2: Top of Book Liquidity

                  Top of Book Liquidity              Top of Book Liquidity            % Change October
                  (median number                     October (median                  average vs January
Index             of shares)                         number of shares)                average
US Top 500        429                                431                              0%
Hong Kong All     100,834                            93,088                           -7%
Australia Top 200 16,995                             26,271                           54%
Japan Top 225     6,861                              4,387                            36%
UK Top 100        2,237                              1,521                            -32%
STOXX 600         1,440                              998                              -30%

Source: Liquidnet Investment Analytics

7 https://arxiv.org/abs/2010.02827
8 As represented by the median number of shares at the top of the book proxied against the January average

5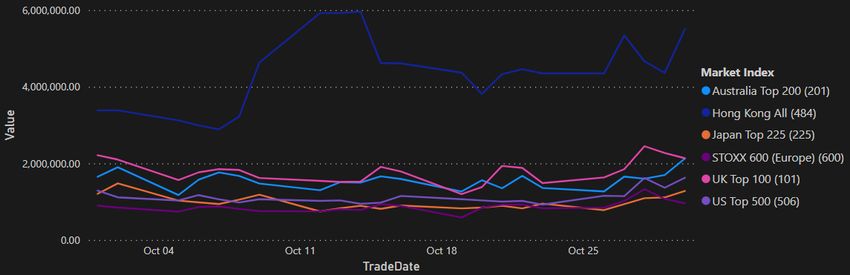
Exhibit 3: Top of Book Liquidity represented by the median number of shares proxied against
January average (split by market)

Source: Liquidnet Investment Analytics – Date range from January 2 to October 30

Liquidity levels have remained relatively stable in Japan and Hong Kong even at the height of the
pandemic due to the proportion of lit market activity. Within this high proportion of lit activity
there are local differences such as the lack of HFT in Hong Kong versus the comparative higher
proportion of HFT in Australia which impacted liquidity provision. One potential reason for the
low Liquidity levels in the UK/Europe compared to other markets is due to the high proportion of
US and APAC retail activity which is taking place. Continued lack of liquidity across UK and
Europe markets will force buy-side traders to review when, where and how to trade to ensure
best execution for their end investors. In a recent market structure survey, asset managers are
already adjusting their trading hours with the bulk of the activity now taking place from the US
Open to the European close to guarantee maximum liquidity access.

Exhibit 4: Top of Book Liquidity represented by the median number of shares proxied against
January average

Source: Liquidnet Investment Analytics – Date range from January 2 to October 30

Global Volumes
Global volumes are significantly lower than March levels but remain around 20-30% higher than
the January average except for Australia which has experienced heightened volatility and
volumes 62% higher than the January average.

6
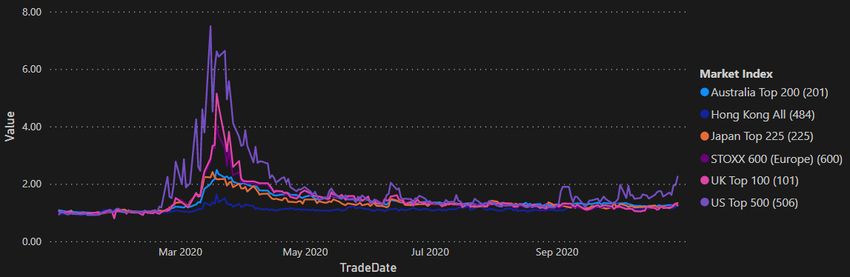
Exhibit 5: Global volumes

                        January           Peak in            October               % change     % change
                        average           March              average               January in   peak March
                        (in million       (in million        (in million           average vs   vs October
Index                   shares)           shares)            shares)               October      average
                                                                                   average
Australia               1.3               5.9                2.1                   62%          -64%
Hong Kong               4.4               13.3               5.5                   25%          -59%
Japan Top 225           1                 3.1                1.3                   30%          -58%
STOXX 600               0.8               3.2                1                     25%          -69%
UK Top 100              1.9               7.1                2.2                   16%          -69%
US Top 500              1.2               3.6                1.6                   33%          -55%

Source: Liquidnet Investment Analytics

Exhibit 6: Global Volumes (split by Index) from January 2020

Source: Liquidnet Investment Analytics – Date range from January 2 to October 30

Overall volumes have been consistent for the last few months with the occasional spike due to
rebalances.

Exhibit 7: Global Volumes (split by Index) in October

Source: Liquidnet Investment Analytics – Date range from September 1 to October 30

7
Over the last month volumes have stayed relatively steady with only a slight uptick towards the
end of October as Covid-19 took hold in some European countries leading to talks of lockdown
and new restrictions.

Global Spreads
Despite liquidity and volumes on track to recover from pre-Covid levels for most markets,
spreads9 are still wider than in January in all markets indicating that it will take some time for
the market to fully re-adjust from the pandemic and ongoing uncertainty regarding the re-
introduction of restrictions globally. US Top 500 spreads widened recently, rising 147% from
4.01 on January 1 to 9.91 on October 30.

Exhibit 8: Spreads proxied by January average (split by market) from January 2020

Source: Liquidnet Investment Analytics – Date range from January 2 to October 30

Although spreads have tightened since the peaks in March, Exhibit 9 shows how the spreads
have increased in the last week of October.

Exhibit 9: October spreads proxied by January average

Source: Liquidnet Investment Analytics – Date range from October 1 to October 30

9 Normalised spreads to a factor of 1 (each stock is divided by the January average spread where 1 becomes a
reference for what happened pre Covid)

8
Spreads Across Market Cap
A similar picture is emerging across Market Caps with all caps’ spreads still considerably wider
than they were back in January.

Exhibit 10: Normalised Spreads against January average (split by cap size) from January 2020

Source: Liquidnet Investment Analytics – Date range from January 2 to October 30

Mega Caps currently had the widest spreads on September 30 at 88% wider than the January
average. Next are Large caps, which are 47% wider than the January average.

Exhibit 11: Normalised Spreads against January average (split by cap size) from January 2020

Source: Liquidnet Investment Analytics – Date range from January 2 to October 30

Market Impact
The cost of trading remains higher than January levels across all markets, however, the reason
why the cost of trading has not recovered to pre-Covid levels vary from one market to another.
Higher volumes and wider spreads in Australia appear directly responsible for maintaining the
cost of trading 38% higher in October compared to January while for the UK and Europe, the
lack of liquidity result in the cost of trading still being respectively 45% and 46% higher than
January. Wider spreads in the US may be the cause of the rise in costs there.

9
Exhibit 12: Cost to Trade (split by market) year to date

Source: Liquidnet Investment Analytics – Date range from January 2 to October 30

Exhibit 13: Cost to Trade (split by market) month to date

Source: Liquidnet Investment Analytics – Date range from October 1 to October 30

10
Breakdown of European Liquidity
Overall market volumes were significantly lower throughout the summer months at €33.8B in
August and was at €40.9B in October, compared to €57.6B in June and €81B average
recorded in March. Volumes are now more on par with January levels.

Exhibit 14: EMEA Monthly Market Share 2018 to date

Source: Bloomberg

Market share remains stable - Lit continuous is 39%; Auctions 16%; Lit MTF 15%. Systematic
Internaliser activity declined in the third quarter and is now at 20% of total volumes. Dark trading
and Periodic Auctions remain static at approximately 8% and 3% of overall market volumes
respectively.

Systematic Internalisers
SI Average Daily Principal Traded has now declined to €8.2B compared to the June’s peak at
€13.8B coinciding with a decrease in the average execution size from €31k in June to €16.2K in
October (see Exhibit 15). The constant decline in SI average execution size since April 2018
further evidence the reduction in available risk.

11
Exhibit 15: SI Average Daily Principal Traded by Month

Source: Bloomberg

Dark Trading
Dark trading as a percentage of overall exchange traded activity increased from 7.8% in June to
10.3% in October (see Exhibit 16) and is now in line with pre-Covid levels although dark trading as
a percentage of overall activity firmly remains at or below the 8% threshold (see Exhibit 14).

Exhibit 16: Dark % of dark and lit volumes

Source: Bloomberg

12
© 2020 Liquidnet Holdings, Inc. and its subsidiaries. Liquidnet, Inc. is a member of FINRA/SIPC. Liquidnet Europe Limited is authorised and regulated by the Financial Conduct
Authority in the UK, is licensed by the Financial Sector Conduct Authority in South Africa, and is a member of the London Stock Exchange and a remote member of the Warsaw
Stock Exchange and SIX Swiss Exchange. Liquidnet EU Limited is authorised and regulated by the Central Bank of Ireland and is a remote member of the Warsaw Stock
Exchange. Liquidnet Canada Inc. is a member of the Investment Industry Regulatory Organization of Canada and a member of the Canadian Investor Protection Fund. Liquidnet
Asia Limited is regulated by the Hong Kong Securities and Futures Commission for Type 1 and Type 7 regulated activities and is regulated by the Monetary Authority of
Singapore as a Recognized Market Operator. Liquidnet Japan Inc. is regulated by the Financial Services Agency of Japan and is a member of JSDA/JIPF. Liquidnet Australia Pty
Ltd. is registered with the Australian Securities and Investment Commission as an Australian Financial Services Licensee, AFSL number 312525, and is registered with the New
Zealand Financial Markets Authority as a Financial Service Provider, FSP number FSP3781. Liquidnet Singapore Private Limited is regulated by the Monetary Authority of
Singapore as a Capital Markets Services Licensee, CMSL number CMS 100757-1.                                                                                             11/20
You can also read