Machine learning for predicting mortality in transcatheter aortic valve implantation
←
→
Page content transcription
If your browser does not render page correctly, please read the page content below
Machine learning for predicting mortality in transcatheter aortic
valve implantation
Citation for published version (APA):
Mamprin, M., Lopes, R. R., Zelis, J. M., Tonino, P. A. L., van Mourik, M. S., Vis, M. M., Zinger, S., de Mol, B. A.
J. M., & de With, P. H. N. (2021). Machine learning for predicting mortality in transcatheter aortic valve
implantation: An inter-center cross validation study. Journal of Cardiovascular Development and Disease, 8(6),
[65]. https://doi.org/10.3390/jcdd8060065

DOI:
10.3390/jcdd8060065

Document status and date:
Published: 04/06/2021

Document Version:
Publisher’s PDF, also known as Version of Record (includes final page, issue and volume numbers)

Please check the document version of this publication:
• A submitted manuscript is the version of the article upon submission and before peer-review. There can be
important differences between the submitted version and the official published version of record. People
interested in the research are advised to contact the author for the final version of the publication, or visit the
DOI to the publisher's website.
• The final author version and the galley proof are versions of the publication after peer review.
• The final published version features the final layout of the paper including the volume, issue and page
numbers.
Link to publication

General rights
Copyright and moral rights for the publications made accessible in the public portal are retained by the authors and/or other copyright owners
and it is a condition of accessing publications that users recognise and abide by the legal requirements associated with these rights.

       • Users may download and print one copy of any publication from the public portal for the purpose of private study or research.
       • You may not further distribute the material or use it for any profit-making activity or commercial gain
       • You may freely distribute the URL identifying the publication in the public portal.

If the publication is distributed under the terms of Article 25fa of the Dutch Copyright Act, indicated by the “Taverne” license above, please
follow below link for the End User Agreement:
www.tue.nl/taverne

Take down policy
If you believe that this document breaches copyright please contact us at:
openaccess@tue.nl
providing details and we will investigate your claim.

Download date: 05. Mar. 2022
Journal of
              Cardiovascular
              Development and Disease

Article
Machine Learning for Predicting Mortality in Transcatheter
Aortic Valve Implantation: An Inter-Center Cross
Validation Study
Marco Mamprin 1, * , Ricardo R. Lopes 2,3 , Jo M. Zelis 4 , Pim A. L. Tonino 4 , Martijn S. van Mourik 5 ,
Marije M. Vis 5 , Svitlana Zinger 1 , Bas A. J. M. de Mol 5 and Peter H. N. de With 1

                                          1   Department of Electrical Engineering, Eindhoven University of Technology,
                                              5612 AE Eindhoven, The Netherlands; s.zinger@tue.nl (S.Z.); p.h.n.de.with@tue.nl (P.H.N.d.W.)
                                          2   Department of Biomedical Engineering and Physics, Amsterdam UMC, University of Amsterdam,
                                              1105 AZ Amsterdam, The Netherlands; r.riccilopes@amsterdamumc.nl
                                          3   Department of Radiology and Nuclear Medicine, Amsterdam UMC, University of Amsterdam,
                                              1105 AZ Amsterdam, The Netherlands
                                          4   Department of Cardiology, Catharina Hospital, 5623 EJ Eindhoven, The Netherlands;
                                              jo.zelis@catharinaziekenhuis.nl (J.M.Z.); pim.tonino@catharinaziekenhuis.nl (P.A.L.T.)
                                          5   Heart Centre, Amsterdam UMC, University of Amsterdam, 1105 AZ Amsterdam, The Netherlands;
                                              m.s.vanmourik@amsterdamumc.nl (M.S.v.M.); m.m.vis@amsterdamumc.nl (M.M.V.);
                                              b.a.demol@amsterdamumc.nl (B.A.J.M.d.M.)
                                          *   Correspondence: m.mamprin@tue.nl

                                   Abstract: Current prognostic risk scores for transcatheter aortic valve implantation (TAVI) do not
Citation: Mamprin, M.; Lopes, R.R.;       benefit yet from modern machine learning techniques, which can improve risk stratification of one-
Zelis, J.M.; Tonino, P.A.L.; van          year mortality of patients before TAVI. Despite the advancement of machine learning in healthcare,
Mourik, M.S.; Vis, M.M.; Zinger, S.;      data sharing regulations are very strict and typically prevent exchanging patient data, without
de Mol, B.A.J.M.; de With, P.H.N.         the involvement of ethical committees. A very robust validation approach, including 1300 and
Machine Learning for Predicting
                                          631 patients per center, was performed to validate a machine learning model of one center at the other
Mortality in Transcatheter Aortic
                                          external center with their data, in a mutual fashion. This was achieved without any data exchange
Valve Implantation: An Inter-Center
                                          but solely by exchanging the models and the data processing pipelines. A dedicated exchange
Cross Validation Study. J. Cardiovasc.
                                          protocol was designed to evaluate and quantify the model’s robustness on the data of the external
Dev. Dis. 2021, 8, 65. https://doi.org/
10.3390/jcdd8060065
                                          center. Models developed with the larger dataset offered similar or higher prediction accuracy on
                                          the external validation. Logistic regression, random forest and CatBoost lead to areas under curve
Academic Editor: Michael L. Rigby         of the ROC of 0.65, 0.67 and 0.65 for the internal validation and of 0.62, 0.66, 0.68 for the external
                                          validation, respectively. We propose a scalable exchange protocol which can be further extended on
Received: 7 May 2021                      other TAVI centers, but more generally to any other clinical scenario, that could benefit from this
Accepted: 2 June 2021                     validation approach.
Published: 4 June 2021

                                          Keywords: aortic valve disease; machine learning; inter-center cross-validation; one-year mortality
Publisher’s Note: MDPI stays neutral      prediction; outcome prediction; prognosis; TAVI; transcatheter aortic valve implantation
with regard to jurisdictional claims in
published maps and institutional affil-
iations.

                                          1. Introduction
                                               Aortic valve stenosis (AS) is one of the most common valve diseases in the developed
                                          world, primarily impacting the elderly population [1]. When symptomatic, the disease
Copyright: © 2021 by the authors.
                                          has a devastating impact when left untreated, rapidly increasing the risk for heart failure,
Licensee MDPI, Basel, Switzerland.
                                          which can lead to death in many cases. The most common cause of AS is calcification,
This article is an open access article
                                          resulting from a network of pathological processes such as endothelial dysfunction and
distributed under the terms and
                                          injury, inflammation, synthetic and osteogenic dedifferentiation, pro-fibrotic response of
conditions of the Creative Commons
                                          valvular interstitial cells and degradation of the extracellular matrix by proteolytic enzymes.
Attribution (CC BY) license (https://
creativecommons.org/licenses/by/
                                          The calcium deposits on the valve leaflets result in impaired leaflet motion and subsequent
4.0/).
                                          obstruction and/or regurgitation of blood flow. Another common cause is cardiac fibrosis

J. Cardiovasc. Dev. Dis. 2021, 8, 65. https://doi.org/10.3390/jcdd8060065                                    https://www.mdpi.com/journal/jcdd
J. Cardiovasc. Dev. Dis. 2021, 8, x FOR PEER REVIEW 2 of 20
J. Cardiovasc. Dev. Dis. 2021, 8, 65 2 of 20
subsequent obstruction and/or regurgitation of blood flow. Another common cause is car-
diac fibrosis which leads to heart valve thickening which decisively contributes to heart
valve failure
which leads toinheart
addition
valvetothickening
calcification. As adecisively
which consequence, the lefttoventricle
contributes triesfailure
heart valve to com- in
pensate for the reduction in cardiac output by hypertrophy. Progressive
addition to calcification. As a consequence, the left ventricle tries to compensate for the narrowing of the
valve willin
reduction result in symptoms
cardiac output bywhile conducting
hypertrophy. daily activities,
Progressive narrowing like of
angina, dizziness
the valve and
will result
dyspnoea.
in symptoms while conducting daily activities, like angina, dizziness and dyspnoea.
Traditionaltreatment
Traditional treatmentofof severe
severe AS AS consists
consists of surgical
of surgical aortic aortic valve replacement
valve replacement (SAVR).
(SAVR). However,
However, in the past in the past decades,
decades, a less invasive
a less invasive and innovative
and more more innovative approach
approach has
has been
developed and approved,
been developed initiallyinitially
and approved, for use for
onlyusein high
only surgical-risk AS, and later
in high surgical-risk extended
AS, and later
to mild- and
extended moderate-risk
to mild- AS (risks
and moderate-risk AScalculated according
(risks calculated to thetoestablished
according surgical
the established sur-
risk
gicalscores). This This
risk scores). approach is a minimally
approach invasive
is a minimally heart
invasive procedure
heart procedure which requires
which the
requires
implantation
the implantationof an of artificial valve,
an artificial valve,as as
shown
shown ininFigure
Figure1.1.The
The procedure
procedure is known as as
transcatheter
transcatheter aortic valve implantation
implantation (TAVI) or transcatheter aortic valve valve replacement
replacement
(TAVR),
(TAVR),andandhas
hascurrently
currentlybecome
becomeaaroutine
routinetreatment
treatmentworldwide.
worldwide.
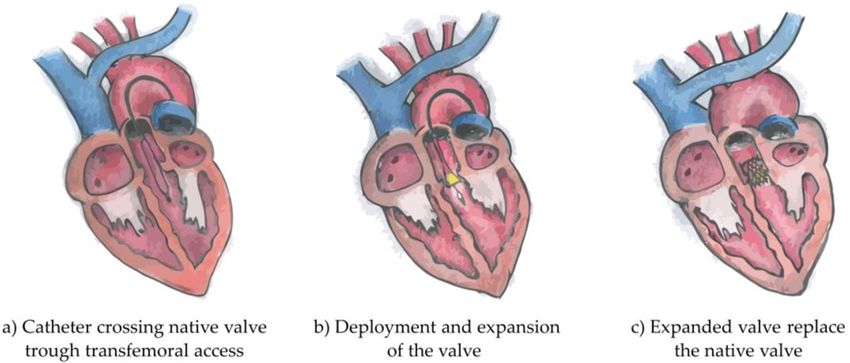
Figure 1.
Figure 1. Illustration of the three phases
phases of
of Transcatheter
Transcatheter Aortic
Aortic Valve
Valve Implantation
Implantation intervention.
intervention.
Originally the catheter crosses the native valve trough transfemoral access (a),(a),
Originally the catheter crosses the native valve trough transfemoral access follows
follows the deploy-
the deployment
and expansion of the valve (b) and finally the expanded valve replaces the native valve valve
ment and expansion of the valve (b) and finally the expanded valve replaces the native (c). (c).
Strict patient
Strict patientselection
selectionisisperformed
performed byby a multi-disciplinary
a multi-disciplinary team team to select
to select patients
patients best
best suited for TAVI. The selection is achieved by exploiting both
suited for TAVI. The selection is achieved by exploiting both current imaging technologies current imaging tech-
nologies
and recent and recent clinically
clinically related research,
related research, which are which
jointlyarediscussed
jointly discussed in an inter-dis-
in an inter-disciplinary
ciplinarywith
meeting meeting with medical
medical experts experts
and byand using by using
modern modern
planningplanningand and treatment
treatment sup-
support
port tools
tools [2–4].[2–4].
The global
The global objective of the research in this paper is to improve improve on on thethe prediction
prediction of of
possible benefits
possible benefits for TAVI patients (further
TAVI patients (further information is available in the Supplementary
the Supplementary
Materials), such
Materials), such that unnecessary treatment and reduction of the quality of life life is
is avoided
avoided
for patients
for patientsnot notbenefiting
benefitingfrom fromTAVI,
TAVI, while
while giving
giving moremore certainty
certainty to benefiting
to the the benefiting pa-
patients
tients
by the by the confirmation
confirmation of the prediction
of the prediction of improvements.
of improvements. A secondA second
reason forreason for this
this research is
research
found is found
in the use ofin the
the use of the
mortality mortalityIfprediction.
prediction. the prediction If the prediction
score is high, score is high,team
the medical the
medical
of expertsteam of experts
can discuss can discuss
alternative alternative
treatments treatmentsand
or medications or medications
maintain theand qualitymaintain
of life
the quality
and of life and
life expectancy as life
high expectancy
as possible. as Alternatively,
high as possible. Alternatively,
if the score is low,ifthe themedical
score is team
low,
the medical
can use this as team can use this to
a confirmation as further
a confirmation
proceedtowith further
TAVIproceed with TAVI
and stimulate and stimu-
the patients for
further
late themotivation
patients for of further
treatment. Whereasof
motivation thetreatment.
previous motivations
Whereas theare mostly related
previous to the
motivations
patient,
are mostly the related
proposed study
to the also provides
patient, the proposedbenefits
studyto the
alsomedical
provides centers
benefitsby tofacilitating
the medical the
patient
centersselection, reducing
by facilitating the waiting lists, optimizing
patient selection, reducing thewaiting
use of the resources
lists, optimizing and improving
the use of
the
the clinical
resources workflow [1].
and improving the clinical workflow [1].
Research
Research on mortality prediction
prediction andand risk
risk models
models has has been
been addressed
addressedin inliterature.
literature.
However, current risk models have only limited accuracy in
However, current risk models have only limited accuracy in predicting TAVI outcomespredicting TAVI outcomes [5].
Several models originally intended for SAVR, thus
[5]. Several models originally intended for SAVR, thus not specifically not specifically intended for TAVI,
for TAVI,
have
have beenbeen developed
developed in recent decades and are currently used for risk assessment. assessment. ItIt is is
noteworthy and important to mention EuroSCORE, EuroSCORE II and the STS (Society
of Thoracic Surgery) scores [6–9], since they are in widespread use worldwide. More
been identified by the medical experts as the life expectancy threshold, ab
TAVI procedure is appropriate to be performed. However, one-year mortal
treated with TAVI is even more challenging [13] and current predictors [1
J. Cardiovasc. Dev. Dis. 2021, 8, 65 been extensively validated across multiple centers, reaching a validation 3 of 20 s
used for the clinical decision-making. Furthermore, external validations
needed to assess the predicting potential of one-year mortality for TAVI an
lenging
specific TAVItask, as will
predictors are become evident
also available, of whichfrom this study.
a relevant example is the TAVI-specific
TVT registry score [10–12]. Considering that these are procedural, in-hospital or 30-day
The previously mentioned clinical risk scores and predictors for one-
mortality predictors, the time interval is not clinically relevant to establish whether the
relyprocedure
TAVI on conventional
is suited for statistical regression
long-term patient survival. approaches
In fact, one-year[16]. However,
mortality has been in rece
advanced machine learning techniques (ML) have shown competitive
identified by the medical experts as the life expectancy threshold, above which the TAVI pr
procedure is appropriate to be performed. However, one-year mortality for patients treated
[17]. Especially when data complexity arises and a large amount of data are
with TAVI is even more challenging [13] and current predictors [14,15] have not been
techniques
extensively can outperform
validated across multiple conventional
centers, reaching regression
a validation models
sufficient [18]. Recently,
to be used
ods
for thehave
clinicalbeen developedFurthermore,
decision-making. and published, exploiting
external validations aregradient boosting
therefore needed to on
assess the predicting potential of one-year mortality for TAVI and this is a challenging task,
algorithm (GBDT) [19,20], to predict one-year mortality for patients treat
as will become evident from this study.
TheThe GBDT techniques
previously mentioned were validated
clinical risk scores andon retrospective patient
predictors for one-year data from
mortality
However,
rely external
on conventional validations
statistical regression were not performed.
approaches [16]. However,The in research
recent years, we per
more advanced machine learning techniques (ML) have shown competitive predictive
manuscript is meant as a natural consequence and continuation of these si
value [17]. Especially when data complexity arises and a large amount of data are involved,
searches
ML techniquespreviously mentioned.
can outperform conventionalThisregression
cross-validation
models [18].study
Recently,wastwofacilitated
ML b
collaboration
methods have been between
developedthe andtwo medical
published, and technical
exploiting universities.
gradient boosting on a decision
tree algorithm (GBDT) [19,20], to predict one-year mortality for patients treated with
External validations are necessary to assess the generalization capabi
TAVI. The GBDT techniques were validated on retrospective patient data from single
dictionHowever,
centers. model external
on other similarwere
validations populations,
not performed. albeit belonging
The research to different ce
we performed
ten
in thisthis validation
manuscript process
is meant requires
as a natural the involvement
consequence and continuationof specific ethical com
of these single-
center researches previously mentioned. This cross-validation study was facilitated by the
cols to permit the exchange of the patient data specifically for validation p
ongoing collaboration between the two medical and technical universities.
involves
Externallong administrative
validations are necessary toprocedures that arecapabilities
assess the generalization difficultofto implement
a predic-
those
tion model scenarios where
on other similar data sharing
populations, policiestoare
albeit belonging intrinsically
different centers. Mostlimited
often (e.g.,
this validation process requires the involvement of specific ethical committee protocols
Protection Regulation).
to permit the exchange of the patient data specifically for validation purposes. This in-
volves Anlongalternative
administrativesolution
proceduresto the
that aredata sharing
difficult limitations
to implement, is in
especially exchanging
those
recreating
scenarios wherethedatasame
sharingdata processing
policies pipeline
are intrinsically to perform
limited (e.g., General Data the model valid
Protection
Regulation).
any need of data sharing, as shown in Figure 2. In this research, a model
An alternative solution to the data sharing limitations is exchanging the model and
proach the
recreating hassame
been dataadopted
processingto avoidto the
pipeline exchange
perform the modelof any patient
validation, withoutdata,
any whic
otherwise
need delayed
of data sharing, and hindered
as shown in Figure 2. In thethisvalidation process. Theapproach
research, a model-exchange value of suc
has been adopted to avoid the exchange of any patient data,
approach is considerable both from a perspective of robustness and for thorwhich would have otherwise
delayed and hindered the validation process. The value of such a validation approach is
the models.
considerable both from a perspective of robustness and for thoroughly testing the models.
Figure 2. Diagram of the inter-center cross-validation. The entire exchange process is obtained
Figure 2. Diagram of the inter-center cross-validation. The entire exchange proces
by organizing a cross-validation protocol in three main stages, which requires the exchange of the
organizing a cross-validation protocol in three main stages, which requires the excha
models and their evaluation. Each model is validated on the initial center and on the validation
els and
center. theira comparison
Finally, evaluation. Eachthe
between model isvalidation
internal validated andon
thethe initial
external centerresults
validation and is
on the v
Finally, to
performed a evaluate
comparison between
the performance the model
of each internal
on anvalidation and
unseen external thedataset.
center external validatio
formed to evaluate the performance of each model on an unseen external center da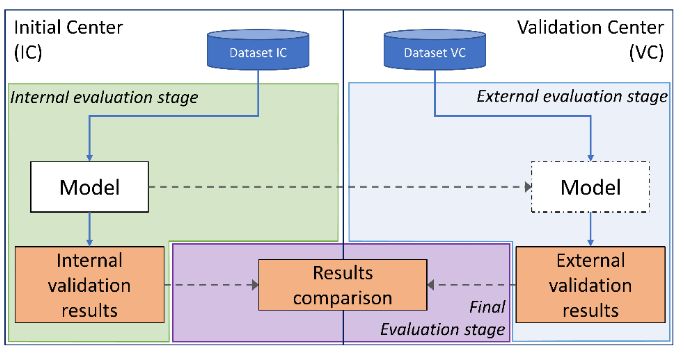
J. Cardiovasc. Dev. Dis. 2021, 8, 65                                                                                             4 of 20

                                            To the best of our knowledge, this is the first extended cross-validation for predicting
                                       TAVI outcomes, performed across centers while not involving any data exchange. Some studies
                                       have been performed on national registries containing multiple-center data [21–23], however,
                                       data exchange was required and cross-validations to evaluate each model robustness across
                                       multiple centers were not performed. Summarizing, the clinical and technical relevance
                                       of what is presented in this study is remarkably important for the TAVI procedure and
                                       for further studies that will require external validations across multiple centers with
                                       insurmountable data privacy restrictions. This study is not meant to be a comparison
                                       between the models of both centers, since clinical features, data processing and classifiers
                                       optimization were commonly adopted to guarantee the highest similarity across the center’s
                                       experiments. In fact, the performance of various models which are later validated on data
                                       of other centers can also be highly influenced by population differences and different
                                       data distributions. This study aims also to analyze this problem, for dedicated models for
                                       the TAVI procedure, by performing several experiments with different machine learning
                                       classifiers, in order to quantify their robustness and identify the classifier with the lowest
                                       performance drop caused by data of another center.
                                            This work has multiple clinical and technical contributions.
                                       •    First, we create multiple different mortality prediction models for the TAVI procedure
                                            per center, based on state-of-the-art machine learning techniques.
                                       •    Second, we optimize the TAVI models to better perform on the validation set and we
                                            evaluate their predicting potential on the test set of each original center.
                                       •    Third, we cross-validate all TAVI models, involving the two centers with different
                                            populations and we compare their predicting capability with respect to their internal
                                            evaluation.
                                       •    Ultimately, this study proposes an exchange protocol which can be extended to be
                                            used in further clinical use cases that can benefit from external validations or cross-
                                            validations.

                                       2. Materials and Methods
                                            In this section, details about the dataset, the inter-center cross-validation protocol, and
                                       the experimental setup are provided.

                                       2.1. Datasets
                                             The dataset available at the Eindhoven University of Technology (Technische Univer-
                                       siteit Eindhoven, TU/e) was obtained from the Catharina Hospital of Eindhoven (Catharina
                                       Ziekenhuis Eindhoven, CZE) and consisted of 631 consecutive TAVI procedures that were
                                       performed between January 2015 and December 2018. From this point onwards, the col-
                                       laboration, based on the Eindhoven MedTech Innovation Center (e/MTIC) consortium,
                                       between TU/e and CZE is referred to in this work as CZE-TU/e. The dataset available at
                                       the Amsterdam UMC-Location AMC (Amsterdam University Medical Center, Location
                                       AMC) consisted of 1300 TAVI procedures performed between October 2007 and April 2018.
                                       Most procedures were performed by using the following models of artificial aortic valves:
                                       •    SAPIEN XT and SAPIEN 3, Edwards LifeSciences (Irvine, CA, USA);
                                       •    CoreValve and CoreValve Evolut, Medtronic (Minneapolis, MN, USA).
                                            Transfemoral access was the most widely used access site to perform the procedures.
                                       However, a portion of the procedures, for both CZE and AMC, were performed by using
                                       an alternative access site. As later discussed, valve type and manufacturer and the access
                                       site have not been included as clinical features for this analysis study, since they are
                                       not considered patient data but procedure-related data, which are more important in
                                       procedural mortality than for one-year mortality. In recent years, procedural mortality
                                       significantly dropped and, in this study, the procedural time intervals of the two centers
                                       is substantially different (2007–2018 against 2015–2018). Furthermore, clinical protocols
                                       for patient selection and for the procedure also changed over time and across different
                                       centers. For these reasons, we have chosen to leave out any procedural data to obtain
J. Cardiovasc. Dev. Dis. 2021, 8, x FOR PEER REVIEW 5 of 20
J. Cardiovasc. Dev. Dis. 2021, 8, 65 stantially different (2007–2018 against 2015–2018). Furthermore, clinical protocols for 5 of 20
pa-
tient selection and for the procedure also changed over time and across different centers.
For these reasons, we have chosen to leave out any procedural data to obtain a fairer com-
parison
a fairer [24]. For instance,
comparison [24]. the
For artificial
instance,aortic valve is aortic
the artificial itself also subject
valve to changes
is itself due to
also subject to
the research which leads to technical advancements, whereas physiological
changes due to the research which leads to technical advancements, whereas physiological information
is less prone is
information toless
changes
proneacross time and
to changes across
across timemultiple centers.
and across multiple centers.
Prior to performing any analysis, datasets of both
Prior to performing any analysis, datasets of both centers centers were divided
were intointo
divided two two
dif-
ferent groups, representing two different categories of the population. For each
different groups, representing two different categories of the population. For each group, group, an
identification class
an identification (or(or
class label) was
label) wasassigned
assignedaccordingly
accordinglytotothethepatient
patientsurvival
survival after
after one
one
year from the date of the TAVI procedure. The two main groups were
year from the date of the TAVI procedure. The two main groups were identified as: identified as:
•• Survived
Survived at
at one
one year
year (1171
(1171 patients
patients for
for AMC and 564
AMC and 564 patients
patients for
for CZE-TU/e),
CZE-TU/e),
•• Non-survived at one year (129 patients for AMC and 67 patients for CZE-TU/e).
Non-survived at one year (129 patients for AMC and 67 patients for CZE-TU/e).
The mortality information
The mortality informationwas
wascollected
collectedafter
afterone
one year
year from
from thethe procedure
procedure through
through the
the census of the national population of the Netherlands for CZE-TU/e and during
census of the national population of the Netherlands for CZE-TU/e and during a follow-up a fol-
low-up study
study for AMC.forTime-to-event
AMC. Time-to-event has a median
has a median value ofvalue of 55(IQR
55 days days=(IQR = 153 for
153 days) days)
AMCfor
AMC
and ofand of 93(IQR
93 days days=(IQR = 176 days)
176 days) for CZE-TU/e.
for CZE-TU/e.
The
The reporting
reporting of this paper adheres to the “transparent reporting of a multivariable
prediction
prediction model for individual prognosis or diagnosis” (TRIPOD) guidelines [25]. The
TRIPOD statement can be found in the Supplementary Materials.
Clinical Data
2.2. Clinical Data Processing
Processing
Clinical data
dataare
areharmonized,
harmonized, imputed,
imputed,pre-processed and in
pre-processed andsome
in cases
someoversampled
cases over-
before being used to train the classifiers. In this section all the steps are discussed with
sampled before being used to train the classifiers. In this section all the steps are discussed
reference to Figure 3.
with reference to Figure 3.
Figure 3. Detailed diagram of the inter-center cross-validation. Training, validation and evaluationevaluation are shown in yellow
color, while data
color, while data harmonization,
harmonization, imputation,
imputation, pre-processing
pre-processing and
and class-balancing
class-balancing strategy
strategysteps
stepsareare shown
showninin grey
grey color.
color.
The inter-center
The inter-center cross-validation
cross-validation protocol is organized
protocol is organized in
in three
three stages:
stages: internal
internal evaluation,
evaluation, external
external evaluation
evaluation and final
and final
evaluation. The first two stages share a common clinical data processing, a common validation order and evaluation met-
evaluation. The first two stages share a common clinical data processing, a common validation order and evaluation metrics.
rics. The internal evaluation stage (left) and the external evaluation stage (right) share a common processing chain includ-
The internal evaluation stage (left) and the external evaluation stage (right) share a common processing chain including
ing imputation and pre-processing steps. The final evaluation stage (bottom) is the last stage which is necessary to com-
imputation
pare and pre-processing
the internal steps.with
validation results The the
finalexternal
evaluation stage (bottom)
validation results. is
Atthe
thelast stage
first twowhich
stages,is each
necessary toiscompare
model the
evaluated,
internal validation results with the external validation results. At the first two stages, each model is evaluated,
while at the final stage, both internal and external validation results are compared for a final performance assessment. while at the
final stage, both internal and external validation results are compared for a final performance assessment.
2.2.1. Data Harmonization
The data-harmonization stage is a preliminary yet important and extensive step that
implements the alignment of the dataset to a common representation. In fact, only patient
data that was common (cross-available) to both centers was included in the study. When
the clinical data was represented in a different form, the harmonization step was requiredJ. Cardiovasc. Dev. Dis. 2021, 8, 65 6 of 20
to match the different data representations to realize a common one. Clinical data are both
represented as numerical and as categorical information. Whereas numerical data can be
represented in different units easily convertible and interchangeable, categorical data can
be expressed with a different number of instances. In case the number of categories were
different, we reduced the number of categories to an amount common to both datasets.
The main harmonization steps that were performed at this preliminary stage are explained
in detail in Table A2 (Appendix B). As a natural consequence, each dataset during its
collection process is afflicted with a certain number of missing values. In this research, we
initially discarded all features that had 80% or more missing values, for at least one of the
two centers. Missing values for all the features that were included in the study (therefore
with a percentage of missing values lower than 80%) were imputed, as explained in the
next section. This threshold was jointly chosen by the two centers to guarantee that an
adequate number of important features were available, despite the amount of missing
information. The main reasons why data was missing is because of random events leading
to the data not being collected, but also because of non-random events [26,27]. For this
last scenario, a dependency between the data collection and clinical protocols can exist,
which can affect the collection of that type of data, not considering it of crucial importance
for the decision making of a specific patient. This type of missing information can be very
center dependent since clinical hospitals and academic medical centers often do not share
the same clinical protocols.
A total of 16 clinical features were used in the study and are all listed in alphabetical
order in Table A3 (Appendix B). Further information about quantity of missing values are
shown in Figure A2 (Appendix B).
2.2.2. Data Imputation
Missing values were then imputed with the mean value for numerical features and
with the mode of the instances for categorical features. The survived and non-survived
classes were not considered for the computation, leading to the consideration of a unique
mean or mode per feature and per center. These unique values per feature and per center
were then used to impute the training, validation and test set of each respective center. As
known, taking the median value is robust to outliers. However, as observed in Figure 4,
data in the survived and non-survived distributions have shown that the median value does
not incorporate a large number of outliers, which represent a large sub-population of both
two centers. This is the reason replacing numerical missing values with a mean value was
preferred, since the mean includes the outliers and has shown a higher consistency in its
value, with respect to the survived and non-survived distributions across the two centers.
This approach was also chosen because of its low computational complexity, but also
because it is a well-known standard approach in the machine learning field. Furthermore,
we considered using imputation values taken from the original center data (center-specific
imputation), since slightly different data distributions over the two centers did emerge. As
specified in the previous section, different clinical protocols are adopted across the two
centers, and also, for this reason, a center-dependent approach was preferred. Further
information about data distributions is listed in Table A3 (Appendix B) and shown in
Figure 4.
2.2.3. Data Pre-Processing
Pre-processing for most of the machine learning classifiers does require two important
distinctions, in case of dealing with categorical or numerical data. Whereas one-hot
encoding is used for categorical features, numerical features are standardized by removing
their mean and by scaling them to unit variance. To perform the standardization, the mean
and the standard deviation values are computed from the training set of the initial center
from a scaling function, which is used to standardize all data of both centers. After one-hot
encoding, the clinical data shown in alphabetical order in Table A3 (Appendix B) resulted
in 22 features.J. Cardiovasc. Dev. Dis. 2021, 8, 65 7 of 20
J. Cardiovasc. Dev. Dis. 2021, 8, x FOR PEER REVIEW 7 of 20
Figure
Figure 4. 4.Boxplot
Boxplotdistributions
distributions of
of the
thenumerical
numericalfeatures forfor
features the the
twotwo
different centers.
different AMC and
centers. AMCCZE-TU/e feature distri-
and CZE-TU/e feature
butions are shown in blue and orange, respectively. Imputed data for missing values are not included to avoid influence
distributions are shown in blue and orange, respectively. Imputed data for missing values are not included to avoid
on the original data distribution.
influence on the original data distribution.
2.2.3. Data Pre-Processing
It should be noted that not all classifiers are required for one-hot encoding or stan-
Pre-processing
dardization. for most of the was
In fact, pre-processing machine learning
omitted classifierssince
for XGBoost, doesitrequire
required two im-the
only
portant distinctions, in case of dealing with categorical or numerical
replacement of categorical instances with numerical values, and also for CatBoost since it data. Whereas one-
hotinternal
has encoding is dedicated
and used for categorical features,
pre-processing fornumerical
categorical features
data. are standardized by re-
moving their mean and by scaling them to unit variance. To perform the standardization,
the mean
2.2.4. and the standard
Class-Balancing deviation
Strategies values are
and Learning computed from the training set of the
Approaches
initial center from a scaling function, which is used to standardize all data of both centers.
The TAVI procedure has a high chance of success and only a small fraction of the
After one-hot encoding, the clinical data shown in alphabetical order in Table A3 (Appen-
patients have non-favorable outcomes. This results in an imbalanced class problem [28]
dix B) resulted in 22 features.
which was addressed with three approaches:
It should be noted that not all classifiers are required for one-hot encoding or stand-
(1) Balanced
ardization. classpre-processing
In fact, weighting (as was ClassWeight),
omitted for XGBoost, since it required only the re-
(2) Random
placement of oversampling of the with
categorical instances minority class (as
numerical RandomOvers),
values, and also for CatBoost since it
(3) SMOTE-NC
has internal for the minority
and dedicated class. for categorical data.
pre-processing
Including balanced class weighting [29] for each classifier training was the first so-
2.2.4. that
lution Class-Balancing
was adopted. Strategies
Random andoversampling
Learning Approaches
of the minority class was applied prior
The TAVI
to training each procedure has aanhigh
classifier until equalchance of success
proportion and only
between a small
classes was fraction
reached.ofFinally,
the
patients
the SMOTE-NC have non-favorable outcomes.
(synthetic minority This resultstechnique
oversampling in an imbalanced classand
for nominal problem [28]
continuous)
which was
technique addressed
[30,31] with three approaches:
was tested.
A total amount of
(1). Balanced class weightingsix machine learning classifiers (I-VI) have been exploited to generate
(as ClassWeight),
different
(2). Random prediction models and
oversampling willminority
of the be presented in RandomOvers),
class (as the following order. (I) Support vector
machine classifierfor
(3). SMOTE-NC (SVC) and (II) logistic
the minority class. regression (LR) represent the core of ML, since
they are robust and
Including widespread
balanced across multiple
class weighting [29] for fields of research.
each classifier (III) was
training Random forest
the first solu-(RF),
(IV)
tion that was adopted. Random oversampling of the minority class was applied prior to on
XGBoost (XGB) and (V) CatBoost (CatB) were included because they are based
decision
trainingtrees, which are
each classifier optimal
until for proportion
an equal dealing with categorical
between classesfeatures common
was reached. in clinical
Finally, the
data. Lastly, (VI) neural networks (NN) are considered for their
SMOTE-NC (synthetic minority oversampling technique for nominal and continuous) recent exponential growth
due to the widespread
technique successful use in data and image analysis. An explanation for the
[30,31] was tested.
classification algorithm
A total amount of six of each classifier
machine is provided
learning classifiersin(I-VI)
the Supplementary
have been exploited Materials.
to gen-
erate different prediction models and will be presented in the following order. (I) Support
2.3. Validation
vector machine andclassifier
Evaluation Metrics
(SVC) and (II) logistic regression (LR) represent the core of ML,
sinceValidation of the model
they are robust has been performed
and widespread with fields
across multiple a stratified twentyfold
of research. cross-validation,
(III) Random for-
soest (RF),
that 5%(IV) XGBoost
of the (XGB) and
entire dataset was(V) CatBoost
used as test (CatB)
set for were
internalincluded because
validation per they
fold. are
From
based
the on decision
remaining datatrees,
(95%), which
90%arewas optimal
used asfortraining
dealing with
set andcategorical
10% as features
validationcommon
set. The
in clinicalset
validation data.
wasLastly,
employed(VI) neural networks
to perform some(NN)workare considered
on the optimal for their recent expo-
hyperparameter setting
to verify optimal convergence of the classifiers during the training process. Therefore, the
validation set (in some cases within a tenfold cross-validation (CV) on the training set as
specified in the section on hyperparameters of the Supplementary Materials) was used toJ. Cardiovasc. Dev. Dis. 2021, 8, 65 8 of 20
find the optimal parameters for each model, to identify the best classifier on the validation
score for each fold individually.
Despite being computationally intensive, this type of validation required three dif-
ferent split sets (training, validation and test set). This approach was chosen to avoid
overoptimistic results, to reduce overfitting and to increase the generalization capabilities
of the classifiers on another center population, guiding the training process to an optimal
convergence.
Once each classifier was trained and tuned on the original center data, to generate the
optimal prediction models for each fold, all models were transferred to the other center to
perform the external validation. The pre-processing stage per fold was also transferred to
guarantee common and identical data processing for the two different datasets.
The external validation was performed with a similar approach; thus, a stratified
twentyfold CV on the other center data was used to assess the performance of each model.
It is worth mentioning that each of the 20 models generated per classifier on the original
center data were validated on one unique fold of the other center data. This approach
was chosen to guarantee a similar validation method and metric to the one used for the
internal validation.
The main purpose of this study was to assess the capability of several classifiers to
discriminate across two groups and two different centers. Proper calibration of the models
was not required, since the development of a risk score was beyond the scope of research.
However, a calibration study was performed to provide insights related to the probability
distributions obtained on the two center populations.
The area under the curve (AUC) of the receiver operating characteristic (ROC) (known
as c-statistic) and Brier loss score were computed and reported for all classifiers, while
calibration curves and ROC curves were reported for the top-three classifiers (based on
AUC of the ROC) of each center and experiments, for both the internal and external
validations results.
2.4. Experimental Setup
Two independent experiments have been performed, one considering CZE-TU/e as
initial center (IC: CZE-TU/e) and AMC as validation center (VC: AMC), and vice versa.
These two experiments were of crucial importance to perform the external validation with
a bi-directional approach to both centers, in other words an inter-center cross-validation.
For each of the two experiments, two evaluations were required. At first, an internal
evaluation of the models was performed to assess the prediction potential of the classifiers
on the initial center data. Second, an external evaluation of the identical models was
required to assess the prediction potential of the classifiers on the external center data.
To provide reliable evaluation scores that could be later compared between both centers,
a specific twentyfold cross-validation approach for both centers was developed. Both
centers’ datasets were split into twenty stratified folds and these folds were used for both
the internal and the external evaluations across both centers’ experiments. A total amount
of twenty AUC values of the ROC were obtained to evaluate and assess the prediction
potential for all the models. Final scores consisted of mean, standard deviation and interval
of confidence of the twenty AUC values per classifier, sub-experiments (class-balancing)
and experiments (cross-validation across centers). All comparisons between the internal
and external validation results were based on these evaluation metrics.
All experiments were performed on Python 3.6.9 using scikit-learn library 0.21.3.
3. Results
In this section the two different populations and all experimental results are presented
in detail. At first, a comparison between the internal validation of the two centers is
performed. Then, the internal and external validation results are compared, considering
CZE-TU/e as initial center and AMC as validation center, and vice versa. All results are
shown in Table A1 (Appendix A), and top-three results per center for both the internal andJ. Cardiovasc. Dev. Dis. 2021, 8, 65 9 of 20
external validations are shown in Figure 5. Figure 6 portrays the distributions of all the
results while Table 1 presents a final evaluation for both centers.
Table 1. Final evaluation, internal and external validation results comparisons based on mean AUC of the ROC curve. AUC
is shown as mean and the improvement or drop in the performance of the classifier (∆) in expressed in percentage with
respect to the mean AUC of the internal and of the external validation.
Class-Balancing Strategy
Balanced-Class Random
Weighting Oversampling
Internal External Internal External
∆ (%) ∆ (%)
eval. eval. eval. eval.
IC: CZE-TU/e, VC: AMC 0.58 0.55 −5% 0.55 0.59 +7%
SVC 1 IC: AMC, VC: CZE-TU/e 0.63 0.65 +3% 0.57 0.58 +2%
IC: CZE-TU/e, VC: AMC *0.65* *0.62* −5% 0.64 0.60 −7%
LR 2 IC: AMC, VC: CZE-TU/e 0.66 0.65 −2% 0.65 0.64 −2%
IC: CZE-TU/e, VC: AMC 0.62 0.58 −7% 0.63 0.58 −9%
RF 3 IC: AMC, VC: CZE-TU/e *0.67* *0.66* −2% 0.61 0.64 +5%
IC: CZE-TU/e, VC: AMC 0.60 0.60 0% 0.58 0.59 +2%
XGBoost 4 IC: AMC, VC: CZE-TU/e 0.64 0.62 −3% 0.62 0.59 −5%
IC: CZE-TU/e, VC: AMC 0.63 0.59 −7% 0.65 0.58 −12%
CatBoost 5 IC: AMC, VC: CZE-TU/e *0.65* *0.68* +4% 0.61 0.58 −5%
IC: CZE-TU/e, VC: AMC 0.64 0.57 −12% 0.59 0.59 0%
NN small 6 IC: AMC, VC: CZE-TU/e 0.63 0.57 −11% 0.61 0.60 −2%
IC: CZE-TU/e, VC: AMC 0.60 0.55 −9% 0.62 0.54 −15%
NN large 7
IC: AMC, VC: CZE-TU/e 0.60 0.54 −11% 0.58 0.56 −4%
IC: CZE-TU/e, VC: AMC 0.62 0.55 −13% 0.58 0.52 −12%
NN deep 8
IC: AMC, VC: CZE-TU/e 0.61 0.54 −13% 0.58 0.54 −7%
1 Support-vector machine classifier [32], 2 Logistic regression, 3 Random Forest [33], 4 Extreme gradient Boosting [34], 5 CatBoost [35,36],
6 Neural network small 12 neurons-2 layers, 7 Neural network large 140 neurons-2 layers, 8 Neural network deep 84 neurons-3 layers.
J. Cardiovasc. Dev. Dis. 2021, 8, x FOR PEER REVIEW 10 of 20
Top-three results per center are marked in bold font. The highest AUC results, reported in the abstract, for both the internal and the external
validations are marked between asterisks.
(a) internal validation (b) external validation
Figure
Figure 5. Area
5. Area under
under curve
curve (AUC)
(AUC) of the
of the receiver
receiver operating
operating characteristic
characteristic (ROC)
(ROC) forfor
thethe top-three
top-three classifiers
classifiers perper center
center with
with the highest validation score are shown with different colors. Both centers internal validation (a) and external valida-
the highest validation score are shown with different colors. Both centers internal validation (a) and external validation
tion (b) AUC metrics are shown jointly in this figure to highlight the similarity.
(b) AUC metrics are shown jointly in this figure to highlight the similarity.(a) internal validation (b) external validation
Figure
J. Cardiovasc. Dev.5.Dis.
Area under
2021, 8, 65 curve (AUC) of the receiver operating characteristic (ROC) for the top-three classifiers per center 10 of 20
with the highest validation score are shown with different colors. Both centers internal validation (a) and external valida-
tion (b) AUC metrics are shown jointly in this figure to highlight the similarity.
(a)
(b)
Figure 6. Boxplot results considering (a) CZE-TU/e as initial center and AMC as validation center and considering (b) AMC
as initial center and CZE-TU/e as validation center. Both the internal and external validations per classifier are shown in
blue and orange, respectively.
3.1. Analysis of the Data Distributions across the Centers
An analysis for comparison of the two different center populations was needed for as-
sessing the main differences between the two populations, due to possible variations in the
distribution of the clinical data. The distributions of the numerical and categorical features
for both centers are displayed with boxplots and bars in Figures 4 and A2 (Appendix B),
respectively. Alternatively, category occurrences for each of the categorical features and
missing value information for all clinical features can be obtained for further analysis from
Table A3 (Appendix B).
No major differences were found between the two populations. However, some
numerical and categorical features showed different distributions. The main differences
can be explained by the different standard deviations across the two populations. In some
cases, the quantity of statistical outliers is also different, but in most cases when outliers
are present, they appear to occur for both centers jointly above or below the median value,
therefore not resulting in an asymmetry between the two centers’ distributions. In some
cases, the non-survived group showed a higher or lower median value with respect to the
survived group; these corresponded across both populations. Exceptions are aortic valve
mean gradient, body mass index, creatinine and hemoglobin. However, by including the
outliers and by considering the mean values solely, these differences appear to reduce.J. Cardiovasc. Dev. Dis. 2021, 8, 65 11 of 20
3.2. Internal and External Validations
The first part of the two experiments consisted in the internal validation of CZE-
TU/e and AMC. The classifiers that showed the highest AUC results for CZE-TU/e were:
Logistic regression (ClassWeight) with 0.65 ± 0.12, Logistic regression (RandomOvers)
with 0.64 ± 0.15 and CatBoost (RandomOvers) with 0.65 ± 0.16. For the AMC, the highest
AUC results were reached by: Random forest (ClassWeight) with 0.67 ± 0.11, Logistic
regression (ClassWeight) with 0.66 ± 0.12 and CatBoost (ClassWeight) with 0.65 ± 0.09.
AUC curves for the classifiers mentioned above can be found in Figure 5 (left). The highest
results were obtained with balanced-class weighting and random oversampling. Therefore,
only these two class-balancing strategies will be further discussed. However, all the AUC
results for each class-balancing strategy can be found in Table A1 (Appendix A).
The second part of the two experiments consisted in the external validation for models
trained on CZE-TU/e data and tested on AMC data, and vice versa. The classifiers that
showed the highest external validation results for models trained on CZE-TU/e were:
XGBoost (ClassWeight) with 0.60 ± 0.09, logistic regression (ClassWeight) with 0.62 ± 0.12
and logistic regression (RandomOvers) with 0.60 ± 0.13. For AMC, the highest external
validation results for models trained on AMC data were reached by: Random forest
(ClassWeight) with 0.66 ± 0.15, Support vector machine classifier (ClassWeight) with
0.65 ± 0.14 and CatBoost (ClassWeight) with 0.68 ± 0.16. AUC curves for the classifiers
mentioned above can be found in Figure 5 (right).
A calibration study was performed for the top-three classifiers shown in Figure 5. The
results of the study can be found in the Supplementary Materials with the Brier Score loss
of each classifier involved in the experiments.
3.3. Final Evaluation
All distributions for all the results collected during the two experiments (both internal
and external validations) that were performed are displayed in Figure 6.
From a first visual inspection of the results, it can be clearly noticed that all the distri-
butions show a high standard deviation. Boxplots results show, as an overall impression,
that when the models are generated by using the dataset of CZE-TU/e, lower results are
observed in the external validation, but when the models are generated by using the dataset
of AMC, more similar and sometimes higher external validation results are observed. These
observations are reflected by both the median value and the interquartile range of the
boxplots. The top-three results per center, shown in Figure 5, and the highest AUC results
for both the internal and the external validations, are marked in Table 1, in bold font and
between asterisks, respectively.
The first experiment with CZE-TU/e as initial center and AMC as validation center has
shown that the best classifiers, based on AUC metrics, were logistic regression (ClassWeight)
with 0.65 ± 0.12 for the internal validation and with 0.62 + 0.12 for the external validation,
and logistic regression (RandomOvers) with 0.64 ± 0.15 for the internal validation and
0.60 ± 0.13 for the external validation. A performance drop at the external validation,
ranging from 5–7%, is observed.
The second experiment with AMC as initial center and CZE-TU/e as validation
center has shown that the best classifiers, based on AUC metrics, were random forest
(ClassWeight) with 0.67 ± 0.11 for the internal validation and with 0.66 ± 0.15 for the
external validation, and CatBoost (ClassWeight) with 0.65 ± 0.09 for the internal validation
and 0.68 ± 0.16 for the external validation. A performance drop of 2% at the external
validation is observed for random forest, while an improvement in the performance of 4%
at the external validation is noticed for CatBoost.
4. Discussion
4.1. Feature Representation and Distributions
The initial setup of two distributions for each center is interesting for comparison
but also invokes some issues. It was seen that missing values, missing features andJ. Cardiovasc. Dev. Dis. 2021, 8, 65 12 of 20
different feature representations are obstacles which can interfere with the inter-center
cross-validation purpose. In some cases, the amount of missing data was too high to
allow data usage but in most of the cases data harmonization was possible. By imposing
some decision rules (if missing data is above 80%, the feature is ignored, with lower
numbers harmonization is typically possible but with a fair weighting of exclusion of
specific cases to avoid penalization of centers). Different feature representations can be
properly harmonized across the two centers to prepare the datasets for an optimal and fair
cross-validation. The possibility to make a center-based comparison makes this effort of
data harmonization worthwhile to perform.
Feature distributions for the two sub-groups of survived and non-survived to one-
year patients should be taken into account before adopting any imputation techniques for
missing values. The imputation can be a unique shared imputation or a center-dependent
imputation, as in this study.
4.2. Dataset and Related Validation Aspects
The metrics that have been provided with this inter-center cross-validation approach
are completely exempt of any information leak that could occur from the test set to the
validation or training set. In fact, in both conducted experiments, both centers were blind
relative to each other, leading to a strict validation approach which is often non-typical
for other studies available in literature [14,15,21–23,37,38]. This makes our inter-center
cross-validation very valuable and unique.
With respect to the TAVI procedure our work has identified the best classifiers for a
center to model their data. These classifiers are then interesting candidates for validation at
other centers. This makes the validation highly interesting for both centers. Furthermore,
it can be noticed that a larger dataset can offer similar and sometimes higher prediction
accuracy with respect to a smaller dataset.
Concerning the class-balancing strategies, random oversampling of the minority class
has shown lower or similar results with respect to the class-balancing strategy for both the
internal and external validations. On the other hand, SMOTE-NC shows poor prediction
accuracy with respect to the other class-balancing strategies, possibly because the data
interpolation is introducing too much variability and redundant information into the data.
4.3. Discussion on the Obtained Results
A high standard deviation in the AUC results is observed. This is mainly due to the
relatively small sample size of the test set. Using a larger dataset or a reduced number
of folds for the k-fold cross-validation would decrease the standard deviation, but most
certainly also the validation results. This is because a lower number of patients would have
been taken into account in the training set to generate the models.
When logistic regression is used on the smaller dataset of CZE-TU/e, it provides
higher prediction accuracy with respect to the one obtained by all the other classifiers.
However, when applying support vector machine, this leads to a low prediction accuracy
when trained on the smaller dataset of CZE-TU/e. XGBoost, Random Forest and CatBoost
have shown similar or better results with respect to logistic regression on the larger dataset
of AMC. In general, neural networks have shown good prediction accuracy on the internal
validations for both centers. However, poor results have been obtained for the external
validations, exhibiting the highest drop in accuracy at the external validation.
The previous discussion on the prediction accuracy with various classifiers is con-
firmed by the presented boxplots results, which show on average, that when the models
are generated using the dataset of CZE-TU/e, somewhat lower results are obtained for
the external validation, while when the models are generated using the dataset of AMC,
more similar or sometimes even higher results are achieved for the external validation.
This phenomenon is related to the amount of available data for machine learning. Lo-
gistic regression (ClassWeight and RandomOvers) shows to be ideal for generating the
models with the small-scale dataset, while random forest (ClassWeight) and CatBoostYou can also read