Magnetostrictive vibration sensor for a self-powered structural health monitoring system
←
→
Page content transcription
If your browser does not render page correctly, please read the page content below
Bulletin of the JSME                                                                                          Vol.16, No.1, 2022
             Journal of Advanced Mechanical Design, Systems, and Manufacturing

         Magnetostrictive vibration sensor for a self- powered
                structural health monitoring system
     Shinji KOGANEZAWA*, Tomotake ISHII**, Hiroshi TANI*, Renguo LU* and Norio TAGAWA*
                                   * Department of Mechanical Engineering, Kansai University
                                       3-3-35 Yamate-cho, Suita, Osaka 564-8680 Japan
                                                 E-mail: skoga@kansai-u.ac.jp
                                                  ** Toyota Motor Corporation
                                   Toyota-Cho, Toyota City, Aichi Prefecture 471-8571, Japan

              Received: 2 December 2021; Revised: 22 December 2021; Accepted: 27 December 2021

    Abstract
    Previously, we proposed a self-powered vibration-based structural health monitoring system for diagnosing the
    structural soundness of entire bridges to screen bridges requiring detailed inspection. The core part of the system
    is the vibration-sensing device that is in the developing phase. This part relies on the Villari effect of
    magnetostrictive materials. In particular, the vibration-sensing device is a dual-use device that can serve as a
    vibration sensor and a power generator. This paper describes the design and evaluation results of the device’s
    performance. Galfenol, a typical magnetostrictive material, was used. Therefore, we first investigate the
    relationship between the magnetic flux density variation and the compression stress with different bias magnetic
    fields applied to the Galfenol rod. Moreover, an adequate range of the bias magnetic field was determined to
    maximize the power-generation performance and sensitivity of vibration. Subsequently, the prototype of the
    vibration-sensing device was designed and built, and a field test was conducted. The experimental results
    confirmed that the device works as a vibration sensor with high resolution. The device accurately detected the
    natural frequency of a bridge, even when subjected to the intermittent load of passing cars. The device generated
    30.3 mJ in an hour even though it is a small-sized non-resonant power generator. With such generated energy,
    diagnosing the structural health at least once every two days can be executed with the developed device.

    Keywords : Bridges, Structural health monitoring system, Vibration sensor, Energy harvester, Magnetostrictive
               material, Galfenol, Villari effect, Transportation infrastructure

1. Introduction

     According to the white paper of the Ministry of Land, Infrastructure and Transport and Tourism in Japan (2020), the
percentage of told road bridges will rapidly increase because of the numerous road bridges constructed during the 1960s
and 1970s. Although in 2018, 25 % of the road bridges had more than 50 years old, an indicator of the aging of the
transport infrastructure, this indicator will reach 63% in 2033. Furthermore, human resources, such as professional
workers and engineers working on the inspection and maintenance, are gradually decreasing. Therefore, adequate
inspection and maintenance are not always conducted; this is considered a serious social problem in Japan, and several
countries are facing similar problems. In this regard, the white paper considers that it is crucial to switch from corrective
maintenance to preventive maintenance. Accordingly, technologies for effectively and efficiently diagnosing
deterioration and damage of infrastructure and related facilities become progressively essential. To this end, structural
health monitoring (SHM) systems are being actively developed (e.g., Noel et al., 2017; Lydon et al., 2014; Sazonov et
al., 2009; Kawakatsu et al., 2019; Patil and Patil, 2017; Khemapech et al., 2016; Scott et al, 2013; Sony et al, 2019).
     Currently, crack detection on road surfaces has been developed from images (Premachandra et al., 2013) and internal
crack detection using acoustic emission (AE) sensors (Usui et al., 2016 ). In particular, detecting cracks on the underlying
surface of bridges by the former is challenging; the latter can only be applied to detect local cracks. There are still
challenges regarding work volume and cost to monitor the structural soundness of entire bridges. Furthermore, they both

                                                                 © 2022 The Japan Society of Mechanical Engineers. This is an open access article under
Paper No.21-00403                                                the terms of the Creative Commons Attribution-NonCommercial-NoDerivs license
[DOI: 10.1299/jamdsm.2022jamdsm0010]                             (https://creativecommons.org/licenses/by-nc-nd/4.0/).
                                                                                                                                                          1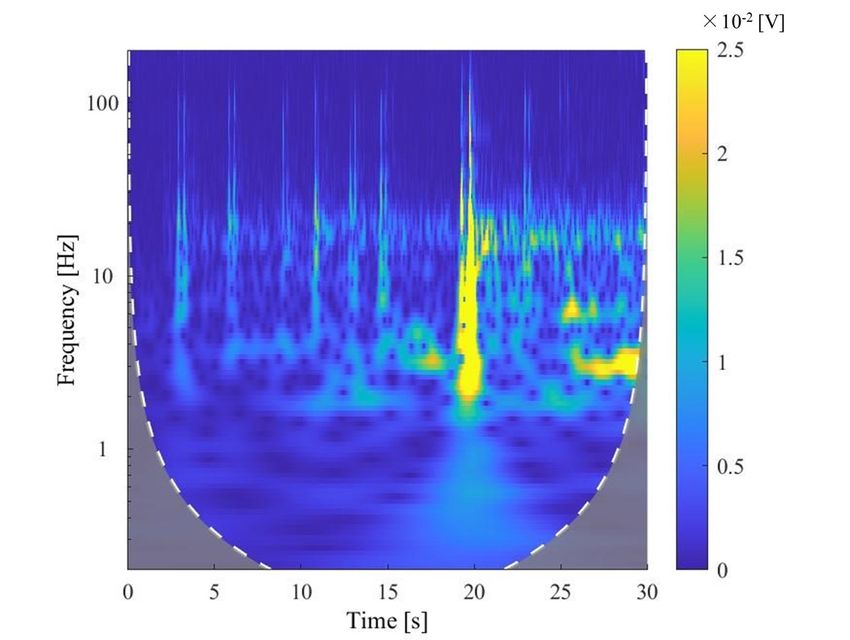
Koganezawa, Ishii, Tani, Lu and Tagawa,
              Journal of Advanced Mechanical Design, Systems, and Manufacturing, Vol.16, No.1 (2022)

cannot detect an abnormality in the bridge bearings. In contrast, vibration-based structural health monitoring (VSHM)
has the possibility of diagnosing the structural soundness of the entire bridges, including bridge bearings, and is suitable
for screening bridges requiring detailed inspection. Therefore, several studies on VSHM have been conducted. The
fundamental idea of VSHM is to extract modal parameters, such as natural frequencies and their damping ratios from the
bridge-vibration time series due to the car-passage and wind passing through the bridge and then to detect the change of
the modal parameters as a signal of abnormal occurrence in the bridge structure. Acceleration sensors are typically used
in general-scale road bridges to detect bridge vibrations. Moreover, a global navigation satellite system was sometimes
applied for large-scale bridges such as the Akashi-Kaikyo bridge (Kashima et al., 2001), which is the longest span bridge
in the world, having total and central span lengths of 3,911 m and 1,991 m, respectively. However, conventional VSHM
systems require large effort and time are due to the necessity of securing their power supplies and installation of
accelerometers. Note that energy-harvesting devices are expected to be a possible solution as a substitute for the power
source for SHM, including VSHM (e.g., Clemente et al., 2017; Liu et al., 2015; Khan et al., 2014; Orfei et al., 2016; Li
and Pillay, 2007; Pedchenko et al., 2017; Khan and Iqbal, 2016)
     To solve this problem, we have previously proposed a self-powered vibration-based structural health monitoring
system (SVSHM) (Koganezawa et al., 2020). Fig. 1 shows the theoretical overview of the proposed SVSHM system.
The core part of the system is the novel vibration-sensing device discussed in this paper, which implements a giant
magnetostrictive material. Furthermore, the vibration-sensing device is a dual-use device used that can serve as a
vibration sensor and power generator. For the application of the proposed method in a bridge, the device was placed
between the bridge girder and pier near the bridge bearing so that the compression stress was applied to the
magnetostrictive rod. Note that compressive stress in the magnetostrictive rod varies when the bridge vibrates, and the
magnetic flux density through the magnetostrictive rod also varies, accompanied by the compressive stress. Then, the
induction voltage is generated in the coil. The bridge vibration is detected by monitoring the induced voltage.
Subsequently, the SVSHM analyzes the possibility of damage occurrence. The analyzed results will be transferred via
wireless communication. Additionally, the device can be used as a power generator to supply power to a storage battery,
as the device can produce a large voltage because the magnetostrictive rod, in principle, can generate a large variation in
magnetic flux density, even for small and low-frequency vibrations of the bridge girder. The storage power is used to
drive the electric circuit of the SVSHM. Therefore, the system requires neither power-supply wiring nor batteries. Thus,
a maintenance-free system can be constructed. In our previous study (Koganezawa et al., 2020), we showed the feasibility
of the developed sensor for application in the SVSHM. However, the generated voltage was small due to low magnetic
flux density variation produced by applying the compression stress. Therefore, to increase the magnetic flux density
variation, we determined the optimal magnetic field for application to the Galfenol rod in the sensor. In this study, the
design including the optimal magnetic field and evaluation results of the developed vibration sensing-device are reported.
Moreover, the bridge vibrations detected by the developed device, when no car was passing over the bridge, are discussed.

2. Design of the vibration -sensing device
2.1 Structure and mechanical characteristics of the device

     The developed vibration-sensing device relied on the Villari effect of magnetostrictive materials. The device
comprises a cylindrical rod made of a giant magnetostrictive material (Galfenol), ring-shaped magnet (ferrite magnet),
coil, cap, base, and yoke for a magnetic circuit, as illustrated in Fig. 2. Because the magnetostrictive rod can produce
large variations in the magnetic flux density, as described in detail later, even by the small-amplitude vibration of the
bridge girder, the device can be used to generate large voltages.
     Considering the sensor performance, the output voltage of the device should be proportional to the vibration velocity,
implying that the device should not have mechanical resonances in the measurement frequency range. In other words,
the gain of the frequency response function of the sensor performance should be flat in the frequency range. However,
several power generators developed thus far have a mechanical resonance matching their frequency with the
environmental vibration frequency (e.g., the natural frequency of the bridge) to increase the power generation efficiency.
Because the sensor requirements prioritize the power-generation capability in the design of our dual-use device, the
device has a lower efficiency than a dedicated power-generation device. However, the power-generation efficiency is not
stable in the power-generator device mentioned above because the natural frequencies of the structure (e.g., bridges) can
vary according to the atmospheric temperature. In this sense, our dual-use device design has the advantage of being a

[DOI: 10.1299/jamdsm.2022jamdsm0010]                                        © 2022 The Japan Society of Mechanical Engineers
                                                                                                                               2
Koganezawa, Ishii, Tani, Lu and Tagawa,
               Journal of Advanced Mechanical Design, Systems, and Manufacturing, Vol.16, No.1 (2022)

device with robustness for long-running SVSHM systems requiring adaptability to environmental conditions.
    The prototype device is small, with a height and diameter of 43 mm and 40 mm, respectively, because a Galfenol
rod with a 10-mm diameter and 25-mm length was readily available. Furthermore, according to the finite element method
analysis, the natural frequency of the first longitudinal-vibration mode of Galfenol is 7.2 kHz, which is sufficiently high
frequency to detect bridge vibrations.

2.2 Magnetic flux density variation passing through the Galfenol rod with compressed stresses

     The design of the bias magnetic field applied to the Galfenol rod was as follows: magnetic flux density variations
passing through the Galfenol rod when compressive stress was applied for the rod were measured with some different
magnetic fields applied to the rod. Fig. 3 shows the setup for the measurement. The bias magnetic fields were given by
the coil applying different direct-currents to the coil. The device was sandwiched by non-magnetic stainless-steel plates,
and the compressive stress was applied using a compression tester. The magnetic flux density between the air gaps was
measured with a Tesla meter, and the magnetic flux density passing through Galfenol was estimated, assuming that the
leakage flux density was sufficiently small. The results are shown in Fig. 4.
     When the bias magnetic field was 15.6 kA/m, the large sensitivity of the magnetic flux density variation to the stress
was obtained for the stress range of 20 MPa or less. The larger sensitivity is preferable because it provides a larger voltage
even by the small load. There is a tendency to obtain large sensitivity under a relatively small bias magnetic field;
however, on the contrary, if it is very small, like 7.8 kA/m, the sensitivity remarkably decreases. Thus, the power
generation performance should be significantly reduced. In addition, a magnetic flux density of approximately 0.6 T was
obtained at a stress of 80 MPa with a bias magnetic field ranging from 15.6 to 23.4 kA/m. From these results, the magnetic
circuit was designed so that the bias magnetic field was within that range, resulting in 18.33 kA/m as the designed value.
Note that, from Fig. 4, as there is a strong nonlinearity between the stress and the magnetic flux density variation, which
is characteristic of Galfenol, attention should be focused on the harmonics in the measurement of the natural frequency.

                                                                    (a) Picture and isometric view of the device

                                                                         (b) Cross-section of the device
Fig. 1 Self-powered structural health monitoring
                                                                          Fig. 2 Structure of the device.
system using the developing vibration sensor.

[DOI: 10.1299/jamdsm.2022jamdsm0010]                                         © 2022 The Japan Society of Mechanical Engineers
                                                                                                                                 23
Koganezawa, Ishii, Tani, Lu and Tagawa,
              Journal of Advanced Mechanical Design, Systems, and Manufacturing, Vol.16, No.1 (2022)

                          Fig. 3. Measurement setup for the magnetic characteristics of Galfenol

         Fig. 4. Relationship between the magnetic-flux-density variation and the compressed stresses of Galfenol.

2.3 Internal impedance of the sensor
     The diameter of the wire of the coil was 0.3 mm, and the number of turns of the coil was 1033. The measured
impedance, equivalent series resistance, and inductance of the coil are illustrated in Fig. 5. They were measured when
the coil was assembled in the device as shown in Fig. 2. The DC resistance was 16.9 Ω which gradually increased with
increase in the frequency, and the inductance was approximately 0.16 H up to 5 Hz and it gradually decreased with
increase in the frequency. The measured impedance well agreed with a simple LR series circuit model of 16.9-Ω
resistance and 0.16-H inductance up to 50 Hz, which is within the frequency rage containing the major frequency
components of bridge vibrations.

[DOI: 10.1299/jamdsm.2022jamdsm0010]                                        © 2022 The Japan Society of Mechanical Engineers
                                                                                                                               24
Koganezawa, Ishii, Tani, Lu and Tagawa,
              Journal of Advanced Mechanical Design, Systems, and Manufacturing, Vol.16, No.1 (2022)

         Fig. 5. Measured impedance (upper), equivalent series resistance (bottom left) and inductance (bottom right).

3. Field test of the device
3.1 Experimental setup

     A field test of the prototype device was conducted at a bridge in the Hyogo prefecture, as illustrated in Fig. 6. The
tested bridge corresponded to a 229 m long cable-stayed bridge, with one lane on each side. The location of the sensor
device was near the entrance of the bridge under the center of a lane.
     Figures 7 and 8 show the experimental setup. The device was installed near a bridge bearing and placed between the
bridge girder and the pier. Figure 7 shows a 3D-CAD model of the sensor and its supporting part to facilitate the
understanding of the device and its supporting structure. The device was fixed to press the cap against the bridge girder
by a height adjustment mechanism. A sense-resistor was connected to the coil of the device in series, as shown in Figure
8, and the voltage across the sense-resistor was measured. Strain gauges were installed on the Galfenol rod, and the strain
of the rod was measured simultaneously. In addition, the displacement of the bridge girder to the pier was measured using
a laser displacement meter. Time series of them were collected at a sampling rate of 1 kHz using a data logger.

              Fig. 6. Cable-stayed bridge where the field test was conducted (left) and its bridge bearing (right).

[DOI: 10.1299/jamdsm.2022jamdsm0010]                                            © 2022 The Japan Society of Mechanical Engineers
                                                                                                                                   25
Koganezawa, Ishii, Tani, Lu and Tagawa,
Journal of Advanced Mechanical Design, Systems, and Manufacturing, Vol.16, No.1 (2022)
Fig. 7 Experimental setup.
Fig. 8. Setup of the developed device.
3.2 Results
3.2.1 Time series and wavelet transform
Figures 10 and 11 show waveforms of the bridge girder displacement measured by the laser displacement sensor and
the generated voltage, respectively, when a bus was approaching the bridge (Case I), as shown in Fig. 9. At 1.0 and 1.5
s, the front and rear wheels were passing over the expansion joint of the bridge. We can see sharp variations in the vertical
displacement of the bridge girder. We can also see that the waveform of the Galfenol-rod deformation was the similar to
the bridge-girder displacement, and the deformation was approximately 14% of the bridge-girder displacement. Note
that, because the pre-load was applied to the Galfenol rod, its strain was always positive. Simultaneously, two spiky
voltages were observed, corresponding to the vertical displacement variations. They are the characteristic waveform of
the developed vibration-sensing device because the device can detect the load to a bridge-girder edge by passing cars.
Moreover, the waveform is different from that of an accelerometer generally used to detect bridge vibrations. When the
front and rear wheels underwent the expansion joint, large spiky voltages of peak magnitudes 0.25 V and 0.9 V were
generated by the device, respectively.
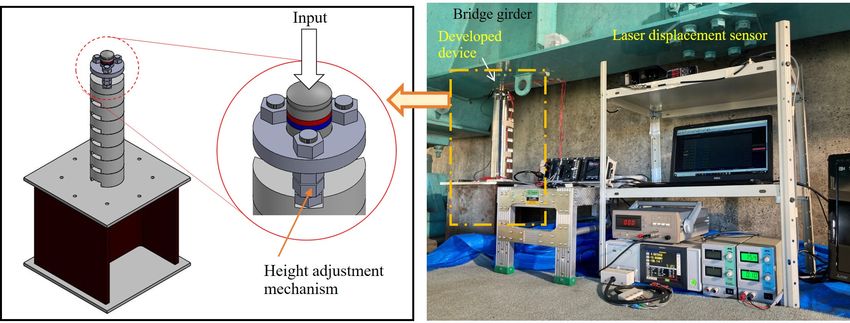
Fig. 12 depicts wavelet-transform results obtained for the generated voltage waveform, as depicted in Fig. 11. These
results indicated that several resonance modes were excited, resulting from the sudden load of the car’s weight, and the
vibration continued, constituting a residual vibration. According to the literature, typical unsprung vibration modes of
[DOI: 10.1299/jamdsm.2022jamdsm0010] © 2022 The Japan Society of Mechanical Engineers
26
Koganezawa, Ishii, Tani, Lu and Tagawa,
              Journal of Advanced Mechanical Design, Systems, and Manufacturing, Vol.16, No.1 (2022)

the front and rear wheels are in the frequency range of 10–20 Hz (Iwabuki et al., 2019). Therefore, the unsprung vibration
mode might be the one observed around 20 Hz.

                       Fig. 9 Traffic state on the bridge when the time series of Case I were obtained.

       Fig. 10 Bridge-girder displacement measured using a            Fig. 11 Time series of generated voltage by the device.
       laser displacement sensor comparing with the                   Case I: Single car was approaching the bridge
       deformation of the Galfenol rod. Case I: Single car was
       approaching the bridge.

                          Fig. 12 Wavelet transform results of the generated voltage time series.
                          Case I: Single car was approaching the bridge.

[DOI: 10.1299/jamdsm.2022jamdsm0010]                                           © 2022 The Japan Society of Mechanical Engineers
                                                                                                                                  27
Koganezawa, Ishii, Tani, Lu and Tagawa,
              Journal of Advanced Mechanical Design, Systems, and Manufacturing, Vol.16, No.1 (2022)

     Fig. 13 shows the magnetic flux density variation calculated by integrating the voltage-time series in Fig. 11. Note
that the number of turns of the coil and cross-sectional area of the Galfenol rod, used for the calculation of the magnetic
flux density variation, were 1033 and 7.854×10⁻⁵ [m2], respectively. In particular, for comparison purposes, the figure
also shows two lines for H=15.6 and 23.4 kA/m, according to Fig. 4. The compression stress was calculated from the
measured strain by the strain gauge installed on the Galfenol rod. A magnetic-flux variation of approximately 0.8 T was
obtained at 150 MPa by a bus passing through the bridge. Because the relationship between the magnetic flux density
variation and the compression stress was between two lines of H=15.6 kA/m and 23.4 kA/m, we considered that the
applied magnetic field to the Galfenol rod was close to the designed value of 18.33 kA/m.

                  Fig. 13. Variation of the magnetic flux density with the displacement of the bridge girder.

     Figures 14, 15, and 16 depict the waveform of the bridge-girder displacement compared with the Galfenol-rod
deformation, generated voltage, and wavelet transform results obtained from the generated voltage, respectively, when
several cars were continuously approaching the bridge (Case II). The nine combinations of two spectral lines shown in
Fig. 16 indicate that nine cars passed during 30 s, even though this is not evidently understood from the voltage waveform
in Fig. 15. This implies that the voltage time series involves the information of passing cars even when two spiky voltage
waveforms are unclear; thus, we can determine the number of cars passing the bridge by analyzing the voltage time series
using a data analysis method such as the deep learning method. Therefore, the device can be used as a sensor for traffic
condition monitoring systems and accounts for cars traveling in either direction.
     Fig. 16 also shows that 2-, 3-, 4- and 5-Hz vibration modes are intermittently excited by each car’s passing, and the
vibration mode excited by each car’s passing is different. Furthermore, 20-Hz vibration is continuously observed in Fig.
16.

[DOI: 10.1299/jamdsm.2022jamdsm0010]                                          © 2022 The Japan Society of Mechanical Engineers
                                                                                                                                 28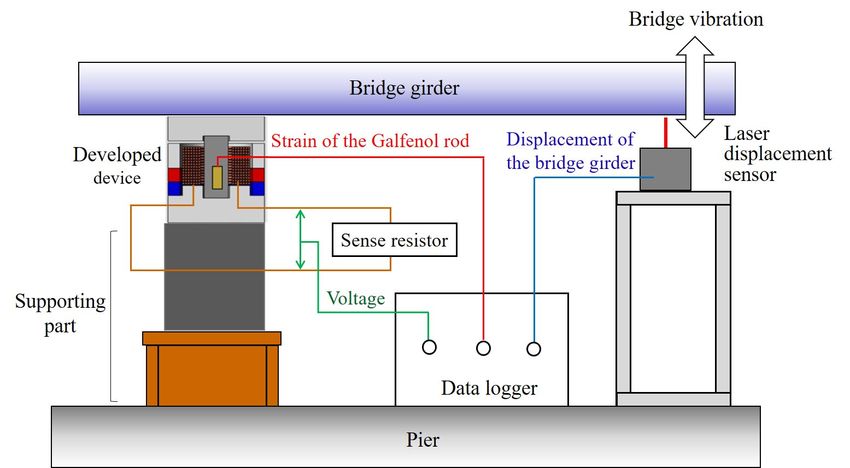
Koganezawa, Ishii, Tani, Lu and Tagawa,
              Journal of Advanced Mechanical Design, Systems, and Manufacturing, Vol.16, No.1 (2022)

  Fig. 14. Bridge-girder displacement measured using a laser            Fig. 15. Time series of generated voltage by the
  displacement sensor comparing with the deformation of the             device. Case II: Several cars were passing over the
  Galfenol rod. Case II: Several cars were passing over the             bridge.
  bridge.

                         Fig. 16. Wavelet transform results of the generated voltage time series.
                         Case II: Several cars were passing over the bridge.

3.2.2 Fourier transform results

     Fig. 17 provides a comparison of the Fourier spectra of the voltage generated by the device and the bridge-girder
velocity, derived from the displacement time series obtained by the laser displacement sensor. The spectra were averaged
50 times using the Hann window with 50% overlap. Natural frequencies of the bridge structure were observed in the
voltage spectrum at 0.66, 1.84, 2.39, 3.05, 3.58, and 3.67 Hz. They were also observed in the spectra of the bridge-girder
velocity. The results confirmed that the natural frequency of the bridge structure could be detected with a high-frequency
resolution of 0.01 Hz even when subjected to the intermittent load of passing cars.
     Fig. 18 shows the time series of the vertical bridge-girder velocity measured using the developed device. In particular,
the figure shows the case when no car was passing over the bridge (Case III). The vertical axis was converted from the
induced voltage to the vertical velocity; the sensitivity coefficient was 16.0 mm/s/V. In this case, the bridge vibration
occurred due to excitation by a microtremor of the ground and wind passing through the bridge. Fig. 19 shows the Fourier
spectra of the vertical bridge-girder velocity shown in Fig. 18. These spectra were not averaged; they were calculated
from one 50-second time series. Natural frequencies of the bridge structure were observed at 0.66, 1.84, 2.48, 3.05, 3.58,
and 3.78 Hz. Two peaks at 2.48 Hz and 3.78 Hz are higher than the results shown in Fig. 17. The reason might be that
these modes at 2.48 Hz and 3.78 Hz in Fig. 14 decreased due to the increase in the mass of the passing vehicles on the

[DOI: 10.1299/jamdsm.2022jamdsm0010]                                          © 2022 The Japan Society of Mechanical Engineers
                                                                                                                                 29
Koganezawa, Ishii, Tani, Lu and Tagawa,
               Journal of Advanced Mechanical Design, Systems, and Manufacturing, Vol.16, No.1 (2022)

bridge. We also found that the spectral density of the noise floor was 0.441 μm/s/√Hz. This value is equivalent to 0.140
nm/√Hz at 500 Hz; therefore, the developed device has a high resolution as a vibration sensor, especially in higher
frequencies.

              Fig. 17 Comparison of the Fourier spectra of the generated voltage and the bridge-girder velocity

Fig. 18 Vertical bridge-girder velocity measured using the developed sensor when no car was passing. The vertical velocity was
         converted from the induced voltage of the device.

                        Fig. 19 Fourier spectra of the vertical bridge-girder velocity shown in Fig. 18

3.2.3 Power generation

    Fig. 20 depicts the energy generated during the testing period of 3600 s. The generated energy in an hour was 30.3
mJ. This measurement was taken from approximately 1 to 2 pm when the traffic was relatively light. Assuming that the

[DOI: 10.1299/jamdsm.2022jamdsm0010]                                          © 2022 The Japan Society of Mechanical Engineers
                                                                                                                                 10
                                                                                                                                 2
Koganezawa, Ishii, Tani, Lu and Tagawa,
Journal of Advanced Mechanical Design, Systems, and Manufacturing, Vol.16, No.1 (2022)
averaged traffic volume from 6 am to 8 pm is the same as the field-test condition, 424 mJ energy generation is expected.
As we estimated that a maximum of 800 mJ of energy is required for diagnosing structural health once (Koganezawa et
al., 2020), diagnosing the structural health at least once every two days can be executed with the developed prototype
device by storing the generated energy in a battery, as shown in Fig. 1. Finally, the larger size device, including the
magnetostrictive-material rod, will be built to generate more energy in future work.
Fig. 20 Generated energy in 3600 seconds by the prototype device.
4. Conclusions
A vibration-sensing device based on the Villari effect of magnetostrictive materials (Galfenol) was designed,
fabricated and evaluated. The device is a core part of a self-powered vibration-based structural health monitoring system
that was previously proposed for diagnosing the structural soundness of entire bridges to screen bridges requiring detailed
inspection. The device is a dual-use device that can serve as a vibration sensor and power generator.
In the study, we first investigated the relationship between the magnetic flux density variation and the compression
stress with different bias magnetic fields to apply to the Galfenol rod. We found that a bias magnetic field ranging from
15.6 to 23.4 kA/m was adequate for our device to maximize the power-generation performance and sensitivity for
detecting the bridge vibration. We consequently designed the bias magnetic field as 18.3 kA/m.
Subsequently, we conducted a field test to evaluate the vibration-sensing device. The experimental results confirmed
that the device worked as a vibration sensor with a high resolution of 0.441 μm/s/√Hz, and it accurately detected the
natural frequency of the bridge, even when subjected to the intermittent load of passing cars.
The device generated 30.3 mJ in an hour even though it is a small-sized non-resonant power generator. This is because
the magnetostrictive rod generated a large variation in magnetic flux density of approximately 0.8 T, even for small bridge
vibrations. With such generated energy, the developed device can perform structural health monitoring at least once every
two days.
Acknowledgements
This work was financially supported by Kansai University Fund for Domestic and Overseas Research Fund, CSKR
Research Grant Program 2020 of Construction Services in Kinki Region, and partially JST SCORE University Promotion
Type (Developing the Environment for Creation of Startup Ecosystem in Startup Cities Type), Grant Number
JPMJST2073, Japan. This study was also totally supported by Kinki Doro CO., LTD.
References
Clemente, C. S., Davino, D. and Visone, C., Experimental characterization of a three-rod magnetostrictive device for
energy harvesting, IEEE Transactions on Magnetics, Vol.53, No.11 (2017), 2503304.
[DOI: 10.1299/jamdsm.2022jamdsm0010] © 2022 The Japan Society of Mechanical Engineers
11
2Koganezawa, Ishii, Tani, Lu and Tagawa,
Journal of Advanced Mechanical Design, Systems, and Manufacturing, Vol.16, No.1 (2022)
Iwabuki, H., Fukada, S., Osafune, T., Shimura, M. and Sasaki, E., Contribution of large-vehicle vibration and bridge
vibration to low-frequency noise generation characteristics, Applied Acoustics, Vol.155 (2019), pp. 150–166.
Kashima, S., Yanaka, Y., Suzuki, S. and Mori, K., Monitoring the Akashi Kaikyo bridge: First experiences, Structural
Engineering International, Vol.11, No.2 (2001), pp. 120–123.
Kawakatsu, T., Aihara, K., Takasu, A. and Adachi, J., Deep sensing approach to single-sensor vehicle weighing system
on bridges, IEEE Sensors Journal, Vol.19, No.1 (2019), pp. 243–256.
Khan, F. U. and Ahmad, I, Vibration-based electromagnetic type energy harvester for bridge monitoring sensor
application, Proceeding of International Conference on Emerging Technologies (ICET) (2014), pp. 125–129).
Khan, F. U. and Iqbal, M., Electromagnetic-based bridge energy harvester using traffic-induced bridge's vibrations and
ambient wind,” Proceeding of 2016 International Conference on Intelligent Systems Engineering (ICISE) (2016),
pp. 380–385.
Khemapech, I., Sansrimahachai, W., and Toahchoodee, M., A real-time health monitoring and warning system for bridge
structures, Proceeding of IEEE Region 10 Conference (TENCON) (2016) pp. 3010–3013.
Koganezawa, S., Ishii, T., Tani, H., Lu, R. and Tagawa, N., Development of vibration sensor using giant magnetostrictive
material for self-powered structural health monitoring system, IEEE Sensors (2020)
DOI:10.1109/SENSORS47125.2020.9278840.
Li, H. and Pillay, P., A linear generator powered from bridge vibrations for wireless sensors, Proceeding of 2007 IEEE
Industry Applications Annual Meeting (2007) DOI:10.1109/07IAS.2007.85.
Liu, W., Wang, Z., Qu, S. and Luo, R., Vibration energy harvesting and management for wireless sensor networks in
bridge structural monitoring, Proceeding of 2015 IEEE Sensors (2015) DOI:10.1109/ICSENS.2015.7370561
Lydon, M., Taylor, S. E., Robinson, D., Callender, P., Doherty, C., Grattan, S. K. and O'Brien, E. J., Development of a
bridge weigh-in-motion sensor: performance comparison using fiber optic and electric resistance strain sensor
systems, IEEE Sensors Journal, Vol.14, No.12 (2014), pp. 4284-4296.
Ministry of Land, Infrastructure, Transport and Tourism, Summary of the white paper on land, infrastructure, transport
and tourism in Japan, 2020, available from
, (accessed on 30 November,
2021).
Noel, A. B., Abdaoui, A., Elfouly, T., Ahmed, M. H., Badawy, A. and Shehata, Structural health monitoring using wireless
sensor networks: A comprehensive Survey, IEEE Communications Surveys & Tutorials, Vol.19, No.3, (2017), pp.
1403–1423.
Orfei, F., Mezzetti, C. B. and Cottone, F., Vibrations powered LoRa sensor: An electromechanical energy harvester
working on a real bridge, Proceeding of 2016 IEEE SENSORS (2016) DOI:10.1109/ICSENS.2016.7808752.
Patil, P. K. and Patil, S. R., Structural health monitoring system using WSN for bridges, Proceeding of International
conference on intelligent computing and control systems (ICICCS) (2017) pp. 371–375.
Pedchenko, A. V., Meyer, J. J. and Barth, E. J., Assessing stability and predicting power generation of electromagnetic
vibration energy harvesters using bridge vibration data, IEEE/ASME Transactions on Mechatronics, Vol.22, No.1
(2017), pp. 269–279.
Premachandra, C., Waruna, H., Premachandra, H. and Parape, C. D., Image based automatic road surface crack detection
for achieving smooth driving on deformed roads, Proceeding of 2013 IEEE International Conference on Systems,
Man, and Cybernetics, DOI:10.1109/SMC.2013.686.
Sazonov, E., Li, H., Curry, D. and Pillay, P., Self-powered sensors for monitoring of highway bridges, IEEE Sensors
Journal, Vol.9, No.11 (2009), pp. 1422–1429.
Scott, R. H., Banerji, P., Chikermane, S., Srinivasan, S., Basheer, P. M., Surre, F. and Grattan, K. T., Commissioning and
evaluation of a fiber-optic sensor system for bridge monitoring, IEEE Sensors Journal, Vol.13, No.7 (2013), pp.
2555–2562.
Sony, S., Laventure, S. and Sadhu, A., A literature review of next-generation smart sensing technology in structural health
monitoring, Structural Control Health Monitoring, Vol.26, No.3 (2019), pp. e2321.
Usui T., Omori T., Takamine H. and Watabe K., Monitoring system for civil infrastructure with acoustic emission sensing,
JSME Proceedings of IIP 2016, I-1-6 (in Japanese), (2016) DOI:10.1299/jsmeiip.2016.I-1-6.
[DOI: 10.1299/jamdsm.2022jamdsm0010] © 2022 The Japan Society of Mechanical Engineers
12
2You can also read