Make New Zealand Better - Sustainability Report 2021 - Chorus
←
→
Page content transcription
If your browser does not render page correctly, please read the page content below

Make
New Zealand
Better

Sustainability
Report 2021
This is Chorus’ first sustainability report,
reflecting our ambition and commitment to
support New Zealand in its transition to be
more sustainable.

Make New Zealand Better                                               Table
                                                                      Section
                                                                            of Heading
                                                                               contents                                      Chorus Sustainability Report 2021   2

                          Please consider the environment before printing this document. This report has not been independently verified.
Make New Zealand Better                                                                                    Section Heading
                                                                                                           Welcome  from JB Rousselot   Chorus Sustainability Report 2021   3

A decade of action

The New Zealand Government’s commitment to global climate
change action and its target to be a carbon zero nation by 2050
will require change on a big scale. We believe our fibre broadband
network has an important part to play.

For the last decade we’ve been building our           COVID-19 also highlighted the digital divide,
fibre network, investing in critical infrastructure   and the challenges of those who don’t have
and unleashing the digital potential for              the access or skills to thrive in a digital world.
New Zealand communities and businesses.               To combat digital inequality our goal is to
                                                      strengthen the digital capability of individuals,
International research shows that the                 communities and businesses.
wider adoption and development of digital
services in areas such as transportation,             At the heart of our sustainability approach
energy, computing, construction, building             is our purpose, to make New Zealand better,
management, health, and education could               and we'll do this by championing digital futures,
reduce carbon emissions globally by almost            supporting the wider environment and helping
a fifth. However, with more technology                people thrive. The next decade for Chorus will
adoption comes increased data needs and a             be one of action, working together with the
greater responsibility to create a sustainable        industry, government and other organisations to
digital future.                                       tackle climate change, commit to a sustainable
                                                      future and ensure in a digital era no one gets
We’ve already seen New Zealanders' appetite           left behind.
for data grow rapidly in the last decade.
The COVID-19 pandemic has also accelerated
digital adoption, as more people discovered
how they could work, learn and connect online
from their home. We believe our fibre network
is not only reliable and future proofed in terms
of speed and data capacity, but also a low            JB Rousselot
emission technology.                                  Chief Executive
Make New Zealand Better                            Chorus Sustainability Report 2021   4

Make New Zealand Better

Making New Zealand better means Chorus will
innovate and invest to deliver the best possible
services for New Zealanders empowering
the environmental, economic and societal
transformations ahead of us.
Make New Zealand Better                                    Validating Our Approach   Chorus Sustainability Report 2021   5

Validating our
sustainability approach
with stakeholders
The end of 2020 saw us run internal
workshops and materiality assessments
with external stakeholders to validate
our sustainability approach.
Material topics were developed during the first stage of
our workshops, as participants were asked to consider
how Chorus creates value and how Chorus could
contribute to a flourishing and sustainable future,
one that benefited customers, investors, community,
employees and the earth.

These ideas were crafted into concise material topics,
that were mapped to the New Zealand Treasury’s
Living Standards Framework, the Future-Fit Business
Benchmark, and the Sustainable Development Goals
as validation. The topics were further confirmed and
refined with the internal sustainability group to reach
a final draft state.

We asked stakeholders to rank this list of material
topics in terms of Chorus’ ability to create value
(see next page for rankings).

Make New Zealand Better                                                                               Section Heading
                                                                                                      Materiality Assessment                            Chorus Sustainability Report 2021   6

Materiality
assessment

                                                                                                                                                                S M A RT
                            D I G ITA L                     D I G ITA L                   N E T WO RK                     E N V IRO N M E NTA L
                                                                                                                                                            COMMU N ITIE S
                          IN CLU S I O N                   LITE R AC Y                   RE LI A B ILIT Y                        IM PAC T
                                                                                                                                                             & E CO N OMY

                   Working with others on              Chorus can contribute value by having a resilient and              Chorus should know its own environmental impact and
                    digital inclusion is the            reliable network that enables the digital economy.               take steps to reduce any harm. Chorus also has a role to
                    dominant way Chorus               However digital literacy is equally important for society                 champion a work from home culture and
                   can contribute positively         and Chorus should have a role in not only providing the                              distributed workforce.
                  to a sustainable and value             network but helping people know how to use it.
                          creating society.

                                               E TH I C A L                 D I V E RS E &
                                                                                                             H E A LTH &
                                              B U S IN E S S               IN CLU S I V E                                                 WE LLB E IN G
                                                                                                              S A FE T Y
                                              PR AC TI CE                  WO RKPL ACE

                                              Ethical business practices; diverse and inclusive workplace; health, safety and wellbeing were lower on the
                                                  priority list due to stakeholders generally feeling these are fundamental topics that must be done.
                                                                     It’s important that Chorus continues to focus on these areas.
Make New Zealand Better                                                                                           Section
                                                                                                                  Our Sustainability
                                                                                                                          Heading Strategy                            Chorus Sustainability Report 2021        7

Our refreshed
Sustainability Strategy

                                                                 THE CHALLENGES AND                                                      A S P I R AT I O N A L                   U N S U S TA I N A B L E
                                                             O U R CO M M I TM E N T T O H E L P                                               G OA L S                        D E V E L O PM E N T G OA L S

                                            Natural resources are being used up faster than they can
                                                                                                                                     Accelerate our journey
                                       regenerate, and vital environmental systems are being degraded
              THRIVING                                                                                                               towards carbon neutral
                                       faster than they can recover. This threatens our standard of living
           E N V I RO N M E N T                                                                                                         across the Chorus
                                                       and the wellbeing of future generations.
         T E TA I AO P UAWA I                                                                                                                ecosystem.
                                      W E W I L L WO R K TO R E D U C E C A R B O N E M I S S I O N S A N D WA S T E
                                               TO L A N D FI L L AC R O S S T H E C H O R U S ECO S YS T E M .

                                                A digital world offers opportunity for New Zealand.
                                          However inequality may increase if the infrastructure is built                           Help more Kiwis participate
             CHAMPION
                                           without strengthening the digital capability of individuals,                           in a positive digital life; using
         D I G I TA L F U T U R E S
                                                              communities and businesses.                                          the greenest, fastest, most
          T OA H A N G A R AU
                                           W E W I L L PA R T N E R W I T H OT H E R S TO H E L P C LO S E T H E                       reliable broadband.
                                         D I G I TA L D I V I D E A N D S T R E N G T H E N D I G I TA L C A PA B I L I T Y.

                                           We are the digital connection backbone for New Zealand,
                                                                                                                                        Known leaders in:
              THRIVING                            operating in an industry with constant changes.
                                                                                                                                        • Health & Safety
                PEOPLE                 We also partner with strategic suppliers who deliver our services
                                                                                                                                      • Diversity & Inclusion
               N G A IW I                                               on the ground.
                                                                                                                                        • Worker Welfare
              W H A I H UA            W E W I L L C H A M P I O N S A F E , FA I R A N D I N C LU S I V E WO R K P L AC E S
                                                                                                                                      • Wellbeing & Flexible
                                            AC RO S S N E W Z E A L A N D S O M O R E P EO P L E C A N L E A D
                                                                                                                                              working.
                                                        F U L FI L L I N G A N D B A L A N C E D L I V E S .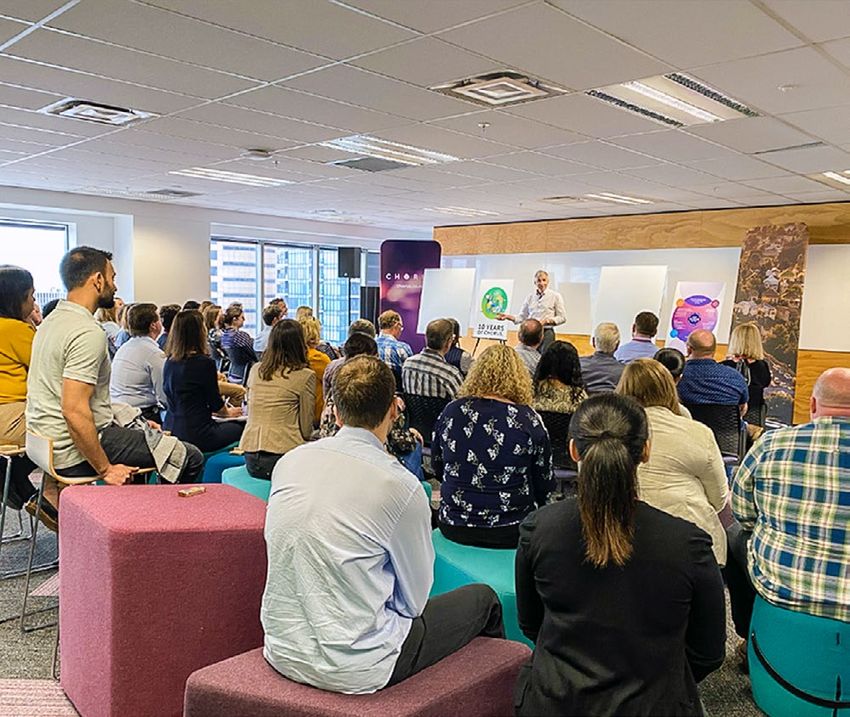
Make New Zealand Better                                             UN Sustainable Development Goals   Chorus Sustainability Report 2021   8

Our contribution
to the United Nations
Sustainable Development
Goals (SDGs)
The 2030 Agenda for Sustainable Development, adopted by all
United Nations Member States in 2015, provides a shared blueprint
for peace and prosperity for people and the planet, now and into
the future.

Chorus contributes to most of the SDGs in four key ways:

           By the investment made in our
   1       fibre infrastructure.

   2       By responsibly operating our business.

           Through our focus on people
   3       and environment.

           Through our social responsibility
   4       activities and community involvement.
Make New Zealand Better                                                                         Sustainability Governance                    Chorus Sustainability Report 2021   9

Sustainability
governance
Our sustainability strategy has been                          They are supported at an organisational level by our          Sponsorships/partnerships:
                                                              Sustainability Council, with representation drawn
adopted by our executive leadership team                                                                                    • Dignity (Women’s Health)
                                                              from across a range of business areas. The Council
with endorsement from the Chorus Board.                                                                                     • Take a Breath (Mental Health)
                                                              collectively promotes our sustainability strategy, leads
                                                              and contributes to programmes of work that support            • Innovative Young Minds
Our newest director, Kate Jorgensen, has previously           our targets and helps identify new opportunities, such as     • Rainbow Excellence Awards
been a member of the Sustainable Business Council             initiatives to reduce our emissions and waste.                • Big Gay Out Auckland
Advisory Board.
                                                                                                                            • Auckland and Wellington Pride Parades
The three sustainability pillars have been integrated into    Working together
                                                                                                                            • NZ TechWeek
our company strategy (see purpose below and Chorus            We continue to work with a wide range of groups and
                                                                                                                            • Tech21 to help inspire young people to consider
strategy on page 10).                                         organisations. In FY21, this has included:
                                                                                                                              a tech career.
                                                              Industry and government organisation memberships:             • BusinessDesk and The AM Show partnerships
                                                              TUANZ, the Telecommunications Forum (TCF), Local              • NZ Community Boards Conference
                                                              Government New Zealand, Hugo Group and BusinessNZ.            • Local Government NZ Conference

                                                              Other memberships:                                            Type                          Amount
                                                              Sustainable Business Council, Corporate Taxpayers             Memberships                   $396,000
                                                              Group, NZ Shareholders Association, Chartered
                                                              Accountants Australia, Electrical Engineers Association,      Sponsorships / partnerships   $478,000
                                                              Global Listed Infrastructure Organisation, Property
                                                              Council of New Zealand and Mentemia.                          Chorus does not make political donations.

Responsibility for implementation of the sustainability
strategy sits across our Executive with coordination of the
strategy and programmes of work managed by our Head
of Sustainability, reporting to our Chief Corporate Officer
and General Counsel.
Make New Zealand Better                               Sustainability Governance   Chorus Sustainability Report 2021   10

Our Chorus strategy

To recognise our commitment to sustainability, the
Executive team has put our three new sustainability
pillars at the core of our corporate strategy;
Make New Zealand Better                                                                           Sustainability Governance                                Chorus Sustainability Report 2021   11

Our network infrastructure

               ~600 exchanges                                                                        ~12,000 cabinets                            ~300,000 poles

                ~57,000km fibre (excluding service leads)                              ~65,000km duct network
                ~130,000km of copper

                                                                                                                73% of our broadband connections are fibre, enabling rapid
                              We’re a wholesale only, fixed line
                                                                                                                growth in broadband speeds and data demand.
                              telecommunications network operator.
                                                                                                                8Gbps Hyperfibre speeds just launched.

                                                                                                                Gigabit broadband and our fibre backhaul is underpinning the
                              Our network infrastructure enables ~100 retail service
                                                                                                                development of sustainable communities through connections
                              providers to connect homes and businesses nationwide.
                                                                                                                to devices and other network connectivity.

                              We have about 820 permanent and fixed term employees
                                                                                                                A 2017 study1 estimated the wider social benefits from fibre
                              and 140 independent contractors for our core operations.
                                                                                                                uptake at about NZ$2 billion annually, in addition to a
                              Several thousand service company workers and
                                                                                                                $3 billion annual contribution to GDP from business uptake.
                              subcontractors undertake activity on our behalf.
                                                                                                                1. Sapere Research Group: Estimating the wider socio-economic impacts of
                                                                                                                   Ultra Fast Broadband for New Zealand, August 2017.
Make New Zealand Better Sustainability Governance 12
Infrastructure is at the heart of the
delivery of economic, environmental and
social sustainability. It’s also at the heart
of what we do.
Network investment milestones
We’re New Zealand’s largest telecommunications
infrastructure operator. Our operations include 2012 Completed ADSL2+ fibre to the cabinet
building, maintaining, and operating an open access upgrade, reaching 80% of population
telecommunications and internet network predominantly
made up of local telephone exchanges, cabinets, and 2016 Finished the Rural Broadband Initiative, a
copper and fibre cables. partnership with the Government to connect
fibre to rural schools, hospitals and Vodafone
We’ve invested billions of dollars in substantial upgrades towers. It also enabled expansion of our fibre
of New Zealand’s communications infrastructure since to the cabinet and VDSL footprint.
we became a standalone company in 2011.
2018 VDSL vectoring upgrade completed for tens of
Our rollout of fibre optic cable to homes, businesses, thousands of homes across selected rural and
schools and hospitals began a decade ago as part of a urban areas. Received the Broadband
public-private partnership with government. Fibre will Delivering Social Impact award at the
cover about 1.36 million physical addresses by the end of Broadband World Forum.
2022. The ultra-fast, high capacity and reliable broadband
2019 Completed UFB1 rollout underway since 2011
enabled by fibre means New Zealand is one of just a few
as part of our public-private partnership with
countries already well on the way to becoming a gigabit
the Government. This made fibre available to
society. With the fibre network already covering larger
about one million homes and businesses across
towns and cities, the last phase of the rollout is extending
28 major towns and cities.
fibre to hundreds of smaller communities, some with as
few as 50 premises. 2020 Removed first generation copper broadband
equipment in rural areas with VDSL extended to
We’re continually upgrading parts of our network as 160 nodes via 70km of fibre. Fibre extended to
technology evolves and changes in local demand enable provincial marae as part of the Government's
new investment. We’re awaiting confirmation of the development project.
incentive settings under our new regulatory regime
to determine how we might continue to help bridge 2022 UFB2 rollout due to be completed, extending
the digital divide for smaller communities yet to be fibre to 360,000 homes and businesses
connected to fibre. in smaller communities.Make New Zealand Better Sustainability Governance Chorus Sustainability Report 2021 13
Risk management
Board oversight and monitoring of Chorus
responses to principal risk, involving climate The Board has a regular programme of
change is through the Audit and Risk education sessions covering a range of topical
Management Committee (ARMC). matters, both technical and cultural.
The ARMC reviews regular reporting from the executive This includes health and safety site visits, as well as
team on principal risks. Our risk management framework briefings from key management, industry experts and
covers financial and non-financial risks including: advisers. Educational and stakeholder visits are also
arranged. Past education session topics have included
technology developments, the future of work and social
Customer/market risks license.
Customer service and experience;
Our key corporate governance documents, including our
revenue growth and market changes.
Managing Risk policy, are available at www.chorus.co.nz/
governance. More information about our approach to
risk is also available in the Governance section of our
Capital management
Annual Report.
Working within appropriate capital
management settings.
People and culture
Health and safety; engagement; capability;
talent and change management.
Regulatory risks and broader
societal expectations
Working within the regulatory and legal
environment, and societal expectations.
Operational risks
Network and IT quality, availability and resilience;
delivering effective and quality outcomes
(including with service partners); labour market
risks; climate change risks.Make New Zealand Better Sustainability Governance Chorus Sustainability Report 2021 14
Network reliability
Average duration of network interruptions FY19 FY20 FY21
New Zealanders place great reliance upon the availability
of our network both as a utility service for their daily lives Fibre and copper network combined 18 hours 23 hours 23 hours
and businesses, as well as a critical lifeline service in times average time to restore
of emergency.
Layer 1 fibre average downtime per annum 50 minutes 40 minutes 38 minutes
A large part of our everyday work is focussed on keeping (target of < 120 minutes)
communities connected by providing a stable and
reliable network. We’re recognised by the Government Layer 2 fibre average downtime per annum 1 minute 1 minute 3 minutes
as a lifeline utility provider and our employees and (target of < 30 minutes)
service company technicians often go the extra mile to
keep communities connected when extreme weather or
Flooding risk has been evaluated across our critical Flood protection work has been undertaken at our
natural disasters occur. South Dunedin exchange.
exchange sites. In 2019 we commissioned an assessment
The substantial investment we’ve made in deploying fibre of sea-level rise risk across our exchanges and core
to the premises has increased our network’s reliability fibre routes, which suggests limited potential impacts
and its resilience to emerging climate-related risks. Fibre on our network assets, from sea-level rise over a long
is less susceptible to water and lightning-related faults time frame.
than the cables and street-based electronic equipment in
Earthquakes remain a primary focus for our network
the copper network. This has been demonstrated by low
resiliency planning. Network damage from past
fibre fault volumes in extreme weather events, including
earthquakes has tended to be limited to localised copper
tornadoes and flooding.
cables, with minimal damage to exchange buildings.
Network interruptions were within our nationwide
We have a comprehensive insurance programme typical
targeted service levels in FY21. New quality standards will
of large scale infrastructure utilities, covering all risks of
be set by the Commerce Commission as part of the new
physical damage and business interruption for above
regulatory framework from 2022.
ground assets. Specific cover is provided for earthquake
Our network teams monitor network fault performance damage to underground cables in Auckland, Hamilton,
through significant weather events to identify potential Wellington and Dunedin. We undertake probability
network architecture or route improvements. They also based loss estimate modelling to ensure that the policy
evaluate climate change data produced by local councils limit covering material damage and business interruption
as part of their ongoing network planning activity. is adequate.
Extensive flooding on the Canterbury plains in June 2021 resulted
in damage to a regional fibre optic route after a bridge washout.
A current project to extend the core fibre network along the
West Coast of the South Island, made possible by government funding,
will help establish network route diversity for part of the lower South Island.Make New Zealand Better Sustainability Governance Chorus Sustainability Report 2021 15
Stakeholder engagement
The rollout of our fibre network has entailed an extensive
programme of stakeholder engagement at all levels of
government for the last decade.
We engage closely with Crown Infrastructure Partners as Before the start of fibre deployment in communities, residents are
the contract manager for our public-private partnership. invited to discuss the fibre rollout and the benefits of fibre broadband at
Before the start of fibre deployment in communities we community events. These events help address any community concerns
and promote fibre uptake.
brief and work with local councils on our rollout plans.
In addition to our customer experience surveys, we
monitor public perception of Chorus through broader
national surveys. We also conduct a survey every three
years, of a diverse group of stakeholders to gauge
perceptions of our reputation. The latest survey in June
2021 saw Chorus receive a 7.8 out of 10 for reputation.
Our investor relations programme facilitates two-
way communication with investors and other market
participants about our business, governance and
performance. This is a valuable source of feedback.
Our annual and half year results presentations are
made available to all investors via webcast.Make New Zealand Better Thriving Environment Chorus Sustainability Report 2021 16 Te taiao puāwai Thriving environment We're working to reduce emissions and waste to landfill.
Make New Zealand Better                                                                       Thriving Environment                               Chorus Sustainability Report 2021   17

Our commitment                                                              Our targets

          Implement and maintain an emissions data
   1      and reporting system.                                               1        80% reduction of scope 1 & 2 emissions by 2030.

          Identify and innovate to create a sustainable value chain;                   Accelerate our journey to carbon neutral: Over the next year
   2      reduce waste, energy, and emissions.                                2        we're focusing on reviewing our scope 3 emissions to enable
                                                                                       us to put forward a new science-based target.
          Seek third party verifications on our science-based
   3      emissions reduction target.

          Engage with iwi, hapū and rūnanga organisations,
   4      particularly where build work is scheduled to take place in       Impact in the last 12 months
          culturally sensitive landscapes to ensure cultural impacts are
          appropriately mitigated where possible.

          Ensure all physical and operational works comply with the
   5      National Environmental Standards for Telecommunications
          Facilities, the Health & Safety At Work Act NZ, the Resource
          Management Act and other relevant local and central               Climate Disclosure        Air travel reduced      Electricity consumption
          government legislation.                                           Project (CDP) rating       80% across last         down 5%, despite data
                                                                             B achieved (out of           two years.          usage increasing by 23%.
          Take practical steps to avoid environmental breaches and              A-E range).
   6      report on any breaches.

          Identify the risks associated with climate change, evaluate,
   7      and monitor the risks and if necessary, take action to control,
          reduce or eliminate them.
                                                                               26% decrease             296 tonnes of          New emission tracking
                                                                                in waste to          network equipment          and reporting system
                                                                             landfill across our     diverted from landfill      being implemented
                                                                              corporate sites.       - reused or recycled.            in FY22.
Make New Zealand Better Thriving Environment Chorus Sustainability Report 2021 18
Enabling a sustainable
digital future
Low emission technology Figure 1: Supporting emission reductions for
Fibre networks are recognised as the most climate- Network equipment power usage by network type New Zealand
friendly digital infrastructure because they transmit
data via light over large distances. This means fibre Our network also enables New Zealanders to undertake
3.50
optical equipment doesn’t require cooling or powered activity in ways that reduces their own impact on the
equipment in suburban streets. We expect to reduce our environment. COVID-19 has accelerated the widespread
3.00
electricity consumption by between 30 and 40 percent in adoption of flexible work options and video conferencing.
Watts per subscriber
future years as the copper network is gradually shut down 2.50 The 2021 Lifestyle survey reported that 41% of New
in areas where fibre is available. Zealanders are now working from home in some capacity
2.00 during the week.
Research commissioned by the German Environment
Agency suggests HD video streaming over fibre produces 1.50 The Energy Efficiency and Conservation Authority
half of the carbon emitted per hour than VDSL on copper estimated if one in five New Zealanders opted to work
cable would, while carbon emissions for 5G technology 1.00 from home once a week, it would prevent 84 kilotonnes
were even higher than VDSL.1 (the equivalent of taking 35,000 cars off the road) of
0.50 carbon dioxide entering the atmosphere annually.
Swapping business flights between Auckland and
0 Wellington for an online meeting could reduce transport
1. https://www.umweltbundesamt.de/en/press/pressinformation/video-
2007
2008
2009
2010
2011
2012
2013
2014
2015
2016
2017
2018
2019
2020
emissions by another 65 kilotonnes.
streaming-data-transmission-technology
The benefits of fibre broadband are already evident ADSL VDSL GPON Souce: Nokia
from the reductions we’ve seen in network electricity
Fibre networks are estimated to use 12 times less energy than copper networks.
usage despite significant growth in data usage across
our network.
Figure 2:
Data vs Network Electricity Usage FY18 – FY21
90,000 6,000
5,000
85,000
Petabyte
4,000
MWh
80,000 3,000
2,000
75,000
1,000
70,000
FY18 FY19 FY20 FY21
Copper data usage (PB) Fibre data usage (PB)
Electricity usage (MWh)Make New Zealand Better Thriving Environment Chorus Sustainability Report 2021 19
Reducing our
emissions
We’ve been reporting our carbon Carbon offsetting and renewable energy
emissions data to the Climate Disclosure With video conferencing and less travel due to COVID-19 We use solar and wind power on 117 remote network
we’ve driven our travel emissions down by 76% from sites where mains power isn’t available. For network sites
Project (CDP) since 2012 and achieved a base year levels. supporting large numbers of customers, we use mains
B rating for 2020 (scores range from A-E) power to ensure reliability of service and we rely on
We are expecting that our reported Scope 3 emissions standby batteries and diesel generators for backup power.
confirmed in March 2021. will increase as a result of our Scope 3 review that is being
undertaken in the coming year. Chorus has not yet adopted a carbon offsetting
We have a target of reducing our Scope 1 and 2 emissions
programme. Our focus is on identifying our wider Scope
80% by 2030, from our FY12 base year. This target reflects
We continue to invest in ways to make our network more 3 emissions, finding opportunities to reduce all emissions,
the expected greening of New Zealand’s electricity
energy efficient, including updating our equipment in and investing in the ongoing rollout of fibre. The migration
network and the benefits of our investment in fibre optic
exchanges. As we migrate more customers from copper to of customers to fibre means we’re able to remove less
broadband.
fibre, we expect our electricity consumption to continue power efficient equipment from the network, reducing our
Our footprint: In total, we’ve avoided a net cumulative 84 to reduce. The lower fault rate on the new fibre network overall emissions.
kilotonnes of carbon dioxide equivalent emissions (CO2e) means vehicle related Scope 3 emissions will also continue
to reduce over time. New Zealand has typically met around 80% of its annual
since FY12, including Scope 3 emissions. electricity needs from renewable sources, subject to
Figure 3: hydrological conditions. This is expected to increase in
Our FY21 emissions were 23 kilotonnes-CO2e, 33% lower
future years with ongoing investment in de carbonisation
than in FY12, however an 18% annual increase from FY20.
Scope 1 and 2 Emissions of the electricity grid. The Climate Change Commission
Scope 1 direct emissions have remained steady for FY21 at has recently recommended a target of 95% to 98%
1 kilotonne due to lower generator diesel and renewable electricity generation by 2030.
company vehicle fuel consumption, along with fewer
Figure 4:
refrigerant losses. 15
Scope 2 electricity emissions for FY21 were 12 kilotonnes, Carbon emissions (tonnes CO2e) and electricity usage
a 2.9 kilotonnes increase compared to last year. However
Kilotonnes CO2e
our electricity consumption has reduced by 5% compared FY19 FY20 FY21
to last year, despite monthly average data usage on the 10
Chorus network rising by 23% (352GB monthly average in Direct emissions Scope 1 1,166 1,035 992
June 2020 compared to 432GB monthly average in June Electricity emissions Scope 2 9,093 9,343 12,247
2021). This increase in electricity emissions is due to the
carbon intensity of the national grid increasing rapidly Value chain emissions Scope 3* 11,691 9,221 9,807
year on year due to a period of low rainfall in hydroelectric 5
generator catchments. Electrical usage
83,474 81,877 77,250
(total MWh)
Reported Scope 3 value chain emissions for FY21 were
% renewable** 83.20% 82.20% 79.90%
10 kilotonnes and have reduced by 38% since FY12.
0
This has been driven mainly by reductions in our field * Scope 3 emissions measured are business travel (air, taxi, rental car and fuel
FY12 FY13 FY14 FY15 FY16 FY17 FY18 FY19 FY20 FY21 reimbursement); service company fleet (excluding technicians); diesel production;
service vehicle fleet, excluding subcontractors.
electricity used by others in co-locations
Electricity Company vehicles
** based on an average of three quarters where emissions factors have been reported.
Diesel generators Natural gas
We’ve restated emissions for prior years where revised emission factors and activity
Refrigerant levels have been available. Therefore emissions will vary from those previously reported.Make New Zealand Better Thriving Environment Chorus Sustainability Report 2021 20
Respecting our land
Our environmental commitments
For FY22 and beyond we’re implementing a system We engage with numerous local Māori organisations
for carbon emissions data and reporting. We'll continue and Heritage New Zealand to ensure cultural impacts are
to create a sustainable value chain; reduce waste and mitigated, particularly where we are building network in
emissions. We will also seek third party verification on culturally sensitive areas.
our science-based emissions reduction target.
Our environmental framework requires that we and
As the owner of about 600 exchange sites and our suppliers ensure our physical and operational work
an extensive fixed line network throughout urban complies with all relevant local and central government
and rural New Zealand, we take practical steps to legislation including:
avoid environmental breaches and report on any • the National Environmental Standards for
potential breaches. Telecommunications Facilities
We recorded an incident where diesel spilled at one • the Health & Safety at Work Act NZ
of our exchanges when a tank filling system failed. • the Resource Management Act
We immediately responded to the incident, alerted the
local authority and we've fully remediated the site. We have controls in place to identify risks associated with
climate change mitigation and adaptation, evaluate, and
We have about 70 network sites located on Department monitor the risks and if necessary, take action to reduce
of Conservation land. These sites are typically transmitter or eliminate them.
links on hilltops or mountains. Some of these remote sites
are being retired as our network needs evolve and will be
removed or passed onto new owners. The scale of the
ultra-fast broadband rollout has entailed working closely
with a multitude of councils throughout New Zealand
to coordinate the deployment of new underground and
aerial network.
WE ENG AG E WITH
LO C AL M ĀORI
ORG ANISATIONS TO
E NSURE CULTUR AL
IMPAC T S ARE
MITIG ATE DMake New Zealand Better Thriving Environment Chorus Sustainability Report 2021 21
Throughout the course of our UFB
rollout, we've engaged with iwi, hapū
and rūnanga organisations.
To date we've obtained around 100 authorisations to
work in areas identified as having archaeological features
and sites of significance.
We've also worked with archaeologists and local mana
whenua representatives to record archaeological
features as they are unearthed during excavations to
install our network. A WHAK ANŌA
Archaeological features discovered so far have included CEREMONY IS OF TE N
the remnants of pre-European Māori settlement, such as
toki (adzes), whao (chisels), hangi stones and moa bones, C ARRIED OUT BE FORE
as well as the remnants of a whaling station.
CHORUS CONTR AC TORS
S TART E ARTHWORKS .
A patu muka (flax pounder) unearthed by our UFB contractors
in Tairua. The patu muka was used to soften flax fibre (muka) in
preparation for weaving.
Archaeologists and local mana whenua representatives meet with our
service partners and contractors to provide archaeological and cultural
inductions. This is in part to make sure we meet our obligations under the
Heritage New Zealand Pouhere Taonga Act.Make New Zealand Better Thriving Environment Chorus Sustainability Report 2021 22
Reducing our waste Waste type Disposal method* FY21 (Tonnes) FY20 (Tonnes)
to landfill Duct (plastic) Recycled 85 195
We have a strong focus on waste minimisation Redundant network (metal) Recycled 187 37
and continually explore opportunities to reuse Batteries Recycled 10 24
or recycle waste generated by our network- E-waste Recycled 14 4
related activity, including partnering with
Fibre cable Landfill 82 93
our suppliers to reduce our waste footprint
through innovation. * Where we are able to recycle, 100% of waste type is recycled.
Since the ultra fast broadband rollout began in 2011, we've Our largest source of waste to landfill is fibre cable, cable
worked with our partners to collect plastic duct offcuts so offcuts can’t be reused if they are below a certain length.
they can be recycled, and the plastic granulate can be used The amount of fibre cable waste is reducing significantly
in the production of new ducting. Over the last five years as the UFB rollout comes towards an end. Our fibre cable
we've diverted over 800 tonnes of potential waste from supplier is currently researching a technique to recycle
landfill, including 85 tonnes this year. fibre cable.
We’ve worked with our local duct manufacturer on the types Our goal is to recycle all redundant electronic equipment
of plastic used in ducting to change from two different types and copper cable where they can be economically
of plastic to one type of plastic, which will make processing recovered. Network recycling volumes are expected to
of the duct offcuts more efficient as it's rolled out across increase as we continue to migrate customers to the fibre
different duct products. network and copper equipment is gradually retired. Over
the last year we have recycled 14 tonnes of e-waste and
Leveraging the relationships we have with our material 10 tonnes of network batteries.
suppliers, we’ve collaborated on ways to reduce the use
of soft plastics, starting with the removal of five metres of We expect to set ongoing waste targets once the fibre
soft plastic that was being used on microduct drums (see rollout programme is complete and normal operational
pictures to the right). levels are established. General waste disposal by our
service companies and their subcontractors isn’t
We’ve also worked together to replace polystyrene reels, currently tracked.
used for smaller fibre cables being installed into premises,
with cardboard alternatives. Plastic packaging for customer We operate an in-office recycling and organic waste
premises equipment has also been reduced. collection programme across our four corporate office
sites. In FY21 we started recording waste volumes and
Where possible, we reuse the wooden and metal drums the reinvigorated our recycling programme which has
fibre optic cable is delivered on and are working seen a 26% decrease in waste to landfill and a 488%
with our supplier to trial reusable plastic drums for increase in recycling across our four corporate sites.
microduct cabling.
Water
We have limited data for water usage as water is part of
the fixed body corporate costs that we pay for our office
space and few exchanges that use water for cooling.Make New Zealand Better Champion Digital Futures Chorus Sustainability Report 2021 23 Toa hangarau Champion Digital Futures We're committed to working with others to strengthen the digital capability in New Zealand and combat digital inequality.
Make New Zealand Better                                                                          Section Heading
                                                                                                 Champion  Digital Futures                         Chorus Sustainability Report 2021   24

Our commitment                                                              Impact in the last 12 months

          Continue to collaborate with others who are
   1      working towards digital equity in New Zealand.

          Help build awareness of digital skills support
   2      available for our local communities.                              Challenge Accepted         Part of the Digital     100 cabinet art           Collaboration with
                                                                            series on YouTube to         Boost Alliance       murals complete,            Digital Journeys,

          Support organisations who are focussed on digital                 inspire and motivate       and Digital Equity      eight Rainbow                SeniorNet and
    3     inclusion and skills.                                               people to have a        Coalition Aotearoa.          themed.                   Broadband
                                                                               digital future.                                                                Compare.

          Continue to connect New Zealand towns and
   4      communities to fibre.

Our targets                                                                   233 community                $250,000              47 Shine the              12,000 student
                                                                            volunteer days taken           to support         Light community             homes connected
                                                                               by employees.             organisations       events nationwide             through retailers
           50 Shine the Light events to strengthen digital                                            focussed on digital       to educate on                 delivering
    1      knowledge for FY22.                                                                           capability and      broadband options,          broadband services,
                                                                                                           inclusion.          how to connect           using free wholesale
                                                                                                                              to fibre and local          connections from
           20,000+ students, adults and business owners helped
   2       with digital access skills training, and devices in FY21-FY22.
                                                                                                                             digital skills support       Chorus, other NZ
                                                                                                                                  available.             wholesale providers
                                                                                                                                                         and the Ministry of
                                                                                                                                                              Education.
Make New Zealand Better Champion Digital Futures Chorus Sustainability Report 2021 25
Digital equity
and inclusion
Education Digital skills and inclusion donations
Education and a commitment to digital equity have In FY21 we donated $250,000 to charities and
always been a major focus of our work. Schools were organisations focussed on digital inclusion. Our
priority customers to be connected to fibre in our urban donations included Alexa Echo Dot speakers for Blind
and rural rollouts. In recent years we’ve worked with Low Vision New Zealand clients and devices to support
government organisations to explore ways our network Digital Skills courses for seniors and families through
technology could bridge the digital divide between those Age Concern NZ and Digital Inclusion Alliance Aotearoa.
students who have broadband at home and those who We've also supported Kiwrious, who provide science
The aim of our Challenge Accepted series
don’t. This has included trials using Wi-Fi access points sensors and an online collaboration platform for low
is to tackle broadband and technology fears.
to enable students without home broadband to log in to decile schools to encourage Science, Technology,
their local school network from home. Engineering and Maths (STEM) learning and we've
also funded research to look at whether Clearhead,
Ministry of Education COVID-19 support for students a mental health app and chatbot, could help within the
Māori community.
When COVID-19 forced the shutdown of schools across
New Zealand, our broadband network underpinned a
In June 2021, along with the Discovery team, we created
rapid transformation in education practices, as schooling
an online content series called Challenge Accepted,
shifted online. However, we were concerned about the
to actively demonstrate how anyone can overcome
effect an extended lockdown could have on the digital
challenges relating to technology, and do more online.
divide within school communities. We offered to switch
our existing intact connections on for homes identified
For small business digital skills support, we partnered
by the Ministry of Education as requiring broadband for
with Digital Journeys, a social enterprise to create free
essential learning. Since April 2020, the initiative has
online resources. These included articles, step-by-step
helped connect over 12,000 student homes through
instructions, tips and videos to help small business
retailers delivering broadband services, using free
owners understand technology and digital services.
wholesale connections from Chorus, other New Zealand
wholesale providers and the Ministry of Education.
We’ll continue to work together to offer free wholesale
connections for retailers until December 2021. We will
continue to work with the Government and others to
find long-lasting solutions towards digital equity.Make New Zealand Better Champion Digital Futures Chorus Sustainability Report 2021 26
Community
engagement
Shine the Light events
Running face to face events in our communities has Monetary value of our FY21 community and charitable
been an important part of our fibre build plan. These are contributions to New Zealand
important in building relationships with local councils and
business groups, as well as addressing any community Contribution type Amount
concerns. In 2020 we introduced Shine the Light events,
in communities where we had completed the fibre Cash contributions / donations $252,000
build but uptake was slow. These events continue to be
key in building community goodwill, identifying digital Time (employee volunteering) $98,000
skills needs and understanding the barriers people
have to connecting. For FY21 we’ve run 47 Shine the Inkind giving $4.55 million
Murals on our cabinets to help combat
Light events nationwide, and in just a few years we've
graffiti vandalism.
reached thousands of individuals. For FY22 we’ll focus
on expanding these events to focus on motivation,
connection and strengthening digital skills, partnering
with SeniorNet and Broadband Compare.
Community cabinet art
Our cabinet art programme has been running since
2010, and each year we complete around 100 murals.
Working with local councils, we commission local artists
to illustrate our street cabinets which helps combat
tagging and graffiti vandalism. For the past few years,
we’ve dedicated some of our funding to create rainbow
murals, that celebrate diversity and inclusiveness in
our communities. For FY21 we’ve added eight Rainbow
murals to our collection.
Volunteer days
Employees are given a workday each year to volunteer
and support local community groups. From spending
the day with the Department of Conservation to help
our environment thrive to spending time with charities,
our people are empowered to give their time to causes
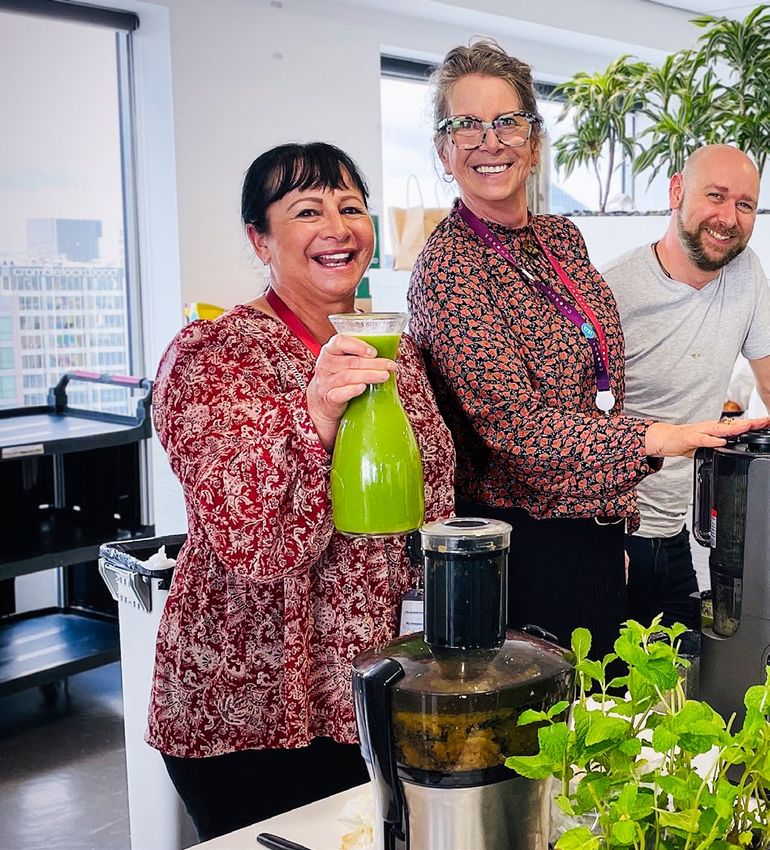
that matter to them. About 2,900 volunteer days have
been used since the programme started in FY13 and 233
people used their volunteer day in FY21.Make New Zealand Better Champion Digital Futures Chorus Sustainability Report 2021 27
Cybersecurity
and privacy
For the information we do hold, we adhere
to the requirements of the New Zealand
Privacy Act.
The Telecommunications Information Privacy Code New Zealand’s National Cyber Security Centre on
(2020) also stipulates that we must not collect advanced cyber threats.
telecommunications information except in limited
exceptional circumstances. We undertake regular reviews, including external
audits and ad-hoc reviews, to provide assurance and
We have a robust privacy framework that is managed feedback on our assessments and controls. Recent
within our wider risk management framework. cyber-attacks against New Zealand businesses and
Our Privacy Officer is responsible for implementing our overseas asset owners have informed our approach.
privacy framework, promoting awareness of privacy Annual training is provided to anyone accessing our
matters, monitoring matters on a day-to-day basis, information systems to raise awareness of information
and escalating matters as required to our Executive. security issues such as phishing and malware.
Our systems, processes and training are compliant with
We recorded no material cybersecurity incidents or
the Privacy Act 2020.
privacy complaints from regulatory bodies in FY21.
The Audit and Risk Management Committee (ARMC)
receives comprehensive cybersecurity reports every
six months, with interim updates as required, which
are then reported back to the Board. We have detailed
policies, processes, and registers to ensure cybersecurity
is addressed through technology selection, network A S A WH O LE S A LE N E T WO RK
delivery practices, and ongoing operations and O PE R ATO R , R ATH E R TH A N
protection of our IT systems. We also have insurances for
key cybersecurity risks. A RE TA ILE R , WE D O N ’ T B ILL
CO N S UM E RS D IRE C TLY
Our practices have continued to evolve with the post-
COVID-19 shift to more flexible working. Our Principal FO R B ROA D BA N D O R
Security Officer monitors our performance, including PH O N E S E RV I CE S .
testing our security incident responses and liaising with
TH I S M E A N S WE H O LD
V E RY LIM ITE D CO N S UM E R
IN FO R M ATI O N .Make New Zealand Better Thriving People Chorus Sustainability Report 2021 28 Nga iwi whai hua Thriving people Champions of safe, fair and inclusive workplaces.
Make New Zealand Better                                                                Thriving People                                    Chorus Sustainability Report 2021   29

Our commitment                                                               Our targets

           Prioritise the safety, health, and welfare                             Top 10% for engagement survey: in the technology
   1       of people before any business objective.                           1   benchmark for wellbeing, diversity and inclusion and flexible
                                                                                  working hours.
           Ensure we have the right channels and processes
   2       in place so all Chorus people know how to get help                 2   40:40:20 split of people leaders, relating to gender.
           and support and feel they can speak up.

           Ensure all people receive at least their legal entitlements
   3       and are treated with dignity and respect.                          3   Safe Plus certification to leading level by 2023.

           Build on our cultural awareness across our organisation,
   4       with a focus on te ao Māori.                                       4   Achieve 0% gender career level pay gap by 2022.

           Continue to strive for gender equality, reduce gender pay              Total employee and people leader population representative of
   5       gap and champion pay equity reform.                                5   customer base (NZ working population as measured by Census results).

   6       Inspire future generations to consider careers in technology.

           Ensure the ethnicity of our people by role is reflective
   7       of NZ population as per NZ Census.

           Enable people to take advantage of our flexible working policy,
   8       helping them achieve balance in their work/personal lives.

   9       Champion diversity, inclusion, and wellbeing for our people.
Make New Zealand Better Thriving People Chorus Sustainability Report 2021 30
Thriving people
Impact in the last 12 months
8.5 out of 10 Human Resources Rainbow Tick, Tech Toolbox
employee Director Gender Tick sessions held
engagement score, New Zealand’s and CQ Cultural nationwide to
and eNPS1 of +62*. Employer of Choice Intelligence Tick launch new
2021 winners. certification Tell Chorus
certified. campaign.
First modern slavery Best Wellness New parental leave 100% target
statement released. Programme award policy introduced achieved for
at the 2021 Human - flexible parental Director Health
Resources leave totalling & Safety visits,
New Zealand eight weeks. with Executive walks
Awards. 225% against target.
1 eNPS means Employee Net Promoter Score
* Based on the average of responses to the four engagement questions.Make New Zealand Better Thriving People Chorus Sustainability Report 2021 31
Health and Safety
The health, safety and wellbeing of
Chorus people is paramount.
This includes our direct employees and the thousands The Total Recordable Injury Frequency Rate (TRIFR) Figure 5:
of people working on our behalf to build, connect and decreased to 2.05 in FY21, down from 2.43 last year. The
maintain our network. Our health and safety focus extends number of injuries to our people reduced to 16, down Injury frequency rates FY19 – FY21
to anyone who is in, or in the vicinity of, our workplaces. from 25 in FY20. The types of injuries were largely sprains,
strains and hand lacerations caused by manual handling 3
In FY21 we established a new risk framework focusing activity and moving about work sites, the same trends seen 2.67
2.43
on our critical risks. For example, mental health, working in prior years. There were no fatalities. The Lost Time Injury 2.05
at height, electricity strikes and vehicle accidents. We
Injury frequency rate
Frequency Rate (LTIFR) decreased to 0.77 from 0.78. Our 2
continue to promote a proactive health and safety culture. TRIFR results are about five times lower than other fibre
We also continue to work with our contractors and infrastructure companies.
suppliers to ensure their systems and procedures meet our 1 0.78 0.77
0.61
health and safety expectations. In the coming year we will focus our efforts on three
key areas: risk management, assurance, and governance
0
The volume of work performed, including our service optimisation. This focus will extend across our ecosystem
TRIFR LTIFR
companies, totalled 7.8 million work hours across the year. to ensure all of our people are our key priority. The
This is a reduction from 10 million hours last year, resulting continued collaboration with our service company partners FY19 FY20 FY21
from the UFB rollout nearing completion and connection to enhance health and safety practices is a constant LTIFR: number of lost time injuries + medical treatment injuries
activity beginning to slow. priority. No business objective will be prioritised over the + restricted work injuries per million hours worked.
health or safety of any person.Make New Zealand Better Thriving People Chorus Sustainability Report 2021 32
Our people
Our operating model and
employee engagement
Chorus is going through a period of significant change Employee FY19 FY20 FY21 Employee FY19 FY20 FY21
as the fibre rollout draws to a close and we transition to turnover rate engagement
a more operational focus. At the same time, a priority
programme of work is helping implement the change Voluntary 9.2% 7.5% 8.1% Total (out of 10) 7.6 8.5 8.5
to a new regulatory model that will shape our future
organisational focus. Total 12.1% 14.1% 12.6% Employee net +28 +67 +62
turnover rate promoter score
These changes in our operating context have seen (eNPS)
a reduction in employees in recent years. Following Positions filled 62.0% 52.6% 43.3%
by internal Participation 98% 94% 86%
targeted operating model changes implemented in
candidates rate
FY21, the total number of permanent and fixed term
employees reduced from 870 to 817, including a
reduction in our executive team from nine to seven Despite the changes in our operating context, employee Individual executive areas have specific programmes
roles. In advance of organisational change, we also put engagement remained stable at 8.5 out of 10 (Peakon that focus on engagement drivers within their teams.
in place new recruitment controls that see us focussed methodology) between FY20 and FY21. While we saw At a company-wide level we adjust our focus each
on the replacement of critical roles only, this has also some minor variability in our employee net promoter quarter to meet the needs highlighted through the survey
contributed to the reduction in employee numbers. score1, starting FY21 at +67 and closing out the year at and consistently look at key areas such as employee
+62, we’re in the top 10% of our international ‘technology’ wellbeing and communication of strategies and direction.
Organisational change has included some redundancies. company benchmark2. These areas are always valued by our people, in particular
In addition to providing redundancy compensation, we through organisational change and the ongoing
have an outplacement programme that ensures anyone uncertainty created by COVID-19.
impacted by change, who we’re unable to redeploy
internally, receives assistance from an external partner
to prepare for career choices outside of Chorus.
1. eNPS means employee Net Promoter Score. Net promoter scores can range from -100 to +100 and are calculated by subtracting the percentage of detractors (0-6 engagement score) from the percentage of promoters
(9-10 engagement score).
2. Chorus engagement survey data is provided by Peakon who provide a technology sector benchmark for comparison. Achieving a score within the top 10% of the benchmark is considered best in class.Make New Zealand Better Thriving People Chorus Sustainability Report 2021 33
Our operating model
and employee engagement cont.
We have a strong focus on sharing and discussing the Our monthly ACCColades recognition programme
business strategy with our people. We hold twice yearly enables employees to nominate their colleagues for
senior leader days where the executive team discuss efforts that support our company values of Authentic,
strategic topics with senior leaders. Each year we bring Collaborative, Courageous and Curious. This has been
together our people leaders for a one-day conference. a forum for recognising sustainability initiatives such
as employee efforts to reduce unnecessary plastic
We also hold interactive Chorus Conversation sessions packaging from our supply chain. Changes to the
with all employees where our strategic direction programme have been introduced in FY22 to
is discussed. ensure we’re identifying achievement across the
business effectively. Chorus Conversation sessions for FY21 in our Auckland office.
Monthly people leader webcasts share top priorities
and focus areas across the business, with time dedicated
to questions so our people leaders can share key
messages with their teams. Monthly CEO updates are
also broadcast via our intranet and we’ve made Yammer
available across the business so people can share key
business activity and to encourage more employee
engagement and feedback.Make New Zealand Better Thriving People Chorus Sustainability Report 2021 34 Diversity and Inclusion (Belonging) Chorus has an established Belonging strategy that guides the areas we focus on to maintain our inclusive culture. Our aim is to strengthen our collective capability, identify, attract, and retain diverse talent, and leverage the diversity of our people. The strategy is owned by the Board and Executive team and there are four parts to the strategy: 1 Flexible and adaptable workforce 2 Diverse leadership 3 Wellbeing 4 Inclusive culture Diversity and inclusion is a priority focus for Chorus management and the Board, with a range of initiatives in place across the employee lifecycle and within our leadership and learning plan. However, we’re not where we want to be as an organisation, in particular concerning diverse leadership. We’ll be placing additional focus in FY22 to drive meaningful change, particularly in areas such as recruitment and selection practices and talent mobility.
Make New Zealand Better                                                                    Thriving People   Chorus Sustainability Report 2021   35

                                                                My work schedule is flexible enough to
                                                                accommodate my family or personal life.

Flexible and adaptable workforce
Flex@Chorus, our approach to flexible working,
provides access to multiple flexible working options for
                                                                  9.2
                                                                  OUT OF 10
                                                                               +
                                                                                 77
                                                                                    eNPS
employees. This includes flexibility in work schedule,
flexible locations of work; part-time working hours and           MAY 2021      MAY 2021
the ability to stagger a return to work after parental leave.

The key requirement for any request to work flexibly is
that it works for the individual, the team, the customer          9.0          +
                                                                                 69
and Chorus as a whole.                                            OUT OF 10         eNPS

The COVID-19 pandemic accelerated the                             MAY 2020      MAY 2020

experimentation we were doing with working flexibly to
the point most employees are now working from home
at least a couple of days a week.
                                                                  8.5
                                                                  OUT OF 10
                                                                               +
                                                                                 50
                                                                                    eNPS
As flexible working has become our new normal we need
to continue to think about what the next iteration of             MAY 2019      MAY 2019
Flex@Chorus looks like to continue to meet the needs
of our people and the business. A project team is working
on how Chorus might re-imagine the future of how                I am satisfied with our
we work. This is a collaborative process, seeking               flexible working policy
input from our employees and involving them in the
design elements.

                                                                  9.2
                                                                  OUT OF 10
                                                                                +
                                                                                   79
                                                                                    eNPS

                                                                  MAY 2021      MAY 2021

                                                                  9.1
                                                                  OUT OF 10
                                                                                +
                                                                                   73
                                                                                    eNPS

                                                                  MAY 2020      MAY 2020

                                                                  8.3
                                                                  OUT OF 10
                                                                               +
                                                                                   45
                                                                                    eNPS

                                                                  MAY 2019      MAY 2019
Make New Zealand Better Thriving People Chorus Sustainability Report 2021 36
Diverse leadership
Figure 6:
There are two parts to our focus on diverse leadership
Gender by role three year review
– gender balance and ethnic mix. With regard to gender
balance we have a target of 40:40:20 gender ratio in
100%
our people leader community and progress against that 14
target has fluctuated during the year. This means our 22
80%
people leader population isn’t consistently reflective 38 36 86 38 38
40 41 41 40 78
of our wider employee population when gender is 60% 45 43
62 60 64 62 62
considered. In February we reviewed our recruitment 60 59 59 55
40% 57
process and have made changes to ensure we strive to
recruit by attracting, interviewing, and hiring a diverse set
20%
of people, while still focusing on hiring the best possible
person for the role. We’ll continue to address this in FY22 0
by driving meaningful change in areas like recruitment,
PEOPLE
LEADERS
2019
ALL
CHORUS
2019
ALL
CHORUS
2020
ALL
CHORUS
2021
PEOPLE
LEADERS
2020
PEOPLE
LEADERS
2021
EXECUTIVE
2020
EXECUTIVE
2021
DIRECTORS
2020
DIRECTORS
2021
DIRECTORS
2019
EXECUTIVE
2019
selection practices and talent mobility.
With regard to gender balance we’re also focussed on
promoting fair pay in our remuneration and pay strategy.
We’re proud to have received three awards in the last
Figure 7:
YWCA Equal Pay Awards in 2019 (Leadership, Progressive
and Supreme Awards) and we remain committed to our Ethnicity* by role 2021
objective of achieving a 0% gender career level pay gap
by 2022.
PEOPLE
We use a career level remuneration system that has a LEADERS
total of nine career levels. Across seven of the nine career 2021
levels the average career level gap is 3.1% or less. The two
remaining and highest career levels have an average pay
gap of 9.1%. The population in those two career levels is ALL
CHORUS
small and therefore any shift in gender balance has a big 2021
impact. A comprehensive review of gender pay equity
forms part of our annual remuneration review process at
0 20% 40% 60% 80% 100%
both a team, function, and all of Chorus level.
NZ European Asian European Pacific Peoples Māori Other
This ensures we stay focused on reducing the gender
career level pay gap. *Prime ethnicity people identify as.You can also read