Do Southern Hemisphere tree rings record past volcanic events? A case study from New Zealand - CP
←
→
Page content transcription
If your browser does not render page correctly, please read the page content below

Clim. Past, 18, 1169–1188, 2022
https://doi.org/10.5194/cp-18-1169-2022
© Author(s) 2022. This work is distributed under
the Creative Commons Attribution 4.0 License.

Do Southern Hemisphere tree rings record past volcanic
events? A case study from New Zealand
Philippa A. Higgins1,2 , Jonathan G. Palmer2,3 , Chris S. M. Turney2,4 , Martin S. Andersen5 , and Fiona Johnson1,6
1 Water Research Centre, School of Civil and Environmental Engineering, UNSW Sydney, Sydney, NSW, 2052, Australia
2 ARC   Centre of Excellence for Australian Biodiversity and Heritage, University of New South Wales,
Sydney, NSW 2052, Australia
3 Earth and Sustainability Science Research Centre, School of Biological, Earth and Environmental Sciences,

University of New South Wales, Sydney, NSW 2052, Australia
4 Division of the Deputy Vice-Chancellor, Research, University of Technology Sydney, Sydney, NSW 2017, Australia
5 Water Research Laboratory, School of Civil & Environmental Engineering, UNSW Sydney, Sydney, NSW 2052, Australia
6 ARC Training Centre in Data Analytics for Resources and Environments, University of Sydney,

Sydney, NSW 2006, Australia

Correspondence: Philippa A. Higgins (philippa.higgins@unsw.edu.au)

Received: 2 December 2021 – Discussion started: 17 December 2021
Revised: 4 April 2022 – Accepted: 13 April 2022 – Published: 24 May 2022

Abstract. Much of our knowledge about the impacts of              that volcanic response can be complex, with positive, nega-
volcanic eruptions on climate comes from proxy records.           tive, and neutral responses identified – sometimes within the
However, little is known about their impact on the low to         same species group. Species-wide composites thus tend to
mid-latitudes of the Southern Hemisphere. Using superposed        underestimate the volcanic response. This has important im-
epoch analysis, we investigated whether volcanic signals          plications for the development of future tree-ring and multi-
could be identified in annual tree-ring series from eight New     proxy temperature reconstructions from the Southern Hemi-
Zealand dendrochronological species. We found that most           sphere.
species are reliable recorders of volcanic cooling and that
the magnitude and persistence of the post-event response can
be broadly linked to plant life history traits. Across species,
site-based factors, particularly altitude and exposure to pre-    1   Introduction
vailing conditions, are more important determinants of the
strength of the volcanic response than species. We then in-       Emissions from large volcanic eruptions are a key source of
vestigated whether chronology selection impacts the magni-        temperature and hydroclimate variability on interannual to
tude of post-volcanic cooling in tree-ring-based temperature      decadal timescales (Robock, 2005; Iles et al., 2013; Sigl et
reconstructions by developing two new multispecies recon-         al., 2015). As few large volcanic eruptions have occurred
structions of New Zealand summer (December–February)              during the instrumental era, much of our knowledge about
temperature with one reconstruction from the pool of all          volcanic impacts on climate, particularly regional and global
available chronologies, and the other from a selected subset      temperature, comes from proxy records spanning centuries to
shown to be sensitive to volcanic eruptions. Both reconstruc-     millennia (Tejedor et al., 2021; Wilson et al., 2016; D’Arrigo
tions record temperature anomalies that are remarkably con-       et al., 2013). These records are predominantly high-altitude
sistent with studies based on instrumental temperature and        or high-latitude tree-ring proxies from the Northern Hemi-
the ensemble mean response of climate models, demonstrat-         sphere (e.g. Briffa et al., 1998; D’Arrigo et al., 2009; Pieper
ing that New Zealand ring widths are reliable indicators of       et al., 2014). In comparison, there are very few proxy-based
regional volcanic climate response. However, we also found        characterisations of the temperature response to volcanic
                                                                  events from the Southern Hemisphere (Tejedor et al., 2021;

Published by Copernicus Publications on behalf of the European Geosciences Union.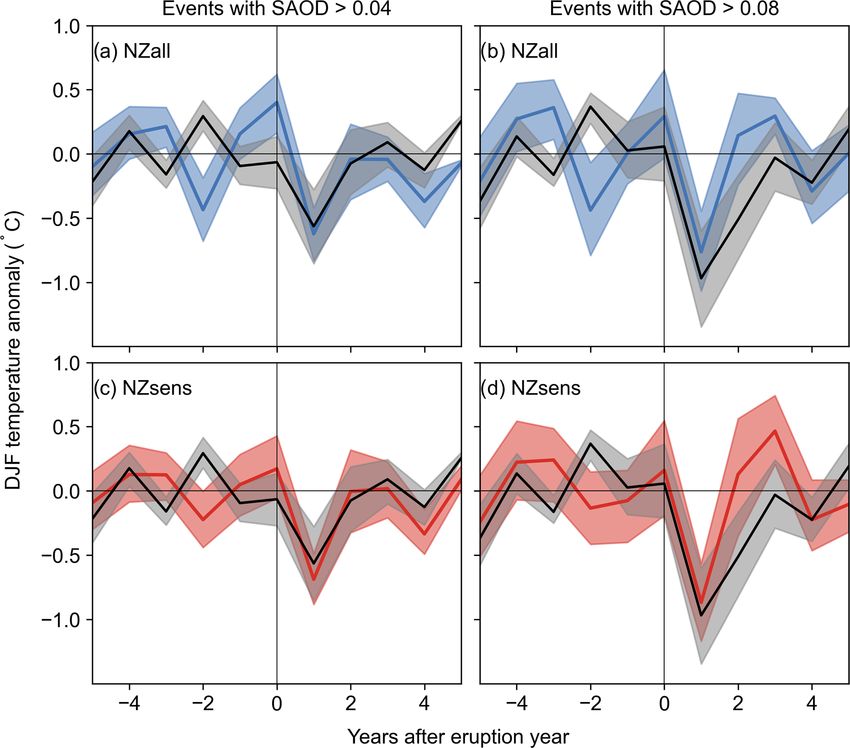
1170                                   P. A. Higgins et al.: Do Southern Hemisphere tree rings record past volcanic events?

Neukom et al., 2014). The limited number of studies con-          season temperature, resulting in narrow rings, (2) neutral or
sidering Southern Hemisphere tree-ring proxies have gener-        no response if the climate sensitivity to volcanic eruptions
ally not found significant impacts following what are con-        is insufficient to influence tree growth, and (3) enhanced
sidered “large” volcanic eruptions (Krakauer and Randerson,       growth due to an increase in the diffuse light fraction and re-
2003; Palmer and Ogden, 1992; Allen et al., 2018; Cook            duced water stress, resulting in wide rings. Temperate-zone
et al., 1992). Two eruptions (Santa Maria in 1902 CE and          trees from the Southern Hemisphere are also likely to dis-
Agung in 1963 CE) have been identified in tree-ring sites         play similar mixed volcanic signals, depending on their rela-
spanning South America, but the impacts of other eruptions        tive sensitivity mode and the magnitude of the regional cool-
on growth have proved less conclusive (Villalba and Bonin-        ing effect. Understanding these factors will help elucidate
segna, 1992).                                                     the proxy archive contribution to the Southern Hemisphere
   Discovering whether the hemispheres have contrasting           model–data discrepancy. This knowledge will benefit future
sensitivities to volcanic eruptions is vital to understanding     studies of hemispheric temperatures and help identify which
future climate projections (Neukom et al., 2014). The muted       species and/or regions should be prioritised for future proxy
volcanic impact in Southern Hemisphere proxy reconstruc-          development.
tions could be due to a maritime dampening effect on post-           Our goal in this study is to assess whether Southern
eruption cooling and/or the distribution of landmasses to-        Hemisphere tree rings record past volcanic events using
ward the Equator (Raible et al., 2016; Krakauer and Ran-          a multispecies network of high-quality, replicated tree-ring
derson, 2003; Allen et al., 2018). Such explanations suggest      chronologies from New Zealand. This country is a long, nar-
that the magnitude of Southern Hemisphere cooling is too          row, archipelagic landscape stretching from 34 to 47◦ S. Cli-
small to be reliably recorded in tree-ring archives. However,     matically, the northern part protrudes into the warm sub-
climate models show a clear Southern Hemisphere volcanic          tropical ridge, whereas the southern end is embedded in the
signal via reduced mean surface air temperatures (Neukom          cool southwesterlies (Salinger, 1980). The North Island and
et al., 2014, 2018). There are several potential explanations     South Island axial ranges, which rise to 3764 m, are a signif-
for the discrepancy between proxy reconstructions and cli-        icant barrier to east–west airflow, leading to strong region-
mate models in the Southern Hemisphere. These include the         alisation of precipitation anomalies (Salinger, 1980). Land
underestimation of the moderating effects of the ocean on         clearing has resulted in the loss of forests from most low-
post-eruption cooling in climate models, changes to the hy-       land areas and nearly all of the eastern drylands. The most
drological cycle in response to volcanic cooling, uncertain-      common remaining forest types are wet conifer–broadleaved
ties in volcanic forcing data, and/or proxy noise and spatial     forests and montane to alpine forests dominated by southern
distribution (Neukom et al., 2018; Zhu et al., 2020).             beech (Nothofagaceae) (McGlone et al., 2017).
   The question remains as to whether Southern Hemisphere            Tree-ring chronologies have been developed from loca-
proxies – specifically tree rings – do record volcanic events.    tions widely distributed throughout New Zealand. Since the
To our knowledge, no studies have explored the factors which      initial dendrochronological studies undertaken by LaMarche
influence whether (or not) volcanic signals can be identi-        et al. (1979), records have been generated from nine en-
fied using tree-ring data from the Southern Hemisphere. Tree      demic species, of which seven are conifers and two are
growth depends on a range of environmental and biological         Nothofagaceae (Table 1). Five main species have been used
factors, and thus careful site and tree selection is necessary    to develop multi-centennial tree-ring chronologies: kauri
to ensure that a specific influence of interest can be stud-      (Agathis australis), pink pine (Halocarpus biformis), sil-
ied (Norton and Ogden, 1987). Northern Hemisphere tree-           ver pine (Manoao colensoi), cedar (Libocedrus bidwillii),
ring studies are predominantly from high latitudes or mid-        and silver beech (Lophozonia menziesii). Most chronologies
latitude alpine treeline sites where tree growth is temperature   are primarily sensitive to austral summer temperatures, with
limited (Scuderi, 1990). Around 80 % of chronologies from         temperature reconstructions developed from beech (Norton
such sites show significant growth reductions following large     et al., 1989), silver pine (Cook et al., 2002), cedar (Palmer
eruptions due to unusually low growing-season temperatures        and Xiong, 2004), pink pine (Duncan et al., 2010), and multi-
(Krakauer and Randerson, 2003). For high-latitude sites, de-      species networks (Salinger et al., 1994). Thus, New Zealand,
creased light availability after eruptions also contributes to    with its wide latitudinal and altitudinal range, regionalised
the strong growth reduction (Tingley et al., 2014). Tree-ring     climate zones, and wide distribution of tree-ring chronolo-
studies from Northern Hemisphere mid-latitude lowland sites       gies from multiple species – including some instances of
have shown that volcanic response is less clear, as temperate-    multiple species from the same site – is ideal for studying
zone trees are less temperature-limited and have more com-        tree-ring sensitivities to past volcanic events. Using the New
plex relationships with multiple climate variables (Pieper et     Zealand dendrochronological dataset, we aim to answer the
al., 2014; Wilson et al., 2016).                                  following specific questions.
   Exploring possible responses to volcanic eruptions, Pieper
et al. (2014) proposed three modes for tree growth in temper-      1. Can we identify volcanic signals in high-quality tree-
ate regions: (1) growth reduction due to decreased growing-           ring series from the Southern Hemisphere?

Clim. Past, 18, 1169–1188, 2022                                                     https://doi.org/10.5194/cp-18-1169-2022
P. A. Higgins et al.: Do Southern Hemisphere tree rings record past volcanic events?                                        1171

    2. Are there differences in the expression of volcanic sig-   2.2   Selection of volcanic events
       nals amongst the species?
                                                                  Event selection is a significant source of uncertainty in
    3. Does chronology selection impact the magnitude of          tree-ring studies of volcanic cooling. The choice of vol-
       post-volcanic cooling in tree-ring-based temperature re-   canic events can greatly influence the magnitude of aver-
       constructions?                                             age regional cooling identified (Esper et al., 2013; Wilson
                                                                  et al., 2016). In addition, for many events that occurred be-
2     Data and methods                                            fore instrumental records, the timing, location, and size of
                                                                  eruptions are uncertain (Timmreck et al., 2021; Garrison et
2.1    Tree-ring chronologies                                     al., 2018). For this analysis, we are interested in those events
                                                                  which would likely have reduced growing-season tempera-
The New Zealand tree-ring chronologies analysed in this           tures over New Zealand and thus be identifiable as ring-width
study were collated to develop the Eastern Australia and New      anomalies. Therefore, we selected events using a regional
Zealand Drought Atlas (Palmer et al., 2015; Fig. 1). Palmer       volcanic dimming threshold rather than an eruption magni-
et al. (2015) identified chronologies from the International      tude. Prior to the instrumental era, we picked events from the
Tree Ring Data Bank and personal collections, screened the        Greenland and Antarctic ice core sulfate aerosol analysis of
tree-ring measurements for dating problems using the soft-        Toohey and Sigl (2017) based on peak stratospheric atmo-
ware program COFECHA (Holmes., 1983; Grissino-Mayer,              spheric aerosol depth (SAOD). We averaged SAOD, mod-
2001), and developed site “master” chronologies from the          elled using the Easy Volcanic Aerosol module (Toohey et
raw ring widths using the “signal-free” method of stan-           al., 2016), over the latitudinal range of New Zealand (30 to
dardisation (Melvin and Briffa, 2008). The metadata for all       50◦ S). The SAOD magnitude corresponding to a substan-
New Zealand chronologies are provided in Table S1 in the          tial temperature response is unknown before analysis. How-
Supplement. As only a single chronology has been devel-           ever, selecting a magnitude post-analysis based on the ob-
oped from mountain toatoa (Phyllocladus alpinus), it was          served response risks biasing the results (Haurwitz and Brier,
excluded from the study, leaving a pool of 96 chronolo-           1981). Therefore, the following two different SAOD thresh-
gies from eight dendrochronological species for volcanic re-      olds were used: SAOD > 0.08, which resulted in 10 eruptions
sponse analysis.                                                  for analysis between 1400 and 1900 CE, and SAOD > 0.04,
   Table 1 summarises the distribution, average climate re-       resulting in 18 eruptions for the same period (Fig. 2). Be-
sponses, and main wood properties (average annual ring            tween 1900 and 1990 CE, we selected the three largest
growth and temporal correlation or persistence) of the            tropical eruptions, which have been shown to have signifi-
species, as described by the studies documenting the de-          cant impacts on instrumental temperatures in New Zealand
velopment of the chronologies. In addition, the response of       (Salinger, 1998). At each methodological step, the analysis
each species to average New Zealand monthly temperatures,         was carried out using both the 13 (10 pre-1900 CE events
calculated for this study, is also summarised. All species        plus 3 post-1900 CE) and 21 (18 pre-1900 CE events plus
show significant (p < 0.05) relationships with average New        3 post-1900 CE) event lists separately. Full details of all se-
Zealand temperatures (Salinger, 1981; Mullan, 2012) during        lected eruptions are provided in Table S2 in the Supplement.
individual months of the current growing season, except toa-
toa (Table 1, Figs. S1–S6 in the Supplement). Tree growth
is only weakly correlated with average monthly tempera-           2.3   Superposed epoch analysis
tures, with |r| < 0.3 for most chronologies. Pink pine shows
stronger correlations with summer temperatures, with r val-       We tested whether a volcanic signal can be identified in New
ues of 0.4–0.6. Pine pink is also significantly correlated to     Zealand tree-ring chronologies using superposed epoch anal-
temperatures over the entire growing season, whereas the          ysis (SEA; Haurwitz and Brier, 1981), a statistical technique
other species are seasonally restricted with significant cor-     widely used to determine the impacts of volcanic eruptions
relations to peak summer temperatures only. Most species          on climate (Rao et al., 2019b; Adams et al., 2003; Scuderi,
are positively correlated to current season temperatures, with    1990; Salinger, 1998; Tejedor et al., 2021). The composite
wider ring widths associated with warm years; however,            response of individual chronologies to the 13 largest erup-
kauri and beech show an inverse relationship to tempera-          tions and the 21 full eruption list between 1400 and 1990 CE
ture, with warm temperatures restricting growth. Cedar, sil-      was studied 0–5 years post-event, with anomalies calculated
ver pine, mountain beech, and both Phyllocladus species           by subtracting the average of the nearest 5 year background
show stronger sensitivities to prior than current season tem-     period undisturbed by volcanic forcing (Table S2; Büntgen
peratures (Figs. S1–S6).                                          et al., 2020). Species-level responses were then tested us-
                                                                  ing a composite chronology produced by simple averaging
                                                                  of annual values across sites (Cook and Kairiukstis, 1990).
                                                                  Volcanic responses were categorised as positive or negative
                                                                  if the anomalies exceeded the 5th or 95th percentile response

https://doi.org/10.5194/cp-18-1169-2022                                                      Clim. Past, 18, 1169–1188, 2022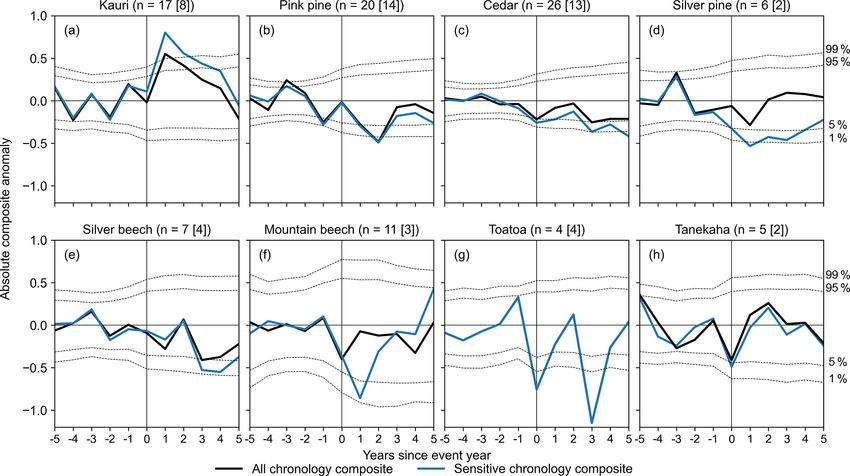
P. A. Higgins et al.: Do Southern Hemisphere tree rings record past volcanic events?
https://doi.org/10.5194/cp-18-1169-2022
Table 1. Distribution, reported climate sensitivities, and key references for New Zealand dendrochronological species.
Code Species Common No. of Ring width Persistence Distribution Reported climate Temperature Chronology development
name chronologies (mm yr−1 ) (GINIc ) sensitivity sensitivityd
AGAU Agathis australis Kauri 17 (9b )a 1.66 ± 0.59 0.106 North Island, north of ENSO; inverse Inverse relationship Boswijk et al. (2006),
38◦ S, relationship to current summer Buckley et al. (2000),
predominantly lowland to current year temperatures Fowler et al. (2008),
forests that can temperature and LaMarche et al. (1979),
be > 500 m precipitation Ogden and Ahmed (1989),
Palmer et al. (2006)
HABI Halocarpus biformis Pink pine 20 (19b ) 0.44 ± 0.1 0.074 Low altitude to subalpine; Frost tolerant; Current growing D’Arrigo et al. (1996),
central North Island to sensitive to season (P), Fenwick (2003),
Stewart Island year-round prior summer (S) Xiong et al. (1998)
temperatures
LACO Manoao colensoi Silver pine 6 (4) 0.56 ± 0.20 0.065 Low-elevation forests Summer Inverse relationship to Cook et al. (2002),
(formerly of the South Island temperatures prior autumn (P), D’Arrigo et al. (1998)
Lagarostrobos western coast and some current summer and
colensoi) North Island locations autumn (S)
LIBI Libocedrus bidwillii New Zealand 26 (21) 0.7 ± 0.17 0.091 Widely distributed over Summer Inverse relationship to LaMarche et al. (1979),
cedar North and South Islands temperatures, to prior summer (P), Xiong and Palmer (2000)
south of 38◦ S at precipitation current summer (S)
200 to 1200 m a.s.l.
NOME Lophozonia menziesii Silver beech 7 (1) 1.14 ± 0.24 0.136 Montane and subalpine Summer Inverse relationship to Norton (1983b, 1984)
(formerly Nothofagus forests, common in temperatures prior summer and
menziesii) the South Island autumn (P), current
summer (S)
NOSO Fuscospora cliffortioides Mountain 11 (4) 0.92 ± 0.23 0.136 Closed forests of Summer Inverse relationship to Norton (1983a, 1984)
(formerly Nothofagus beech the central North temperatures prior summer and
solandri var. Island and the eastern autumn (P), mixed
cliffortioides) South Island, from the valley current summer
floor to ∼ 1300 m signal (S)
PHAL Phyllocladus alpinus Mountain 1 0.59 ± 0.22 0.065 Throughout New Zealand, NA NA LaMarche et al. (1979)
toatoa lowland to subalpine forests
Clim. Past, 18, 1169–1188, 2022
PHGL Phyllocladus toatoa Toatoa 4 0.63 0.129 North Island montane Summer Inverse relationship Dunwiddie (1979),
(formerly P. glaucus) forest between temperatures, to prior summer LaMarche et al. (1979),
850 and 1000 m precipitation, and autumn Palmer (1989),
pressure anomalies Salinger et al. (1994)
PHTR Phyllocladus Tānekaha 5 1.04 0.118 Lowland forest up to Summer Inverse relationship Dunwiddie (1979),
trichomanoides 800 m a.s.l., temperatures, to prior summer LaMarche et al. (1979),
north of 42◦ S precipitation, and autumn Palmer (1989),
pressure anomalies Palmer and Ogden (1992),
Salinger et al. (1994)
a Numbers in brackets indicate the number of chronologies extending to 1990 CE available for the temperature reconstructions. b Includes published master chronology. c GINI coefficient – an all-lag measure of diversity in tree-ring records (Biondi and Qeadan, 2008)
d Summary of sensitivity to New Zealand average temperatures calculated for this study (see also Figs. S1 to S6). Where significant relationships to both prior and current season temperatures exist, P indicates the primary (dominant) sensitivity and S indicates the secondary
sensitivity. NA: not available.
1172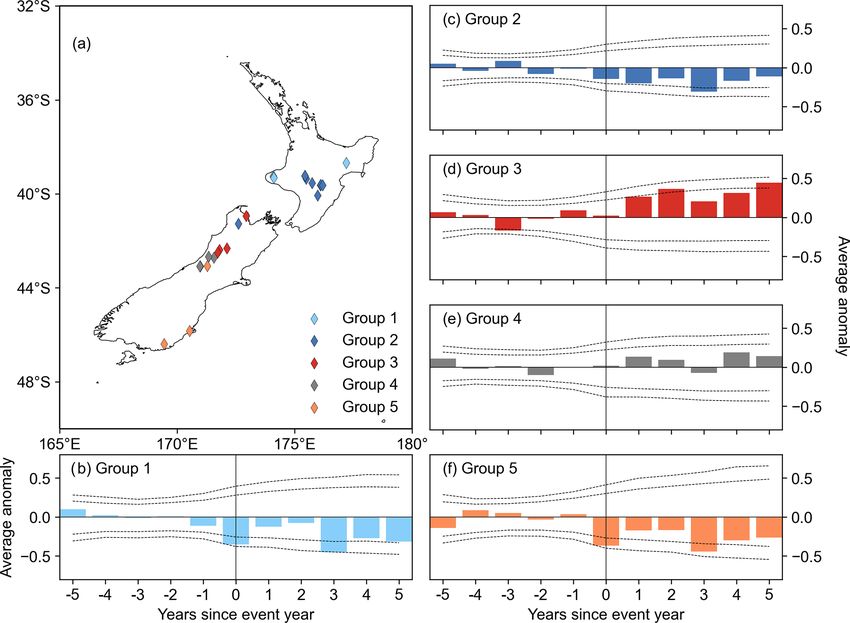
P. A. Higgins et al.: Do Southern Hemisphere tree rings record past volcanic events?                                               1173

Figure 1. Distribution of tree-ring chronologies in New Zealand. Elevation data sourced from the LINZ Data Service and licensed for reuse
under CC BY 4.0.

of 10 000 random samples of years undisturbed by volcanic              from the New Zealand National Institute of Water and At-
forcing or neutral if they fell between these bounds.                  mospheric Research (NIWA), to examine the temperature re-
                                                                       sponse of the chronologies. Correlations were calculated be-
2.4   Temperature reconstructions                                      tween autoregressively modelled chronologies and monthly
                                                                       climate data, with each month treated as a separate time se-
To investigate the influence of chronology selection on the            ries. A 20-month window was selected for correlation anal-
identification of volcanic signals in temperature reconstruc-          ysis, extending from October of the previous growing sea-
tions, we report two new reconstructions of New Zealand                son to May at the end of the current austral growing season.
summer temperatures (December–February). We used the                   Two growing seasons were included as significant prior sea-
New Zealand average “seven-station” monthly instrumental               son climate sensitivities have been reported for some species.
temperature series (Salinger, 1981; Mullan, 2012), obtained

https://doi.org/10.5194/cp-18-1169-2022                                                            Clim. Past, 18, 1169–1188, 2022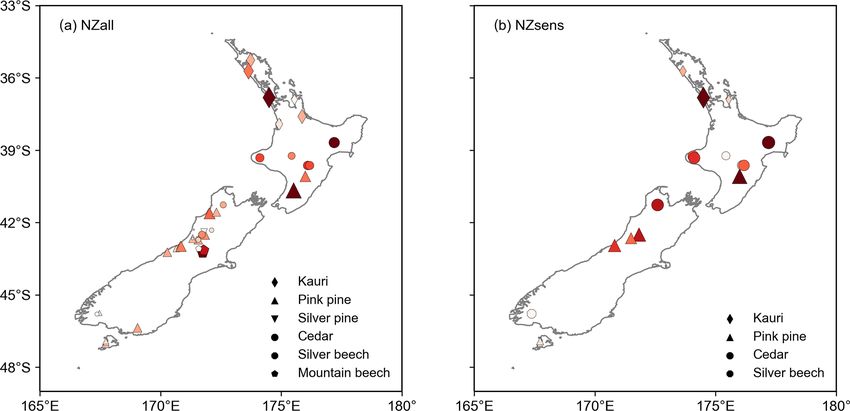
1174                                     P. A. Higgins et al.: Do Southern Hemisphere tree rings record past volcanic events?

Figure 2. Selection of volcanic events based on thresholds of peak modelled stratospheric atmospheric optical depth (Toohey and Sigl,
2017), averaged over 30–50◦ S, greater than 0.04 (blue) and 0.08 (red). Known eruptions are labelled.

Based on the response analysis, December–February (DJF)                 tire data period was used to produce the final reconstructions
was selected as the seasonal target, as this window captures            (Briffa et al., 1990).
the strongest correlations across all species (Table 1).                   The volcanic response in tree-ring reconstructions of tem-
   To ensure sufficient overlap between the chronologies and            perature was also tested using SEA and the two sets of vol-
the temperature dataset for calibration and verification, only          canic eruption years. Further, variation in the temperature re-
chronologies extending to or beyond 1990 CE were retained               sponse to different volcanic events was estimated by calcu-
for the reconstructions. As many sites have not been up-                lating the 90th percentile bootstrap confidence interval from
dated since they were originally sampled in the 1970s and               1000 replicates drawn without replacement from the event
1980s CE, only 58 of the 96 chronologies were retained. The             list (Rao et al., 2019b). In each iteration, approximately two-
first reconstruction (NZall) included the full suite of avail-          thirds (9 of 13 or 15 of 21) of the volcanic events were se-
able chronologies extending to 1990 CE, while the second                lected. The confidence interval provides some indication of
(NZsel) was limited to those chronologies that showed a                 how eruptions of different sizes, locations, and seasonality
significant volcanic signal using SEA. In each case, only               may impact the SEA results. To further assess how event se-
those chronologies significantly (p < 0.1) correlated to av-            lection may have affected the SEA results, the analysis was
erage DJF temperatures over the period 1911–1990 CE were                repeated using volcanic events selected from the ice core
used. The tree-ring series were also tested as potential pre-           analysis of Crowley and Unterman (2013), using a South-
dictors with a lag of 1 year with respect to the temperature            ern Hemisphere-wide average threshold of SAOD > 0.08 and
data, as prior climate often has a lingering influence on cur-          SAOD > 0.04 rather than a regional threshold (Table S3).
rent year’s tree growth (Fritts, 1976; Table 1). Average DJF               We compared the volcanic response seen in our multi-
temperatures were reconstructed using nested principal com-             species reconstructions to the ensemble mean DJF response
ponent linear regression (Cook et al., 2007, 2010, 1999). A             of seven climate models from the Coupled Model Inter-
50 : 50 split calibration–validation scheme was used in which           comparison Project 5 (CMIP5) suite with Last Millennium
the model was initially calibrated on the first half of the data        (past1000, 850–1850 CE) simulations. The CMIP5 models
(1911–1950 CE) and validated on the second half (1951–                  were forced with either the Gao et al. (2008) or Crowley and
1990 CE); following this, the model was re-estimated with               Unterman (2013) volcanic forcing series (see Table S4). Data
the calibration and validation periods reversed. Once the split         from the historical simulations were appended to extend the
models were verified based on the verification period reduc-            dataset from 1850 to 2005 CE.
tion of error (VRE) and verification period coefficient of ef-
ficiency (VCE; Cook and Kairiukstis, 1990) metrics, the en-

Clim. Past, 18, 1169–1188, 2022                                                             https://doi.org/10.5194/cp-18-1169-2022
P. A. Higgins et al.: Do Southern Hemisphere tree rings record past volcanic events?                                                  1175

Figure 3. Mean chronology departures 5 years before and 5 years after the 13 largest eruption years (year 0), separated by tree species.
The chronologies contributing to the species-wide composite are shown in black, with the number of chronologies indicated in parentheses.
The sensitive chronology composite in shown in blue and the number of contributing chronologies is shown in brackets. Significance bands
(dotted grey lines) are the 1st, 5th, 95th, and 99th percentile of 10 000 random samples of non-event years from the species-wide composite.

3     Results                                                           beech chronologies extend only to the mid-1700s, the species
                                                                        composites were tested against a smaller subset of volcanic
3.1    Overall species volcanic responses                               events, which may contribute to this result.
                                                                           Of the remaining five species, one recorded a positive
The results of the superposed epoch analysis for the                    response, while four recorded a negative response. Kauri
13 largest volcanic eruptions between 1400 and 1990 CE                  (Fig. 3a) was the only species to show a composite posi-
are shown in Fig. 3. Two composite responses are shown                  tive response to volcanic events, maximal in year t +1. Kauri
for each species: the response averaged across all sites (“all          showed a consistent response across sites, with all except two
chronology composite”) and the response calculated only                 chronologies showing a positive anomaly following an event,
from the site chronologies that individually showed a signif-           although only 8 of the 17 positive responses were significant
icant (either positive or negative) response to volcanic erup-          at p < 0.05. The sensitive chronology composite recorded
tions (“sensitive chronology composite”). Analysis was re-              a very strong t + 1 response, indicating that at these eight
peated for the full set of 21 eruptions with SAOD > 0.04,               sites, kauri receives a significant growth benefit from the cli-
with similar (but weaker) results for most species, suggest-            matic changes following a volcanic eruption. This response
ing that not all events had a measurable climatic impact over           is coherent with the predominant kauri temperature sensitiv-
New Zealand (Fig. S7).                                                  ity, which is an inverse response to current summer tempera-
   The species-wide response to volcanic events varied                  tures (Fig. S3). However, as most kauri chronologies are only
widely between New Zealand dendrochronological species.                 weakly correlated to monthly temperatures, the strong vol-
Three out of eight species, i.e. silver pine, mountain                  canic response suggests climatic changes other than temper-
beech, and tānekaha, recorded a composite neutral response.            ature also contribute to the post-event growth benefit.
Tānekaha is only weakly correlated to New Zealand aver-                   Pink pine, cedar, silver beech, and toatoa show lagged
age temperatures (Fig. S6b), which may explain its sub-                 negative responses to volcanic events, with peak negative
dued response. However, compared to other species, moun-                anomalies recorded in years t +2 or t +3 (Fig. 3b, c, e, and g).
tain beech and silver pine both show relatively strong tem-             The pink pine response is consistent across sites. All ex-
perature sensitivities (Figs. S1a and S4). As many mountain             cept one pink pine chronology recorded a negative response

https://doi.org/10.5194/cp-18-1169-2022                                                              Clim. Past, 18, 1169–1188, 2022
1176 P. A. Higgins et al.: Do Southern Hemisphere tree rings record past volcanic events?
in t + 2, which was significant for most of the chronolo- and Flagstaff Creek (Fig. S8d and e), receives a growth ben-
gies (14/21; p < 0.05). This response is coherent with the efit in the 2 years following an eruption similar to that ob-
pink pine’s broad sensitivity to temperatures over the cur- served in North Island kauri. In cedar, we observed all three
rent growing season (Fig. S2), i.e. cooler spring–summer– of the proposed temperate-zone tree responses to volcanic
autumn temperatures suppress growth across most pink pine events – positive, negative, and neutral growth – all within a
sites. Similarly, the negative silver beech response is coher- single species, highlighting the importance of site-based fac-
ent with its current season temperature sensitivity (Fig. S1b), tors in determining tree response in temperate zones.
although neither the temperature correlation nor the volcanic
response is particularly strong. All four toatoa chronologies 3.3 Calibration and validation of the temperature
recorded a significant negative response in t + 3. However, reconstructions
as toatoa shows only weak lagged correlation with monthly
temperatures (Fig. S6a), the link between temperature sensi- The peak summer period was selected as the seasonal re-
tivity and volcanic response is not easily elucidated. construction target, as the largest number of chronologies
In contrast, cedar does not show a consistent species-wide across species showed significant correlations with temper-
response. Both significant negative and positive responses atures between December and February (Table 1). Selecting
were recorded in 13 of the 26 chronologies, with the rest only those chronologies correlated at p < 0.1 with average
showing a neutral response. This is despite a largely con- DJF temperatures resulted in a predictor pool of 45 chronolo-
sistent within-species temperature sensitivity, which is an in- gies for reconstruction NZall, of which 25 showed significant
verse response to prior season temperatures (Fig. S5). volcanic impacts and were used to produce the reconstruction
NZsens.
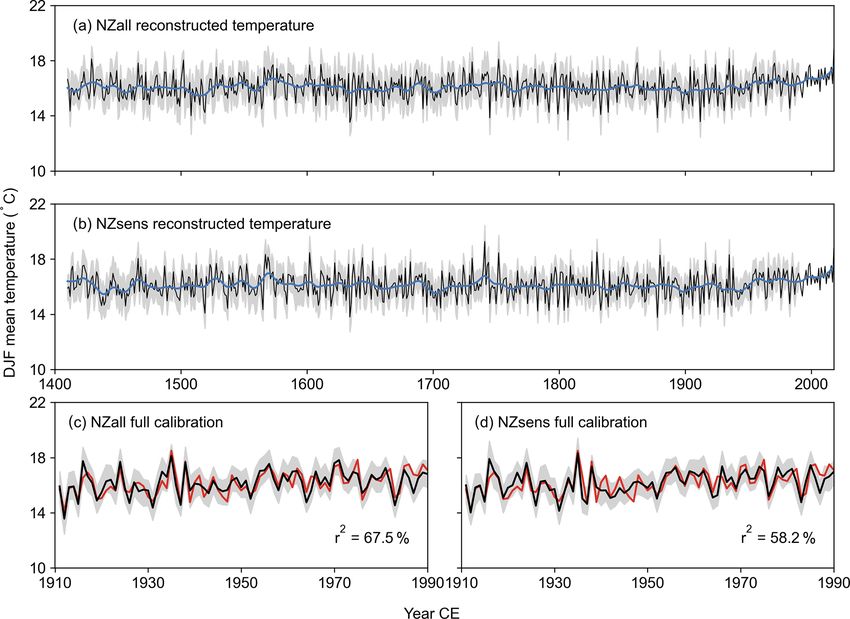
Both New Zealand DJF average temperature reconstruc-
3.2 Within-species variability in volcanic response tions are shown in Fig. 5 alongside their instrumental fit
The overall muted species response of cedar masks very dif- over the 1911–1990 CE calibration period. There is good
ferent individual chronology responses. Cedar ring-width se- agreement between the reconstructions, with a Pearson r
ries respond differently to volcanic events depending on their of 0.81 over the entire reconstruction period and 0.9 after
location, with both very negative and very positive responses 1750 CE. The initial, best-replicated nests, which cover the
recorded. The other species do not show similar variation. period 1790–1990 CE, account for 67.5 % and 58.2 % of in-
The cedar chronologies have the widest geographical dis- strumental temperature variability for the NZall and NZsens
tribution of any species, and thus geographical factors may reconstructions, respectively. The minimum amount of vari-
influence the variability in response. We used k-means clus- ance explained over all nests is 44.1 % for NZall and 34.3 %
tering via principal component analysis (Ding and He, 2004) for NZsens. The full calibration and validation statistics are
to investigate whether within-species variation could be ex- provided in Figs. S9 and S10. For both reconstructions, VRE
plained by obvious factors like regional climate or eleva- values are positive over all nests from 1413 to 1990 CE;
tion. Principal component analysis (PCA) was applied to the however, VCE values are only positive after 1520 CE in the
longest common time interval of the chronologies (1732– NZsens reconstruction when calibrated to the early window
1976 CE), and the first four principal components were re- (1911–1950 CE). The declining instrumental data quality in
tained. the early period and the relatively few predictors retained for
Five chronology groups were identified via clustering NZsens, are likely responsible for the negative values.
(Fig. 4a), broadly corresponding to differences in region Increasing temperatures are observable in both reconstruc-
and altitude. North Island chronologies were distributed in tions from around 1950 CE, matching the trend in instrumen-
two groups. All chronologies are from montane to sub- tal temperatures. Prior to the instrumental period, tempera-
alpine areas above 800 m, with groups differentiated between tures were higher than average for a sustained period during
coastal (G1) and inland (G2) locations. A single chronol- the 16th century and for a shorter period in the early 18th cen-
ogy from the north of the South Island was included in G2. tury. Periods of cooler-than-average temperatures have also
Chronologies from the western coast of the South Island occurred, starting at ∼ 1470, 1630, and 1860 CE. The recon-
were also distributed in two groups, differentiating between structions are consistent with previously published tempera-
lowland (G3) and montane (G4) forest. The final group- ture reconstructions from New Zealand (Cook et al., 2002;
ing (G5) includes three chronologies from the dry east- Duncan et al., 2010; Palmer and Xiong, 2004) despite differ-
ern lowlands. Strong – but opposing – volcanic responses ences in the climate targets (seasons and locations), recon-
are identified via clustering. Significant lagged post-eruption struction methodologies, and large differences in the number
growth reduction is identified in groups G1 and G2 from and geographical distribution of chronologies used in their
montane to subalpine sites from the North Island, includ- development (Fig. S11 and Table S5).
ing Takapari (Fig. S8c), and the southernmost grouping, G5.
Group three (G3), which includes lowland chronologies from
the northwestern coast of the South Island, including Ahaura
Clim. Past, 18, 1169–1188, 2022 https://doi.org/10.5194/cp-18-1169-2022P. A. Higgins et al.: Do Southern Hemisphere tree rings record past volcanic events? 1177
Figure 4. (a) Results of k-means clustering of New Zealand cedar chronologies. (b–f) Mean chronology departures 5 years before and after
eruption years (year 0), separated by cluster, and the 95th and 99th significance levels calculated by generating 10 000 random samples
of non-event years from the group composite. The map in (a) was made with Natural Earth free vector map data, which are available at
http://naturalearthdata.com (last access: 17 November 2021).
3.4 Volcanic signals in the temperature reconstructions the 21-event anomalies. However, the mean model ensemble
lies within the 90 % uncertainty range of both reconstruc-
Figure 6 shows the results of the SEA analysis for the two tions, indicating that the difference in magnitude between
New Zealand temperature reconstructions, for both sets of models and reconstructions is not significant for either the
volcanic events, compared to the volcanic response of an en- restricted 13-event set or the full 21-event set. The differ-
semble of seven CMIP5 model outputs for the New Zealand ence in post-event recovery is significant, with temperatures
region. For the 21 events with SAOD > 0.04, results are re- recovering by year t + 2 in the reconstructions and modelled
markably similar between the temperature reconstructions temperature anomalies persisting in year t +2. This is the op-
and the model ensemble. Both the timing and magnitude of posite result to many tree-ring-based temperature reconstruc-
the post-event anomaly, which is only significant in year t+1, tions from the Northern Hemisphere, which show lagged per-
are consistent across the models and reconstructions, as is the sistence compared to climate models due to biological effects
timing of the post-event recovery, which occurs in year t + 2. in the ring-width series (see Sect. 4.4).
The response to the subset of the 13 largest events shows The difference between the NZall and NZsens reconstruc-
larger year t + 1 temperature anomalies for both the climate tion response is minor for both subsets of volcanic events.
models and the reconstructions, with the greatest increase in The anomaly recorded by NZsens is 0.07 ◦ C larger than
response magnitude displayed by the model ensemble. Year NZall for the 21-event series and 0.1 ◦ C larger for the 13-
t +1 anomalies are ∼ 0.1 ◦ C larger for NZall, ∼ 0.2 ◦ C larger event series. The small difference between the reconstruc-
for NZsens, and ∼ 0.4 ◦ C larger for the model ensemble than tions can be explained by the weightings applied to the
https://doi.org/10.5194/cp-18-1169-2022 Clim. Past, 18, 1169–1188, 20221178 P. A. Higgins et al.: Do Southern Hemisphere tree rings record past volcanic events?
Figure 5. New Zealand average DJF temperature reconstructions. Unfiltered (black) and filtered (20-year spline; blue) mean DJF recon-
struction with 90 % uncertainty interval (grey) between 1400 and 2018 CE for (a) NZall and (b) NZsens. Reconstruction fit to instrumental
temperature (red) over the full calibration period 1911–1990 CE for (c) NZall and (d) NZsens. The 90 % uncertainty interval was calculated
from 300 maximum entropy bootstrap replications.
chronologies in each reconstruction, with both reconstruc- that volcanic events can be clearly identified in New Zealand
tions heavily weighted towards the same subset of chronolo- ring widths, although some species are stronger recorders of
gies. Four of the eight highest-weighted chronologies under- volcanic signals than others. Unlike Northern Hemisphere
pinning NZall are sensitive to volcanic events, and three of high-latitude and tree line sites, which tend to show a con-
these are within the top four highest-weighted chronologies sistent reduction in growth due to volcanic cooling and re-
underpinning NZsens (Fig. 7). Thus, limiting NZsens to only ductions in light availability, no consistent response was
sensitive chronologies had less impact on post-eruption tem- identified across New Zealand conifer and Nothofagaceae
perature anomalies than was expected. species. Predominantly negative (pink pine, cedar, toatoa,
silver beech), positive (kauri), and neutral (mountain beech,
tānekaha, silver pine) responses were recorded. As most New
4 Discussion Zealand chronology sites have been sampled from localised
areas of residual forest that are restricted compared to their
4.1 Volcanic responses recorded by New Zealand trees
natural distributional range, it is difficult to distinguish be-
Previous studies have not identified significant volcanic re- tween species-related sensitivities to volcanic eruptions and
sponses in Southern Hemisphere tree rings (Krakauer and regional climate factors that may control the response. In
Randerson, 2003; Palmer and Ogden, 1992) or in the tem- reality, it is the combination of biological characteristics,
perature reconstructions based on them (Allen et al., 2018; including intrinsic species sensitivity, regional climate, and
Cook et al., 1992). In contrast to previous studies, we found site-specific factors (e.g. soils, exposure to prevailing con-
Clim. Past, 18, 1169–1188, 2022 https://doi.org/10.5194/cp-18-1169-2022P. A. Higgins et al.: Do Southern Hemisphere tree rings record past volcanic events? 1179 Figure 6. Mean anomalies 5 years before and after 21 eruption years with SAOD > 0.04 (a, c) and 13 eruption years with SAOD > 0.08 (b, d) for both the NZall (blue) and NZsens (red) reconstructions. The mean response from an ensemble of seven climate models to the same set of events is shown in black. The 90th percentile bootstrap confidence intervals were constructed from 1000 replicates of either 15 or 9 event years at random. Figure 7. Distribution of tree rings used in (a) the NZall temperature reconstruction and (b) the NZsens temperature reconstruction. Larger, darker red markers represent chronologies with greater relative weighting in the multiple regression. Made with Natural Earth free vector map data available at http://naturalearthdata.com (last access: 17 November 2021). https://doi.org/10.5194/cp-18-1169-2022 Clim. Past, 18, 1169–1188, 2022
1180                                   P. A. Higgins et al.: Do Southern Hemisphere tree rings record past volcanic events?

ditions), which determine the observed volcanic response.          also been observed in other species of Phyllocladus. This
While necessarily simplified, here we discuss some possible        pattern may be related to a climate-triggered flowering cy-
explanatory factors for the species-wide responses.                cle (Ogden and Dunwiddie, 1982; Allen, 1998), foliage pro-
   The species-level results in Figs. 3 and S7 clearly show        duction followed by cladode senescence, or a mast seeding
two response types following volcanic events: a rapid but          event, which can be triggered by multiple cool summers in
short-lived response and a delayed response that begins in         New Zealand Podocarpaceae (Norton and Kelly, 1988). All
year t + 2 or t + 3 but then persists over several years. The      three potential explanations suggest toatoa channel resources
first response, demonstrated by mountain beech and kauri,          to reproduction at the expense of cambial growth (Harper,
we label here the “fast responder”, and the second, shown          1977) following a climate trigger after volcanic events – per-
by pink pine, silver pine, cedar, and silver beech, we la-         haps increased humidity and reduced summer water stress
bel the “stress tolerator” (after Grime, 1979). Many New           at low-elevation North Island sites or an increase in photo-
Zealand conifers appear as typical stress-tolerator species,       synthesis due to a greater fraction of diffuse radiation. More
which have adapted to growing in highly stressful condi-           research on the ecology and life history of toatoa is needed
tions. As a group, they are longer-lived, slower-growing,          to confirm these possible mechanisms.
taller, and markedly frost-tolerant species compared to en-           We compared the response at six sites which each have
demic angiosperms and are tolerant of poor soils (e.g. low         chronologies from two different species (Fig. S8), provid-
nutrients and often poor drainage). Silver beech is highly         ing the unique opportunity to compare species differences
frost and exposure resistant, shade tolerant, and grows on ex-     in volcanic sensitivity directly whilst controlling for most
treme exposure sites (Manson, 1974; Stewart, 2002). Several        other factors. The three species that are co-located and thus
species, including pink pine and silver pine, show an affinity     available for site-based comparison (cedar–pink pine and
for leached, low-nutrient, and waterlogged soils (McGlone et       cedar–silver pine) all showed stress-tolerator responses to
al., 2017). The stress tolerators are characterised by narrow      volcanic eruptions. Pink pine and cedar often grow together
average ring widths and high biological persistence (tempo-        in mixed stands. Both species are sensitive to temperature,
ral autocorrelation) arising from carbohydrate storage or leaf     although pink pine has a maximum correlation to late sum-
retention (see Table 1). Therefore, stress tolerators are slow     mer temperature, whereas cedar responds to conditions in
to respond to changes in conditions, such as volcanic cooling.     the winter prior to the growing season and in spring (Fen-
The stress-tolerator response resembles the response of high-      wick, 2003). A significant difference in the response between
latitude Northern Hemisphere trees, although arctic trees dis-     species was observed only at one of three sites. Compari-
play even greater lagged persistence, with suppressed growth       son over additional sites is therefore required to determine
for up to 10 years following volcanic events (Krakauer and         whether the difference in seasonal temperature response may
Randerson, 2003).                                                  result in a difference in the sensitivity of pink pine and cedar
   In contrast, the fast responders both respond and recover       to climate disturbance following eruptions. Differences be-
more quickly from a detrimental change in conditions (e.g.         tween the cedar and silver pine responses were observed at
mountain beech) or can rapidly capitalise on beneficial con-       two of the three sites, with cedar showing greater sensitiv-
ditions (e.g. kauri). These are relatively fast-growing species,   ity to volcanic eruptions. Silver pine is primarily found in
indicated by wider average ring widths than the stress tol-        the moist, temperate, low-elevation forests of the western
erators, and they have lower persistence (Table 1). Moun-          coast of the South Island. It is a shade-tolerant species that
tain beech is shade intolerant but has several responses to        grows in highly competitive closed-canopy forests on infer-
abnormally cold temperatures, including rapid shoot growth         tile, poorly drained or waterlogged soils (Wardle, 1977; Cook
and temporarily halting bud formation, which allows it to re-      et al., 2002). It is an exceptionally slow-growing species and
bound quickly after a poor summer (Wardle, 1970). Kauri            shows little year-to year variability in ring width (Table 1).
could be considered a stress tolerator due to its affinity for     Thus, it is unsurprising that volcanic effects were more read-
poor soils, occurrence on ridges and slopes, and drought tol-      ily identified in cedar at the Ahaura and Flagstaff Creek sites
erance (McGlone et al., 2017); however, relative to other          (Fig. S8).
New Zealand conifers in this study, it is a fast responder.
   In contrast to the subdued, persistent decrease in growth       4.2   A kauri growth benefit
shown by the stress tolerator species, the initial decline in
toatoa ring width in year t + 0, subsequent extreme decline        An interesting result of this study is the strong positive
in year t + 3, and recovery by year t + 4 closely resembles        species-wide response of North Island kauri to volcanic
the boom–bust behaviour of the fast responders, but with sev-      events (Fig. 3a) despite the weak correlation of the chronolo-
eral years’ lag. The dominant climate response of toatoa is a      gies to monthly temperatures (Fig. S3). Over 70 % of
weak negative correlation to prior growing-season tempera-         the kauri chronologies recorded a small but significant in-
tures (Fig. S6a) but a strong positive correlation to summer       crease in ring width in the year following a large eruption
temperatures two growing seasons prior. This results in a          (SAOD > 0.04), indicating a growth benefit from volcan-
quasi-biennial pattern of wide and narrow rings, which has         ism. Previous studies of kauri climate response function have

Clim. Past, 18, 1169–1188, 2022                                                       https://doi.org/10.5194/cp-18-1169-2022
P. A. Higgins et al.: Do Southern Hemisphere tree rings record past volcanic events?                                          1181

shown that growth is not primarily related to temperature but        In an attempt to distinguish between the effects of El Niño
is enhanced during cool, dry years, with the strongest (nega-     events and volcanic eruptions on kauri growth, we repeated
tive) correlation to austral spring temperatures (Ogden and       the SEA analysis, removing the three volcanic eruptions
Ahmed, 1989; Buckley et al., 2000). Ring growth is thus           since 1900 CE. A smaller composite ring-width anomaly
enhanced during El Niño events, which result in cool, dry         was recorded without the three events, but the response re-
spring conditions in northern New Zealand, and kauri has          mained significant in year t + 1 (Fig. S13). To test the poten-
been successfully used as a proxy for the El Niño–Southern        tial follow-through impact of the kauri response to El Niño
Oscillation (ENSO; Fowler et al., 2008). The mechanism be-        events on the temperature reconstructions, we removed the
hind this relationship remains largely unclear, although it       ENSO component via linear regression of the Southern Os-
has been proposed that reduced cloud cover during El Niño         cillation Index on the reconstructed temperature series. There
events may benefit kauri growth via increased insolation          is a negligible difference between the original and ENSO-
(Fowler et al., 2000). The opposite conditions follow a vol-      adjusted temperature reconstructions for all volcanic events
canic eruption, with reduced direct insolation and increased      between 1880 and 1990 CE, except for the response to El
diffuse insolation due to scattering by volcanic aerosols (Gu     Chichón in 1982 CE, which is much larger in the unadjusted
et al., 2003). The commonality between the two sets of events     reconstruction (Fig. S14). Based on currently available data,
is cooler-than-average spring and summer temperatures.            we cannot confidently discount that the kauri growth bene-
   This suggests that kauri may capitalise on a decrease in       fit identified in year t + 1 may be a secondary response to
summer evapotranspiration during both El Niño events and          changes in tropical Pacific sea surface temperatures follow-
following significant eruptions. Maximum kauri growth oc-         ing a large eruption. However, this is unlikely to have a large
curs during spring, with large declines in growth rate over the   impact on the post-event anomalies identified in the temper-
peak summer months when evapotranspiration exceeds pre-           ature reconstructions.
cipitation in the northern North Island (Fowler et al., 2005).
Dendrometer band studies suggest that reduced spring and          4.3   Site-related volcanic responses
summer moisture stress may delay the cessation of growth,
resulting in wider annual rings (Palmer and Ogden, 1983).         Differences in volcanic response between sites are observed
No summer cessation of growth was observed by Palmer              for all species, largely between sites with significant de-
and Ogden (1983) at the highest-altitude site, Mt Moehau          creases in growth and sites with neutral responses (Figs. 3
(1MOE, Table S1). This site receives moisture from con-           and S7). More temperature-limited sites, such as sites at
densation and fog drip, as well as rainfall, reducing the         higher elevation and lower latitude, are expected to be
summer precipitation deficit. Plausibly, the increase in dif-     more sensitive to volcanic cooling and thus experience the
fuse radiation and resulting enhanced photosynthesis (Gu et       most reduction in growth. Broadly in line with this expec-
al., 2003; Robock, 2005) may also contribute to post-event        tation, chronologies that are highly correlated to monthly
kauri growth. However, tree growth is generally more con-         temperatures show greater sensitivity to volcanic eruptions
strained by the environment than photosynthesis (Fatichi et       (Fig. S15). However, there are many exceptions, both for
al., 2019; Zweifel et al., 2021), and thus increased photo-       temperature-sensitive sites with a neutral volcanic response
synthesis may not necessarily translate into growth (i.e. a       and sites that are only weakly correlated to temperature but
wider ring) in the presence of another limiting factor, such as   that are markedly affected by the climatic changes following
the summer moisture deficit. Additional research is needed        volcanic eruptions. Thus, volcanic response cannot be sim-
to understand the relative importance of temperature, light       ply interpreted as a response to cooler-than-average temper-
availability, humidity, and soil moisture to sub-annual growth    atures.
in kauri.                                                            Based on the variability in volcanic response observed in
   Many observational and modelling studies propose a link        cedar (Fig. S8) it is evident that site-related factors can have a
between large tropical volcanic eruptions and sea surface         substantial impact on the volcanic response within a species
temperature variability in the tropical Pacific, with El Niño-    group. This finding was further explored using k-means clus-
like conditions more likely in the year following a significant   tering of the widely distributed cedar chronologies (Fig. 4).
event (Emile-Geay et al., 2008; Adams et al., 2003; Khodri        Altitude and latitude are expected to be important explana-
et al., 2017; Christiansen, 2008; Miao et al., 2018; McGregor     tory factors for cedar tree growth, as together they represent
et al., 2010), although this link is not always identifiable in   the relative importance of temperature and water stress at a
the paleoclimate data (Dee et al., 2020). The three eruptions     site. Temperature-limited high-altitude cedar sites at or near
included in this analysis since 1900 CE co-occurred with an       the treeline in the North Island ranges show a significant de-
El Niño event, and the 1982/83 CE El Niño is one of the           cline in tree growth following eruptions, as did coastal sites at
largest on record (Santoso et al., 2017). While we do not         higher latitudes (∼ 46◦ S). We observed a significant increase
wish to debate the eruption–ENSO response as part of this         in cedar growth at low-elevation sites on the northern South
study, these potential interactions complicate our analysis of    Island (Group 3) in response to volcanic cooling, which we
the volcanic signal in kauri.                                     interpret as a reduction in summer evaporative demand. Low-

https://doi.org/10.5194/cp-18-1169-2022                                                       Clim. Past, 18, 1169–1188, 2022
1182                                    P. A. Higgins et al.: Do Southern Hemisphere tree rings record past volcanic events?

elevation trees are more likely to experience summer water           cooling, resulting in a neutral response. The importance of
stress than their high-elevation counterparts due to higher av-      aspect to climate sensitivity – particularly when windward
erage temperatures if precipitation rates are similar. In con-       sites are exposed to prevailing winds – has been highlighted
trast to the significant positive correlation of treeline cedar      in many previous studies (e.g. Dang et al., 2007; Rozas et
sites to average summer temperatures (Fig. S5), the Group 3          al., 2013). For New Zealand, a thorough exploration of the
chronologies display a negative correlation to summer tem-           importance of site-based parameters other than elevation and
peratures (not significant at p < 0.05) indicating that soil         latitude (e.g. aspect, exposure, soil type) to volcanic sen-
moisture may be a limiting factor at these sites. Thus, we find      sitivity is limited because these parameters have not been
that both high- and low-elevation cedar stands can reliably          recorded for many sites.
record volcanic signals, provided that the sites experience
sufficient temperature or moisture stress. Sites that are nei-       4.4   Implications for temperature reconstructions
ther strongly temperature nor water limited (Group 4; Fig. 4)
show a neutral response to volcanic eruptions. A limitation          We expected to find a substantially greater volcanic response
of this analysis is that we have not considered potential spa-       in NZsens (i.e. limited to only those chronologies with an
tial differences in the regional pattern of cooling or changes       individual significant volcanic response) compared to NZall.
in regional atmospheric circulation patterns (Salinger, 1998),       However, while NZsens shows a larger post-volcanic tem-
which could also impact the results for species with a wide          perature response, the difference between the two recon-
distributional range (e.g. cedar).                                   structions is not significant (Fig. 6). As shown in Fig. 7,
   Tree growth of species at different sites is limited by a va-     both reconstructions are heavily weighted towards the same
riety of environmental factors, of which temperature and soil        subset of chronologies. Since, sites with higher sensitiv-
moisture are only two (Fritts, 1976). For many New Zealand           ity (correlation) to temperature in general show higher vol-
species, little is known about what types of sites might ac-         canic response (Fig. S15), limiting NZsens to only sensi-
centuate these factors and thereby enhance the climatic sen-         tive chronologies has only a small impact on post-eruption
sitivity in the tree-ring series (Dunwiddie, 1979). Although         temperatures. Another factor leading to the minimal dif-
the overall Group 2 cedar response was significant, not all          ference between the reconstructions is that many volcani-
high-altitude sites recorded a volcanic signal. Considering          cally sensitive chronologies, particularly kauri, were cored
the location, aspect, forest characteristics, and soil type at in-   before 1990 CE and therefore not included in either tem-
dividual cedar sites, we find that exposure to prevailing con-       perature reconstruction. These sites should be updated with
ditions is the key explanatory variable for the within-species       priority for future studies of volcanic impact in the South-
response for sites near the altitudinal limit. Sites that record a   ern Hemisphere. In developing NZsens, we used a “volcanic
significant growth response have high exposure to prevailing         sensitivity” threshold based on the SEA result significance
winds and are more sensitive to abnormally low growing-              (p < 0.05). By doing so, we reduced the size of the predictor
season temperatures. In contrast, chronologies from sites            pool, which reduced the strength of the reconstruction, par-
characterised by undulating ridgelines and more continuous           ticularly over the initial 100 years, when there were relatively
forest showed a neutral growth response. Sites experienc-            few predictors (Fig. S10a).
ing mesic conditions and closed-canopy forests tend to show             When testing the reconstructions using the event list from
lower sensitivity to adverse environmental conditions, such          Toohey and Sigl (2017) (Fig. 6), we concluded that losing
as low temperatures (Phipps, 1982). Closed-canopy forests            reconstruction strength outweighs the small increase in vol-
are also more likely to be sensitive to increases in the fraction    canic sensitivity in NZsens and that it is not beneficial to re-
of diffuse radiation driving photosynthesis (Gu et al., 2003;        strict the predictor pool. However, when we then repeated the
Tingley et al., 2014), and thus the increase in diffuse radiation    SEA analysis using the event list derived from Crowley and
fraction may compensate for the decrease in temperature to           Unterman (2013), the mean response of NZall to the largest
a greater extent compared to sites with more open canopies.          subset of 12 events with SAOD > 0.08 (Table S3; Fig. S12c)
   North Island kauri is another species for which exposure          was not significant (p > 0.05). The benefit of the restricted
appears to be a determining factor in the chronology re-             predictor set in strengthening the volcanic signal in NZsens is
sponse to eruptions. For kauri, sites with a strong positive         highlighted when using this event list. It is important to note
response to volcanic eruptions are coastal sites exposed to          that the mean NZall response to the full set of Crowley and
prevailing wind conditions or sites limited by poor under-           Unterman (2013) events with Southern Hemisphere-average
lying sediment substrates (e.g. 1TRO, 1KAW; Table S1). In            SAOD > 0.04 is significant (Fig. S12a), which suggests that
comparison, sites that showed little volcanic response were          some eruptions classified as SAOD > 0.08 in Table S3 were
those on the leeward side of the coastal range, which are            not climatically effective over New Zealand. Potential rea-
buffered by inland microclimate effects (e.g. 1PBL, 1PKF;            sons for the differences between the two volcanic datasets,
Table S1). These sites likely experience less water stress dur-      which may have impacted the findings here, are discussed
ing the summer; therefore, we expect that they receive less          Sigl et al. (2014) and Toohey and Sigl (2017).
benefit from reduced evaporative demand related to volcanic

Clim. Past, 18, 1169–1188, 2022                                                         https://doi.org/10.5194/cp-18-1169-2022
You can also read