Interpersonal factors and mental well-being are associated with accuracy in judging the veracity of political news - OSF
←
→
Page content transcription
If your browser does not render page correctly, please read the page content below
Received: 24 November 2021        Revised: 5 March 2022        Accepted: 6 April 2022
DOI: 10.1002/acp.3946

RESEARCH ARTICLE

Interpersonal factors and mental well-being are associated
with accuracy in judging the veracity of political news

Paul Rauwolf

School of Human and Behavioural Sciences,
Bangor University, Bangor, UK                        Abstract
                                                     More work needs to be done to understand how mental well-being and interpersonal
Correspondence
Paul Rauwolf, School of Human and                    factors are associated with biases in judging the veracity of true and false political
Behavioural Sciences, Bangor University,             information. Three days before the 2020 U.S. presidential election, 477 participants
Brigantia Building, Bangor LL57 2AS, UK.
Email: p.rauwolf@bangor.ac.uk                        guessed the veracity of true and false political statements. Interpersonal factors
                                                     (e.g., high prosociality and a need to belong) and mental health risk factors (e.g., high
                                                     depressive symptoms and low eudaimonic well-being) were highly associated with
                                                     believing false information. Further, positive well-being was associated with
                                                     assessing news with a partisan bias. Next, hierarchical regression was used to better
                                                     understand the combination of factors which best predict accurate judgments. To
                                                     reduce the chances of overfitting, out-of-sample validation was used. About 40% of
                                                     the variance for believing false information was explained by high prosociality and
                                                     low well-being. In addition, well-being mediated the effects of political ideology when
                                                     assessing the veracity of political information.

                                                     KEYWORDS
                                                     eudaimonic well-being, interpersonal, mental health, misinformation, truth bias

1    |    I N T RO DU CT I O N                                                      factors. The goal of this work was two-fold. First, it explored whether
                                                                                    various interpersonal and well-being factors were associated with dif-
The ability to differentiate true from false information is a vital skill in        ficulty judging the veracity of both true and false political news state-
the 21st century (Lazer et al., 2018; Van Bavel et al., 2021). This is              ments, presented in the lead-up to the 2020 U.S. presidential election.
particularly true during election cycles, where the amount of false                 Second, this study sought to understand the best combination of
information which crosses social media accounts increases (Allcott &                well-being and interpersonal factors which predicted difficulty in
Gentzkow, 2017). To better understand those who are most vulnera-                   assessing the accuracy of political statements.
ble to false information, recent work has begun to diagnose the indi-                    The meaning behind the study of “misinformation,” “disinformation,”
vidual risk factors associated with inaccurately assessing the veracity             and “fake news” has a complex past. Some define misinformation and dis-
of political information (Ecker et al., 2022; Pennycook & Rand, 2021;               information in mutually exclusive terms, where disinformation represents
Scheufele & Krause, 2019; Sindermann et al., 2020). While invaluable                false information that is shared with the intention to deceive, where
work has shown that difficulty differentiating true from false political            misinformation represents false information that is shared in good faith
information is linked to cognitive processes, political partisanship, and           (Tandoc et al., 2018). Others define misinformation as “any information
socio-demographics (Martel et al., 2020), less is known about whether               that turns out to be false” (Ecker et al., 2022), thus disinformation is a
difficulty judging the veracity of political information is associated              subset of misinformation. Further, the term “fake news” seems to change
with individual differences in mental well-being and interpersonal                  definitions depending on the context (Egelhofer & Lecheler, 2019). This

This is an open access article under the terms of the Creative Commons Attribution License, which permits use, distribution and reproduction in any medium,
provided the original work is properly cited.
© 2022 The Author. Applied Cognitive Psychology published by John Wiley & Sons Ltd.

Appl Cognit Psychol. 2022;1–21.                                                                                        wileyonlinelibrary.com/journal/acp     1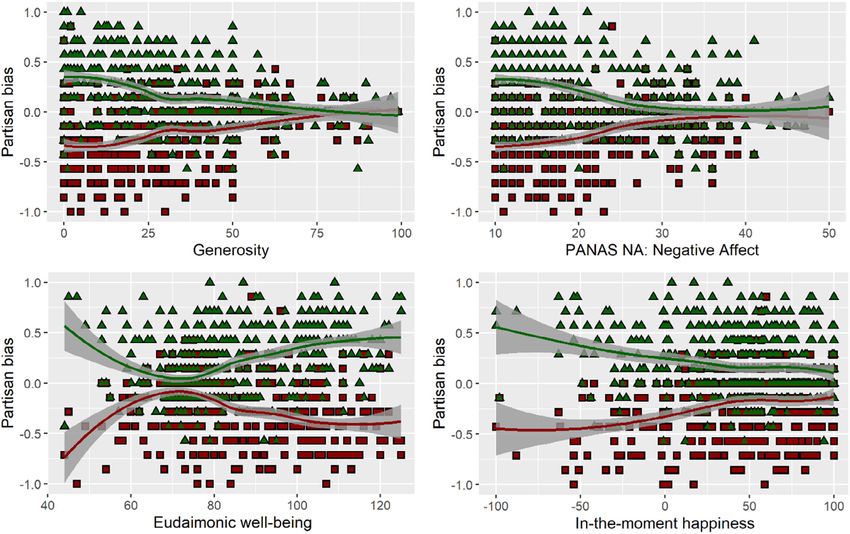
2                                                                                                                                            RAUWOLF

work focused on analyzing individual accuracy when confronted with true        memory, and attention may affect the evaluation of political
and false political statements. The intentions behind the political state-     information.
ments were not considered. So, in this work, misinformation is defined as          The present study explores whether the ability to distinguish
any information that turns out to be false (Ecker et al., 2022; Guess &        between true and false political information is associated with various
Lyons, 2020; Lazer et al., 2018), and the terms “disinformation” and “fake     aspects of well-being. However, evaluating well-being is non-trivial as
news” are not used.                                                            it is a complex, heterogeneous construct, which can be divided into
      Recent work has found that difficulty distinguishing between true        several subcategories (Keyes, 2006; Martela & Sheldon, 2019). One
and false political information is linked to cognitive processes, political    common framework is to subdivide well-being into hedonic well-being
partisanship, and socio-demographics. Reduced analytical thinking is           (sometimes called subjective well-being) and eudaimonic well-being
associated with difficulty differentiating between true and false politi-      (Ryan & Deci, 2001). Hedonic well-being measures personal experi-
cal information (Bronstein et al., 2019; Pennycook & Rand, 2019,               ences of positive and unpleasant feelings, and can be further sub-
2021; Sindermann et al., 2020), but increasing one's time to reflect on        divided in trait and state measures, which evaluate hedonic
political information has been shown to increase one's ability to accu-        experiences over various time frames (Tov, 2018). Eudaimonic well-
rately assess political information (Bago et al., 2020). Age is associated     being considers our ability to pursue our potential and is often mea-
with an increased likelihood to come in contact with and share false           sured by querying feelings of autonomy and purpose in life
information (Brashier & Schacter, 2020; Grinberg et al., 2019). There          (Ryff, 2017; Ryff & Singer, 2008).
is evidence that individuals tend to believe news that is concordant               Since attentional and information processing biases have been
with their political views (Anthony & Moulding, 2019; Bago                     linked to different aspects of well-being such as depression (Gotlib &
et al., 2020; Vegetti & Mancosu, 2020), and those with conservative            Joormann, 2010; Keller et al., 2019), negative affect (Curci
beliefs are particularly prone to consumption of misinformation                et al., 2013), low self-esteem (Howell & Shepperd, 2016; Wiersema
(Grinberg et al., 2019) and inaccurate beliefs (Garrett & Bond, 2022;          et al., 2012), and momentary mood (Forgas & East, 2008; Holland &
Pennycook & Rand, 2019, 2021).                                                 Kensinger, 2010), it is vital to understand which sub-categories of
                                                                               well-being are most strongly linked to difficulty judging the veracity of
                                                                               political statements. As such, this work took an exploratory approach
1.1      |    Impact of mental well-being                                      to evaluating the associations between well-being and the ability to
                                                                               accurately judge the veracity of both true and false political state-
One under-represented area of research is (broadly speaking) mental            ments. The study considered the effects of depression, self-esteem,
well-being. The effects of mental well-being, such as depression or            eudaimonic well-being, and various measures of affect along different
negative affect, on distinguishing true from false political information       time scales. While this study was exploratory and considered several
are only starting to receive interest. Preliminary evidence suggests           measures of well-being, the analysis attempted to reduce the risk of
that powerful affective states (Martel et al., 2020) or experimentally         false positives (i.e., type I errors) with methods such as out-of-sample
manipulating anger and anxiety (Weeks, 2015) can bias truth assess-            cross validation and conservative adjustments for multiple compari-
ment of political statements. Further, schizotypal personality traits are      sons (details discussed below).
associated     with   vulnerability   to   believing   false   information
(Anthony & Moulding, 2019). Outside of the political realm, belief in
misinformation about Covid-19 has been linked to depression                    1.2 | Impact of interpersonal behaviors and social
(De Coninck et al., 2021).                                                     factors
      It is surprising that the effects of mental health on assessing polit-
ical information are only starting to garner interest, given the large         It has also been argued that the impact of interpersonal factors on
repository of work finding comorbidities between mental health risk            judging the veracity of political statements requires increased atten-
factors and various attentional and information processing biases.             tion (Weeks & Gil de Zúñiga, 2021). Humans are complex social crea-
Information avoidance is associated with low self-esteem (Howell &             tures and socially motivated goals might override (or at least affect)
Shepperd, 2016; Wiersema et al., 2012) and experiences of self-                the need for accurate beliefs (Caplan, 2001; Rauwolf et al., 2015; Van
affirmation     can    reduce    information     avoidance     (Howell    &    Bavel & Pereira, 2018; Wilson et al., 2021). In its most broad defini-
Shepperd, 2012, 2017). Depression is associated with attentional defi-         tion, interpersonal factors are factors which affect how an individual
cits (Gotlib & Joormann, 2010; Keller et al., 2019). Negative affect is        behaves in the social environment (Byrd & McKinney, 2012). This can
linked to reduced working memory (Curci et al., 2013). Further, indi-          include factors pertaining to (a) how the individual reacts to a social
viduals more easily recall memories that share the valence of their            environment (sometimes called interpersonal behaviors), but also
current mood (Holland & Kensinger, 2010). Interestingly, positive              (b) how the social environment itself impacts the individual (some-
emotions have also been linked to information processing biases, as            times called social factors) (Cameron & Granger, 2018). This work con-
happiness has been linked to gullibility when trying to detect decep-          sidered   whether     individual     differences   in   under-considered
tion in those who might have committed a theft (Forgas &                       interpersonal behaviors and social factors were associated with diffi-
East, 2008). It is possible that these biases in information processing,       culty judging the veracity of political statements. Specifically, this
RAUWOLF                                                                                                                                                  3

work focused on interpersonal factors that had been found to be               accuracy in judging a variety of political statements. Similarly, the ten-
related to information processing biases in other, related areas.             dency to give preferential treatment to ingroup members might be
    From the perspective of interpersonal behaviors, a large body of          associated with a willingness to believe political congruent informa-
work has considered how social identity motivations might bias beliefs        tion. This study tested that hypothesis. Preferential treatment of
(Van Bavel et al., 2021). It has been argued that individuals might bias      ingroup members was measured by the treatment of ingroup and out-
their beliefs about the world to help maintain a positive image of their      group members in a Dictator game (details explained below)
social/political group (Sternisko et al., 2020). In line with this theory,    (Engel, 2011). To the author's knowledge, no one has measured
there is robust evidence that individuals are more likely to believe          whether preferential behavior toward ingroup members (i.e., a willing-
(Bago et al., 2020; Pereira et al., 2021; Vegetti & Mancosu, 2020) and        ness to pay a cost to give them money) is associated with biased truth
share (Osmundsen et al., 2021; Rathje et al., 2021) information that          assessment of political information.
supports their political party.                                                     Outside of social identity theory, generosity has been linked to a
    While the work on social/political identity has made excellent            general trusting nature (Bekkers, 2007; Chaudhuri & Gangadharan,
progress, less work has considered whether individual differences in          2007). As such, it was hypothesized that generosity might be asso-
socially motivated interpersonal behaviors predict biased perceptions         ciated with a tendency to believe most political statements (and
in the veracity of political statements. If social motives are playing a      thus be vulnerable to misinformation). To test this hypothesis, par-
large part in how individuals navigate the political landscape, then pri-     ticipant's generosity was evaluated using the Dictator game
oritizing social interactions or a willingness to conform to the group        (Engel, 2011).
may be associated with biasing one's belief in information about that               An individual's social environment (i.e., social factors) is also asso-
group. Preliminary research has offered mixed results. Calvillo               ciated with biases in judging the veracity of political statements.
et al. (2021) found that agreeableness and conscientiousness, but not         Homogeneity of social networks (i.e., homophily) is associated with
extraversion (as measured by the Big Five Inventory) were associated          biased truth assessment of political information. Individuals bias their
with the ability to differentiate true from false information. Sin-           social media interactions with those who share their partisan beliefs
dermann et al. (2021), however, found no effect of agreeableness or           (Del Vicario et al., 2016; Mosleh et al., 2021) and ideologically biased
conscientiousness, but did find that extraversion and authoritarian           news consumption is associated with increased misperceptions
submission were linked to difficulty differentiating true and false           (Garrett et al., 2016). To compare the effect-size of homophily to
headlines, while interpersonal trust was linked to improved                   other interpersonal and well-being factors, this study sought to repro-
differentiation.                                                              duce this effect by asking participants the percentage of their friend-
    While the present work specifically focused on individual differ-         ships which share their political candidate. It was hypothesized that
ences in judging the veracity of political statements in the lead up to       increased homophily would be associated with an increased bias to
the 2020 U.S. presidential election, there is evidence that individual        believe information supporting one's candidate.
differences in social identity motives are associated with biased                   It is well-known that, in a variety of circumstance, individuals will
beliefs in very related areas. Individual differences in strength of parti-   go to great lengths to avoid social ostracization, including conforming
san beliefs are associated with a willingness to share fake news on           to those who threaten to ostracize (Williams & Nida, 2011). Recently,
social media (Osmundsen et al., 2021). Further, there is a large body         there is evidence to suggest that ostracism from one's political party
of work which has considered the individual differences associated            is associated with increased willingness to believe false information
with believing conspiracy theories (Douglas et al., 2017). Conspiracy         that supports that party (Garrett et al., 2020). However, individuals
theories are a specific type of misinformation, which argue that secret       likely have friendships across party lines. To the author's knowledge,
plots between people are causing events in the world (Douglas                 no one has considered how threats of ostracism from friends
et al., 2019). Belief in conspiracy theories has been associated with         supporting the other candidate might affect the assessment of true
various social motives, such as belief in a group's greatness and need        and false political statements. The present work asked how much the
for external validation (Douglas, 2021; Douglas et al., 2017). Although,      results of the 2020 U.S. presidential election would affect friendships
Fasce et al. (2021) found somewhat mixed support that need to                 that (a) supported the individual's candidate, and (b) supported the
belong and intergroup anxiety were associated with conspiracy, para-          other main candidate. It was hypothesized that individuals would be
normal, and pseudo-scientific beliefs.                                        more willing to believe positive statements about a friend's candidate,
    The present study sought to extend our knowledge of the influ-            if the individual felt that the friendship would be impacted by the
ence of social identity motives by evaluating whether biased truth            results of the election.
assessment was associated with individual differences in (a) one's
need to belong, and (b) preferential behavior toward ingroup mem-
bers. Given social/political identity motives, it has been hypothesized       1.3      |   The strongest combination of factors
that a high need to belong might lead individuals to bias their assess-
ment of information to fall in line with the group (Fasce et al., 2021).      Beyond considering the effects of various well-being and interper-
However, to the author's knowledge, beyond conspiracy theories, no            sonal factors in isolation, this study took an exploratory approach to
one has explicitly tested whether need to belong is associated with           understand the combination of psychological factors which best
4 RAUWOLF
predict accuracy. The aforementioned, extant literature has consid- 1.4 | Summary
ered whether specific aspects of well-being and interpersonal factors
affect truth assessment. However, to the author's knowledge, no one The goal of this work was two-fold. First, it sought to explore whether
has considered (a) which parts of well-being and interpersonal factors various under-considered interpersonal and well-being factors were
are most important in predicting biases in truth assessment, and associated with biases in judging the accuracy of political news state-
(b) how the effects of interpersonal and well-being factors relate. ments. To do this, I analyzed whether each interpersonal and well-
Since many of the aforementioned factors covary, it is vital to under- being factor was correlated with accuracy in judging the veracity of
stand which factors predict accuracy above and beyond other factors. true and false political statements which were found on fact-checking
Doing so can help us better understand the most important arche- websites in the lead up to the 2020 U.S. presidential election. While I
types of factors associated with vulnerability to biased beliefs. If inter- have argued why the various well-being and interpersonal measures
personal factors, hedonic well-being, and eudaimonic well-being may be associated with biased truth assessments, this work was still
continued to explain variance in truth assessments, even when con- exploratory. As such, since several variables were considered, and
trolling for each other, then this would provide evidence that all three since this could inflate the risk of false positives, the present work
aspects are important. If, however, interpersonal measures and took a conservative approach to analysis. All correlations were
eudaimonic well-being did not predict accuracy after controlling for Bonferroni corrected.
hedonic well-being, then this would provide evidence that eudaimonic The second aim of this study was to better understand the combi-
well-being and interpersonal factors are not useful in predicting biases nation of factors which best predict accuracy. Since many of the fac-
in truth assessment beyond their relationship with hedonic well- tors covary, the aim was to find out which factors continued to
being. explain more variance, even when controlling for other factors. To do
With the intent to uncover the strongest predictors of covarying this, and to reduce the risk of overfitting, out-of-sample validation
well-being and interpersonal measures, two other measurements were (i.e., cross validation) was used.
added to the study: (a) political ideology, and (b) age. There is a large
body of work demonstrating that conservative beliefs are associated
with a tendency to believe more false information (Garrett & 2 | METHOD
Bond, 2022; Pennycook & Rand, 2019, 2021). However, conservatism
is also associated with well-being. Conservatives tend to score higher Three days prior to the 2020 U.S. presidential election, 500 partici-
in self-reported measures of happiness (Wojcik et al., 2015) and also pants from the United States completed an online survey using Ama-
emotionally react more strongly when faced with negative events zon Mechanical Turk (MTurk). They were asked to judge the veracity
(Joel et al., 2014). Since well-being and conservatism covary, a mea- of true and false political statements. They also completed question-
sure of conservatism was added to assess whether either measure naires assessing various aspects of their (a) mental well-being,
continued to predict truth assessment after controlling for the other. (b) interpersonal factors, and (c) partisan/political beliefs. The goal was
Similarly, age has been associated with coming in contact with and to assess whether mental well-being, interpersonal factors, and politi-
sharing false information (Brashier & Schacter, 2020; Grinberg cal ideology were associated with accuracy when judging the veracity
et al., 2019), but age is also correlated with various aspects of mental of political statements.
well-being (Ryff et al., 2021). As such, age was included in the analysis Ethics for this study was approved by Bangor University (Study
to assess whether well-being and age continued to predict truth ID: 2020-16814). An a priori power analysis showed that a sample
assessment after controlling for each other. size of 462 had 90% power to detect small-medium correlation
Importantly, while it is valuable to consider how various factors effects (r = .15). As such, a sample size of 500 was used.
combine to predict vulnerability to biases in judging the veracity of
political information, analyzing models with multiple variables can be
prone to overfitting, reducing the likelihood of replicability (Yarkoni & 2.1 | Transparency and openness
Westfall, 2017). To navigate these concerns, the “best subset selec-
tion” algorithm was used to understand how the shared (and All data and research materials are available at https://osf.io/3rxv5/?
unshared) variance between various factors combined to best predict view_only=cfd69f3e9e1a48deb699c2658c27f8af.
accuracy rates. Best subset selection finds the best multiple regres-
sion model while reducing the risks of overfitting by using cross-
mez & Prokopyev, 2021; Hastie et al., 2001; James
validation (Go 2.2 | Participants
et al., 2013). Several combinations of factors were evaluated on their
ability to predict out-of-sample data (via 10-fold cross validation). Participants were only allowed to participate if their MTurk approval
Interpersonal, well-being, and political factors were considered in tan- rating was above 95%, since such individuals have been shown to
dem. The goal was to understand which combination of factors best have better attention rates than university students (Hauser &
predicted accuracy in assessing true and false political statements Schwarz, 2016). Participants were paid $2 to complete a 15-min ques-
whilst reducing the likelihood of overfitting (details described below). tionnaire. Since many of the measures depended on comparingRAUWOLF 5
congruent and incongruent party affiliations, 20 participants were description of each question. The questions varied in difficulty, but
excluded because they did not have a preference on who won the none were extremely easy or difficult; the question with the highest
election. A further three participants were excluded because they (lowest) accuracy rate was 81.3% (19.5%)—see SI A for details.
failed an attention check (“To monitor quality, please reply ‘Neither
agree nor disagree’ to this question” [Brawley & Pury, 2016]). Prior to
starting, participants acknowledged that they understood that they 2.3.2 | Demographics
could withdraw at any time.
The final dataset included 477 participants (mean age: 38.78, SD: Participants were given the option to denote their age and gender
11.33). The distribution of gender identity was non-binary (2), female identity.
(188), male (282), other non-specified (1), and preferred not to say (4).
232 of the participants supported Biden, and 245 supported Trump.
2.3.3 | Well-being
2.3 | Materials Participants were asked to complete various measures of mental well-
being.
2.3.1 | Judging the veracity of political statements
Depressive symptoms
Historically, when participants are asked to judge the veracity of polit- Depressive symptoms over the last 14 days were measured using
ical statements, protocols have varied slightly. In most studies, partici- the 16-item quick inventory of depressive symptomology—QIDS
pants are shown a series of true and false political statements, the (Rush et al., 2003). The measure asks several multiple-choice ques-
veracity of which have been externally verified (e.g., through fact- tions about an individual's experience with depressive symptoms
checking sites). Participants are asked to judge whether each statement over the last 7 days (e.g., how well have you slept, been able to
is true or false. However, protocols vary on how participants are asked concentrate, been able to eat, …). A meta-analysis of QIDS found it
to make these judgments. Some protocols only ask whether each state- has good concurrent validity with many other measures of depres-
ment is true or false with a binary option (Bago et al., 2020; Sindermann sive symptoms as well as high internal consistency (Reilly
et al., 2021). Others use Likert scales where participants denote how true et al., 2015). In this study, QIDS showed good internal consis-
they believe the statement to be (e.g. 1—not at all accurate, 2—not very tency (α = .875).
accurate, 3—somewhat accurate, and 4—very accurate) (Bronstein
et al., 2019; Martel et al., 2020; Pennycook & Rand, 2019). Other proto- Affect over the last 7 days
cols ask participants to guess the veracity of the statement while simulta- Negative and positive affect over the last 7 days were measured using
neously noting the certainty of their decision (e.g. 1—definitely false, 2— the 20-item Positive and Negative Affect Schedule—PANAS (Watson
probably false, 3—probably true, and 4—definitely true) (Tappin et al., 1988). The participant answered how often they have felt
et al., 2020; Weeks, 2015). In this study, participants were told that the 10 positive and 10 negative emotions over the last 7 days
statements had been externally verified as true or false; as such it (e.g., distressed, upset, excited, proud…). For each emotion, the partic-
seemed less necessary to ask participants to denote a gradation of accu- ipant responded on a 5-point Likert scale (very slightly or not at all—
racy. So, participants were asked to denote their subjective certainty in extremely). PANAS has high congruent validity for measuring two fac-
the judgments as per Tappin et al. (2020). However, since the main tors: negative affect (NA) describes the amount of unpleasurable
hypotheses of this work focused on accuracy of judging the veracity of engagement with the environment, while positive affect
statements, the certainty dimension was not analyzed. (PA) describes the amount of pleasurable engagement with the envi-
In this study, participants were asked to rate the veracity of ronment (Crawford & Henry, 2004). While both PANAS NA and PA
28 political statements found on fact-checking websites. They were tend to correlate to depressive symptoms, there is still divergent valid-
told that the statements had been labeled true or false by fact- ity (Crawford & Henry, 2004; Vera-Villarroel et al., 2017; Watson
checking sites. As per Tappin et al. (2020), each participant rated their et al., 1988). In this study, negative affect (PANAS NA) had good inter-
belief in the veracity of each statement on a 100-point scale (0— nal consistency (α = .883), while positive affect (PANAS PA) had
certainly false; 50—unsure; 100—certainly true). For false (true) state- excellent internal consistency (α = .908).
ments, an answer was considered correct if the participant answered
less than (greater than) 50 (Weeks, 2015). Momentary affect
Half the statements were true. As per much of the recent work Given that (a) transient, experimentally manipulated emotions have
on assessing vulnerability to misinformation, for each of the 14 true been shown to bias truth assessment (Weeks, 2015), and (b) well-
and 14 false statements, half were selected with the intention that being is often delineated along the continuum of state and trait affect
they would support partisan beliefs of Biden supporters, the other (Tov, 2018), this study considered the effects of several momentary
half were biased toward Trump supporters (Pennycook & Rand, 2019; measures of affect. This was juxtaposed to PANAS which measured
Tappin et al., 2020). See Supplemental Information (SI) A for a the amount one felt emotions over the last 7 days. The momentary6 RAUWOLF
affective measures included four questions, and asked how (a) happy, Need to belong
(b) excited, (c) depressed, and (d) anxious the participant felt “right One's need to belong was assessed using a validated, one-item ques-
now” (scale: 100 to 100 with extreme labels such as “extremely tion (Nichols & Webster, 2013). Participants used a 7-point Likert
unhappy” and “extremely happy”). scale (strongly disagree–strongly agree) to denote how much they
agreed with the statement, “I have a strong need to belong.” The
Eudaimonic well-being measure has been found to have good concurrent validity, construct
Eudaimonic well-being represents the ability to pursue our potential validity, and test–retest reliability (Nichols & Webster, 2013).
and is often separated from measures of hedonic/subjective well-being
(Ryff et al., 2021). Eudaimonic well-being was assessed using the Generosity and in-group bias
18-item questionnaire of Psychological Well-being (Ryff & Since generosity has been linked to a general trusting nature
Keyes, 1995). For each question, the participant denoted how much (Bekkers, 2007; Chaudhuri & Gangadharan, 2007), it was hypothe-
they agreed with a statement on a 7-point Likert scale (strongly sized that generosity might be associated with a tendency to believe
disagree–strongly agree). The measure includes questions about one's most political statements. Further, it was hypothesized that the ten-
subjective feelings of autonomy (the ability to act independently and dency to give preferential treatment to ingroup members might be
resist social pressures), environmental mastery (the extent to which one associated with a willingness to believe political congruent informa-
feels in control of one's environment), personal growth (one's sense of tion. The Dictator game (Engel, 2011) has been used to measure both
growth and self-improvement), positive relations (has positive and generosity and in-group bias in political settings (Fowler & Kam, 2007;
trusting relations with others), purpose in life (sense that life has mean- Rand et al., 2009; Whitt et al., 2021). This study used an incentive-
ing), and self-acceptance (positive attitude about the self) (Ryff & compatible version of the Dictator game to measure both generosity
Keyes, 1995). The measure has been shown to have divergent validity and in-group preference. Participants were told that if they completed
with hedonic/subjective measures of well-being (Keyes et al., 2002). a post-election survey, they would be entered into a raffle to win
The six-factor loading of the 18-item version has shown poor internal $100 and play a Dictator game with another randomly selected partic-
consistency (van Dierendonck, 2004). In such cases a single-factor is ipant. They were then told that if they won the lottery a random
recommended (Ryff & Keyes, 1995; van Dierendonck, 2004). This study recipient would be selected, and they could give any amount of the
used the single-factor model of eudaimonic well-being since poor inter- $100 to that recipient. Participants were asked how much they would
nal consistency was found for the six-factor model. The one factor give an individual if the recipient (a) voted for the participant's pre-
model demonstrated good internal consistency (α = .854). ferred candidate, (b) voted for the other main party, (c) voted for a
third-party candidate, (d) did not vote, or (e) did not divulge who they
Momentary optimism voted for. Generosity was measured as the average amount given to
Optimism is an aspect of well-being which does not fall cleanly within all five options. In-group bias was measured as the amount the winner
either hedonic or eudemonic well-being; however recent work has would give to a recipient who shared their candidate minus the
shown that it falls more in line with hedonic well-being (Gallagher & amount given to a recipient who voted for the other main candidate
Lopez, 2009). Given this, an “in-the-moment” assessment of optimism (Rand et al., 2009). Of the 338 participants who completed the post-
was included. Participants were asked how optimistic they were about election survey, a random dictator and a random recipient were
the future right now ( 100: extremely pessimistic and 100: extremely selected. The voting behavior of the recipient was considered against
optimistic). the dictator's pre-election decisions, and the recipient was given part
of the $100 based on the dictator's desire. The dictator received the
Self-esteem rest of the money.
Given that low self-esteem is associated with information avoidance
(Howell & Shepperd, 2016; Wiersema et al., 2012), it was hypothe- Homogeneity of social networks
sized that low self-esteem could be associated with biases in truth Political homophily was measured by asking participants the per-
assessment. A one-item measure of self-esteem was included (Robins centage of their friends who were aligned with various political
et al., 2001). Participants responded to the statement “I have high parties. Participants answered the question: “What percentage of
self-esteem” on a 7-point Likert scale (strongly disagree–strongly your friends are (a) Republican, (b) Democrat, (c) Moderate, and
agree). The measure has been shown to have strong convergent valid- (d) Other.” Answers to the four questions had to sum to 100. Since
ity with longer measures of self-esteem (Robins et al., 2001). it was hypothesized that biased truth assessment would be associ-
ated with political homophily, during the analysis I considered the
percentage of friendships which shared the participant's political
2.3.4 | Interpersonal factors ideology.
To analyze whether interpersonal factors were associated with the Threats of ostracism
ability to judge the veracity of political statements, several interper- It was hypothesized that a participant would be more willing to
sonal factors were considered. believe positive statements about a friend's candidate, if theRAUWOLF 7
participant felt that the friendship would be impacted by the result of participants completed the Dictator game and were told they would
the election. To explore this, a novel series of questions was invented. be paid within 24 h.
Participants answered four questions about how the election result
would impact their friendships. They were asked to predict how much
it would affect their friendships ( 100: extremely negatively; 100: 2.5 | Design
extremely positively) with those who did or did not share their candi-
date if the individual's preferred candidate won or lost. A question Basic Pearson correlations were run to test whether accuracy in
was asked for every combination of whether the friend supported a judging the veracity of political statements was associated with
congruent (congruent vs. incongruent) presidential candidate com- interpersonal factors, well-being, and political ideology. Four differ-
pared to the participant, and whether the participant's preferred can- ent calculations of accuracy were considered. Each participant's
didate won (won vs. lost). accuracy was assessed on (a) all 28 statements, (b) the false state-
ments, (c) the true statements, and (d) discernment. As per Batailler
et al. (2021), discernment was calculated as the z-score of the frac-
2.3.5 | Political beliefs tion of true items rated as true, minus the z-score of the false items
rated as true.
Individual differences in political and partisan beliefs were assessed In order to take a precautionary approach to analysis, and to reduce
with several questions. Participants were asked who they hoped the risk of false positives (i.e., Type I errors), all p-values were Bonferroni
would win the presidential election (Biden, Trump, Other, and I'm corrected (Holm, 1979). Since there were 22 different individual mea-
undecided). Participants rated their social and economic conservatism surements, each p-value was multiplied by 22. In terms of the assump-
on a 7-point Likert scale (1: extremely liberal; 7: extremely conserva- tions of Pearson correlations, it has been shown that the present sample
tive). Participants then described the importance of this presidential size (N = 477) is likely large enough that the assumption of normality is
election compared to other presidential elections ( 100: way less met due to the Central Limit Theorem (Lumley et al., 2002). However, as
important; 100: way more important). an extra precaution, 95% bootstrapped confidence intervals were calcu-
lated, as bootstrapped confidence intervals do not assume normality
(Wright et al., 2011). While the relationships between the variables were
2.3.6 | Other measures broadly linear (graphs discussed below), to verify that small failures in the
assumptions of linearity and outliers were not skewing the results, a
A few other measures were taken, but not considered in the analy- non-parametric Spearman correlation was run for each comparison.
sis. After judging the veracity of the 28 political statements, partici- Spearman correlations have been shown to be more robust to outliers
pants were asked to guess their accuracy rate (0–100%) and the (Bishara & Hittner, 2014). Further, while the relationships between the
percentage of participants who scored worse than they did (0– variables were broadly linear, Spearman correlations only assume a
100%). Participants also predicted how they would feel 2 weeks monotonic relationship, and, as discussed below, the comparisons had
after the election if either Trump or Biden won. Finally, participants broadly monotonic relationships.
were asked how likely they thought it was that Trump would win While it is important to consider each of the measures in isola-
the election. tion, it is also vital to understand how the factors relate and to under-
stand which combination of factors best predict truth assessment of
political headlines. The best subset selection algorithm was used to
2.4 | Procedure analyze the combination of factors which predict accuracy in judging
the veracity of political statements. Best subset selection finds the
Five hundred participants completed the online questionnaire. Prior best multiple regression model while reducing the risks of overfitting
to starting, participants completed a consent form and acknowledged mez & Prokopyev, 2021; Hastie
by using cross-validation (Go
that they understood that they could withdraw at any time. Upon et al., 2001; James et al., 2013). A detailed description of best subset
agreeing to proceed, participants answered the demographic ques- selection is given below.
tions. Next, they completed several measures of well-being and inter-
personal factors (in order: in-the-moment affect, QIDS, psychological
well-being, need to belong, and PANAS). Then, they answered several 3 | RE SU LT S
questions about their political beliefs (social and economic conserva-
tism, percentage of friends who support each candidate, and impor- Table 1 shows the results of the Pearson correlations. A Pearson cor-
tance of the election). Participants then guessed the veracity of relation was run for each individual measurement and four different
28 political statements. Next, participants were asked to predict how measures of accuracy: (a) Overall (fraction correct for all 28 state-
well they did, and to predict how they would feel if Trump or Biden ments), (b) All False (fraction of the 14 false statements correctly diag-
won the election. Participants then described how their friendships nosed as false), (c) All True (fraction of the 14 true statements
would be affected if Trump or Biden won the election. Finally, the correctly diagnosed as true), and (d) Discernment (z-scored fraction of8 RAUWOLF
TABLE 1 Pearson correlations between individual factors and accuracy in judging the veracity of political information.
Accuracy
Factors Overall All false All true Discernment
Mental health QIDS depressive symptoms .03 .39*** .37*** .02
State affect (7 days) PANAS Negative Affect (7 days) .03 .56*** .55*** .01
PANAS Positive Affect (7 days) .00 .28*** .29*** .01
Momentary affect Happy .03 .30*** .28*** .02
Excited .04 .45*** .42*** .03
Depressed .01 .32*** .32*** .00
Anxious .06 .41*** .37*** .05
Eudaimonic Ryff's Psychological well-being .00 .41*** .42*** .01
Other well-being Optimistic for future .01 .24*** .23*** .01
Self esteem .01 .04 .03 .01
Political beliefs Economic conservatism .05 .30*** .27*** .04
Social conservatism .05 .42*** .39*** .04
Election importance .03 .12 .10 .03
Interpersonal Generosity .03 .59*** .58*** .01
Ingroup bias .02 .00 .00 .02
% Congruent friends .03 .13 .15* .03
Impact to congruent friend; you win .03 .22*** .25*** .03
Impact to incongruent friend; you win .00 .41*** .42*** .01
Impact to congruent friend; you lose .03 .44*** .43*** .02
Impact to incongruent friend; you lose .07 .51*** .47*** .05
Need to belong .02 .24*** .22*** .01
Demographics Age .09 .19*** .12 .09
Note: Four measures of accuracy are presented. They represent the accuracy rate for: (a) all 28 news items (overall), (b) the 14 false statements (all false),
(c) the 14 true statements (all true), and (d) the z-scored fraction of true statements rated as true minus the z-scored fraction of false statements rated as
true (i.e., discernment). Each cell represents the correlation coefficient from the Pearson correlation followed by stars if the Bonferroni corrected p-value
was significant. Categories of significance were signified with stars. *p < .05; **p < .01; and ***p < .001.
true statements rated as true minus the z-scored fraction of false bootstrapped confidence intervals and Spearman correlations were
statements rated as true). aligned with the results from the Pearson correlations. At no point
Before discussing the specific results, there are a couple of gen- was one calculation significant, while the other was not. Further, the
eral trends worth noting. First, few of the factors were significantly correlation coefficients (i.e., the effect sizes) between the Pearson and
associated with total accuracy of all 28 statements. However, this was Spearman correlations only slightly varied. This suggests that any sub-
because the relationship between individual factors and accuracy for tle violations in the assumptions of the Pearson correlations were not
true statements was orthogonal compared to the relationship enough to dramatically skew the results. As such, the discussion of
between individual factors and accuracy for false statements. This the analysis focuses on the Pearson correlations.
meant the effect averaged out when considering all items (see below).
Second, given the large sample size, even after Bonferroni corrections,
many correlations were highly significant, so the results 3.1 | Interpersonal measures
section focuses on effect sizes. Third, many of the individual factors
were correlated to various degrees. Supplemental Information (SI) B Interpersonal factors had some of the largest associations with accu-
depicts the correlation matrix of the individual factors; pertinent racy in judging political statements. In general, if an individual was
aspects are discussed throughout the results. prosocial or the election dramatically affected their friendships, then
Lastly, given space constraints, bootstrapped 95% confidence they were more likely to be vulnerable to believing false information.
intervals for the Pearson correlation coefficients are included in Sup- Generosity in the dictator game was largely, positively correlated with
plemental Information C (see Table C1). Additionally, the Spearman individual accuracy for true statements (r = .58), but highly negatively
correlations and bootstrapped confidence intervals are also found in correlated with individual accuracy for false (r = .59) statements (p-
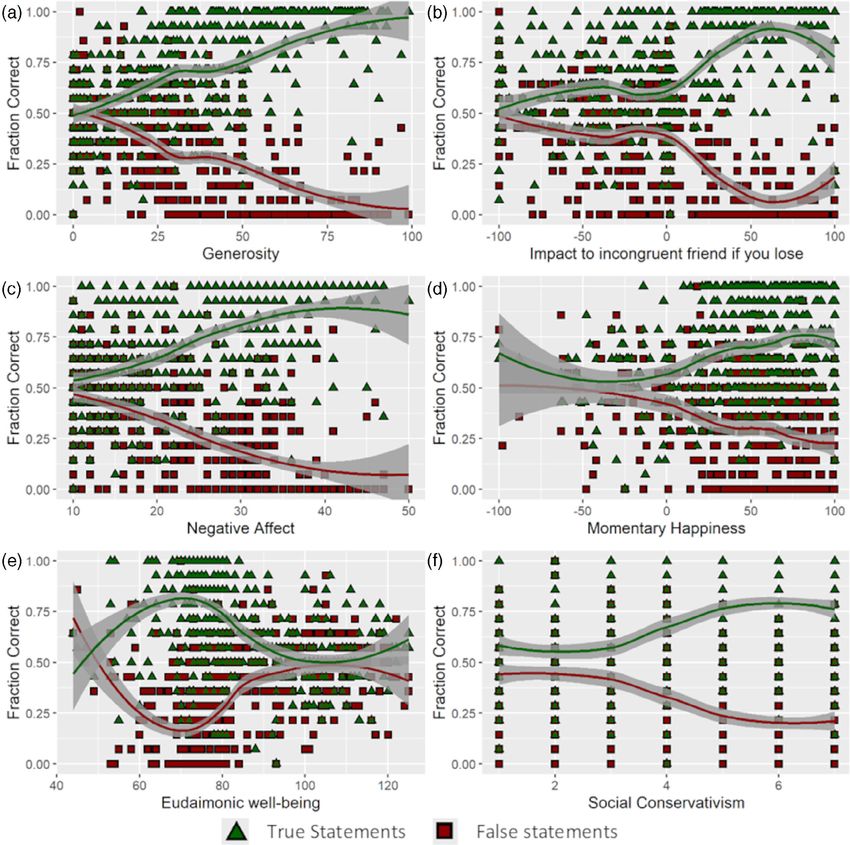
Supplemental Information C (see Tables C2 and C3, respectively). The values are shown in Table 1 and bootstrapped 95% confidenceRAUWOLF 9 F I G U R E 1 Each graph depicts the association between an individual factor (x-axis) and the fraction of news articles answered correctly (y-axis). Each graph illustrates how accuracy for the 14 true statements (green triangles) and the 14 false statements (red squares) was associated with an individual factor. Each curve represents the best locally estimated scatterplot smoothing (LOESS) curve. Shaded areas represent 95% confidence bands. (a) Generosity measured as the average amount given in the Dictator game. (b) The impact to a friendship if the friend supports the opposing candidate, and the participant's candidate loses ( 100: extremely negative; 100: extremely positive). (c) negative affect over the last 7 days; larger values represent increased negative affect. (d) In-the-moment happiness ( 100: extremely unhappy; 100 extremely happy). (e) Eudaimonic wellbeing (larger values represent a sense of autonomy and that life has meaning). (f) Social conservatism (1: extremely liberal; 7: extremely conservative). intervals for all correlations can be found in Table C1 of Supplemental Figure 1a, if an individual is not generous (i.e., does not give money Information C). Of all the factors considered in this work, generosity in a Dictator game), then the best smoothed fit curve predicts that represents the largest effect. Figure 1a illustrates this. Those who are the individual will attain an accuracy rate of 50%. This means that, generous to others are more likely to be accurate for true statements, if one gives no money, then generosity offers no information about but inaccurate for false headlines. This is because generous individ- an individual's ability to assess the veracity of news; the average uals predicted most of the statements to be true. Looking at performance of ungenerous individuals is 50%. However, as
10                                                                                                                                                RAUWOLF

generosity increases, it is clear that assessment of the veracity of          (“moderate”) negative affect over the last 7 days, then, on average,
headlines is biased. Further, considering Figure 1a, the effect of            they answered 65% (81%) of the true statements correctly and 35%
generosity is clear even for those who are only a little generous.            (18%) of the false statements correctly.
Those who, on average, offered 25% (50%) of their potential win-                    Similarly, depressive symptoms over the last 14 days were associ-
nings to others, scored 66% (75%) for true statements, but only               ated with higher accuracy for true statements (r = .37) but lower
35% (25%) for false statements.                                               accuracy for false statements (r =         .39). Further, momentary mea-
       Those who felt that their friendships were vulnerable enough to        surements of anxiety and depression were associated with higher
be impacted by the election, were more vulnerable to false informa-           accuracy for true statements (r = .37, r = .32, respectively) and lower
tion. If an individual thought that their candidate losing the election       accuracy for false statements (r =      .41, r =     .32, respectively). See SI
would improve their friendships with those supporting the other main          C for visualizations.
candidate (i.e., incongruent friendship), then they were more likely to
believe that most statements were true. Consequently, they scored
higher for true statements (r = .47), but lower for false statements          3.3      |    Positive affect
(r =     .51). Figure 1b illustrates the effect; this was the third largest
effect for all the correlations. Slightly smaller but similar effects were    There is evidence that positive affect is not the inverse of negative
found if (a) incongruent friendships would be improved if the partici-        affect (Schmukle et al., 2002). This was the case here, as PANAS nega-
pant's candidate won (true: r = .42; false: r =     .41), or (b) congruent    tive affect was not correlated to PANAS positive affect (r = .02) or
friendships would be improved if the participant's candidate lost (true:      momentary happiness (r =          .05)—see SI B. Somewhat surprisingly,
r = .43; false: r =    .44). Only small-moderate effects were found for       the effects of positive affect were in the same direction as negative
the impact on congruent friendships if the participant's candidate won        affect, although the effects were smaller. Positive affect over the last
(true: r = .25; false: r = .22).                                              7 days was associated with higher accuracy for true statements
       Need to belong had a small-moderate association with assessing         (r = .29) and lower accuracy for false statements (r =            .28). In-the-
the veracity of headlines. An increased need to belong was associated         moment measures of happiness showed similar associations (true:
with a general inclination to believe statements were true, leading to        r = .28; false r =   .30). Figure 1d illustrates this; other than a few out-
better accuracy for true statements (r = .22), but worse performance          liers who were deeply unhappy, unhappiness was not particularly pre-
for false statements (r =     .24). Homogeneity of social networks (mea-      dictive of accuracy for true or false statements. However, as
sured as the percentage of friends who shared one's political align-          happiness increased, the individual was more willing to believe both
ment) weakly predicted lower accuracy for true statements (r =        .15),   true and false statements.
but, after Bonferroni correction, it was not significantly related to               The fact that both negative and positive affect predict biased
higher accuracy for false statements (r = .13). Lastly, the difference in     beliefs in the same direction is corroborated by the work of Martel
generosity between congruent and incongruent recipients (a measure            et al. (2020), suggesting that heightened emotions bias truth assess-
of in-group bias), had little association with accuracy rates (see            ment. This narrative might explain the moderate-large effect of
Table 1). Scatter plots of every factor considered in this work can be        momentary excitement. Those with higher levels of excitement, were
found in SI C.                                                                more accurate when analyzing true statements (r = .42), but less accu-
                                                                              rate when analyzing false statements (r =          .45). Excitement, however,
                                                                              is not necessarily an unambiguously “positive” emotion, as it was posi-
3.2      |    Negative affect and mental-health factors                       tively correlated to both negative (r = .33) and positive (r = .53) affect
                                                                              (see SI B).
In general, poor mental well-being was associated with believing both
true and false information, and thus poor mental well-being was asso-
ciated with a vulnerability to misinformation (i.e., false information).      3.4      |    Eudaimonic well-being
Negative affect over the last 7 days (as measured by PANAS) was
associated with higher accuracy for true statements (r = .55), but            Similar to the results found with negative affect, those with lower
lower accuracy for false statements (r =     .56). These were the second      levels of eudaimonic well-being were consistently more accurate in
largest effect sizes; second only to the interpersonal factor, generos-       diagnosing true statements, but less accurate in diagnosing false state-
ity. Figure 1c illustrates that the bias in accuracy was driven by those      ments (true: r =     .42; false: r = .41). Figure 1e illustrates the effect of
struggling with negative affect. The average score of those with low          eudaimonic well-being. Those with a high sense of eudaimonic well-
levels of negative affect was approximately 50% for both true and             being (i.e., those who felt autonomous and positive about life)
false statements. However, increased negative affect was associated           averaged a score of approximately 50%. However (other than a few
with a willingness to believe most statements. The effect was quite           outlying participants who had very low scores) lower scores were
large even for those who were only feeling small to moderate                  associated with biases in accuracy. Of note, Figure 1e shows that
amounts of negative affect. Considering Figure 1c, a measure of               eudemonic well-being might be the only comparison which does not
20 (30) meant that, on average, if an individual felt “a little”              show a monotonic relationship with accuracy. While it seems there
RAUWOLF 11
are only a few outliers with low eudaimonic well-being who are caus- incongruent, (c) false congruent, and (d) false incongruent. This meant
ing the relationship to appear parabolic (i.e., the relationship is mono- that, for each information type, different questions were being consid-
tonic when eudaimonic well-being is greater than 65), these might ered for Trump compared to Biden supporters. For example, the false
skew the results of the Spearman and Pearson correlations. statement “Trump claimed that, prior to the pandemic, the Trump
administration was reducing the national debt. Was Trump's state-
ment true?,” would be considered false, congruent for Trump sup-
3.5 | Other well-being porters, but false, incongruent for Biden supporters.
On average, individuals showed a large (and statistically signifi-
There were moderate-small effects of one's optimism for the future cant: p < .001) partisan bias. Individuals were much more likely to
(true: r = .24; false: r = .23). There was no significant effect of self- believe false statements that supported their ideology and thus scored
esteem on the accuracy of judging the veracity of political statements poorly (20.2%) compared to the average accuracy rate of false, incon-
(see Table 1). gruent statements (41.8%). Individuals were also much more likely to
believe true statements that supported their ideology (78.0%) com-
pared to those supporting the other party (59.3%). See Figure D1 for
3.6 | Political beliefs and demographics more details.
Partisan bias for false (true) statements was measured by sub-
Biased assessment was associated with both higher social (true: tracting individual accuracy rates for false (true) incongruent state-
r = .39; false: r = .42) and economic (true: r = .27; false: r = .30) ments from false (true) congruent statements. If individuals tended to
conservatism. Figure 1f illustrates that social liberalism is not very pre- believe statements that were congruent with their beliefs, then, for
dictive of accuracy rates. However, those with high levels of social false (true) statements, they would receive lower (higher) accuracy
conservatism tend to believe most statements, leading to high accu- rates for congruent compared to incongruent statements. Thus, for
racy for true statements, but low accuracy for false statements. The false (true) statements, a partisan bias would be represented as a neg-
effect of the importance of the election was not significant. The ative (positive) value.
effects of age were relatively small (see Table 1 and SI C for Since generosity, high negative affect and poor eudaimonic well-
visualizations). being were all associated with believing most statements, these indi-
viduals, on average, did not display much of a partisan bias. Interest-
ingly, however, those on the other end of the spectrum (low
3.7 | Discernment generosity, low negative affect and high eudaimonic well-being) dis-
played a large partisan bias. Figure 2 illustrates this. A Pearson correla-
The term “discernment” is used in signal theory to describe the differ- tion showed that as generosity increased, partisan bias decreased for
ence between the z-scored fraction of instances where an individual both true (r = .38, p < .001) and false statements (r = .35, p < .001).
thought true headlines were true minus the z-scored fraction of The same was found for negative affect (true: r = .39, p < .001;
instances where an individual thought false headlines were true false: r = .37, p < .001) and eudaimonic well-being (true: r = .36,
(Pennycook & Rand, 2021). Table 1 denotes the relationship between p < .001; false: r = .30, p < .001). Further, a weaker effect was found
discernment and each factor. In general, few of the factors were asso- for in-the-moment happiness (true: r = .20, p < .001; false: r = .26,
ciated with discernment (see Table 1). p < .001). As negative affect decreased and eudaimonic well-being
increased, individuals tended to display a larger partisan bias (see SI D
for a complete statistical analysis of each of the individual factors,
3.8 | Partisan bias including Pearson correlations, Spearman correlations, and
bootstrapped confidence intervals).
Until now, the analysis has focused on all true or false statements, Until now, the analyses showed that those with low generosity,
even though half of the statements were aligned with liberal ideology low negative affect, and high eudaimonic well-being were unbiased in
and half with conservative ideology. There is robust evidence that how they assessed headlines. However, they actually displayed a par-
individuals are more likely to believe information that supports their tisan bias which averaged out to 50% accuracy across all true (and
partisan beliefs (Anthony & Moulding, 2019; Bago et al., 2020; false) statements. Those with high generosity, high negative affect,
Pennycook & Rand, 2021; Vegetti & Mancosu, 2020). However, little and low eudaimonic well-being showed little partisan bias, as these
is known about how well-being and interpersonal factors interact with individuals were more likely to believe all headlines, regardless of their
partisan biases when assessing political information. To consider the partisan ideology.
effects of individual differences on partisan biases, the true and false These results hold for almost every factor measured in this work
statements were separated into four groups based on participant's (see SI D). If one extreme of the measure was associated with a bias
preferred candidate: (a) true statements which were congruent with to believe most headlines, the other extreme was associated with a
the partisan beliefs of the participant, (b) true statements which were partisan bias. This demonstrates that well-being and interpersonalYou can also read


