MCCLAIN TORCH FUND P2 2022 Report - Haslam College of Business
←
→
Page content transcription
If your browser does not render page correctly, please read the page content below

MCCLAIN TORCH FUND
          P2 2022 Report

    January 1, 2022 – March 31, 2022
Dear Mr. and Mrs. McClain,

The members of the McClain Torch Fund are sincerely appreciative of your donation. Your
generosity to the Torch Fund has allowed past, present, and future students the opportunity to get
real portfolio management experience before graduating college. The skills acquired such as
valuation techniques and professional communication are not only applicable to investment
management but many other finance and business roles as well. Students often describe this
program as the best educational experience in their college career and we are so grateful for this
experience.
P2 was active with many transactions. On February 11th, we purchased 32 shares of ULTA for
$360/share. The members of the fund decided that its diversity amongst beauty products, lack of
true competitors, and vast scale around the United States give them a sustainable competitive
advantage. On February 28th, the fund decided to sell 49 shares of FB for $208/share. We decided
that too much of their future revenue drivers rely on the potential success or failure of the
Metaverse. Consequently, we decided that this uncertainty shows FB lacks an economic moat, and
thus needed to be sold. On March 11th the fund made two important sales. We sold 134 shares of
ECPG for $63/share based on executives dumping shares and the decision to lock in gains on a top
performer. Also on March 11th, we sold 186 shares of NEM for $76/share due to favorable
commodity pricing and market uncertainty which we thought may not persist in the long run. Since
NEM’s price is highly correlated to gold prices, we liquidated our position. On March 14th, we
decided to liquidate half or 22 shares of LMT for $447/share. The fund decided to lock in profits
based on the momentum created by the war in Ukraine. However, the fund maintains a position to
take part in future upside. Lastly, on March 25th, the fund decided to sell off its IAC position. IAC’s
core business relies on acquiring companies, turning them around, and spinning them off. After
careful re-evaluation of IAC’s portfolio of subsidiaries, the fund decided that none of the companies
had the potential for large-scale growth and thus the position needed to be sold off. The sales
during the period increased the fund’s cash balance allowing for future opportunistic purchases.
Recent market volatility and heightened uncertainty offered a great educational experience for the
members of the McClain Fund. This period was many of the fund managers’ first experience
investing in a period of rising interest rates. Although we underperformed our benchmark RAV, we
believe that the learning experience acquired from volatility in the capital markets will forever be
valuable in our investing careers going forward. The McClain Fund is thankful for your donation,
commitment to education, and this opportunity to get hands-on exposure to investment
management. We aspire to show you our gratitude through our effort, research, diligence, and
investment decisions.

Sincerely,
The McClain Fund

Account Summary: P2 2022

Portfolio Value as of 12-31-2021            $ 411,381.74
Contributions                                    -
Withdrawals                                      -
Realized Gains                               (3,726.70)
Unrealized Gains                            (20,796.43)
Interest                                        0.49
Dividends                                     1,512.85
Portfolio Value as of 3-31-2022             $ 388,371.96

                       In Comparison:
                 Account Summary: P1 2022

Portfolio Value as of 9-30-2021             $ 397,134.33

Contributions                                    -
Withdrawals                                      -
Realized Gains                                2,202.09
Unrealized Gains                             11,009.65
Interest                                        0.28
Dividends                                     1,035.39
Portfolio Value as of 12-31-2021            $ 411,381.74

Performance Summary

Portfolio Appraisal
McClain Torch Fund
3/31/2022
Quantity Security Ticker Unit Cost Price Market Value Percent Assets
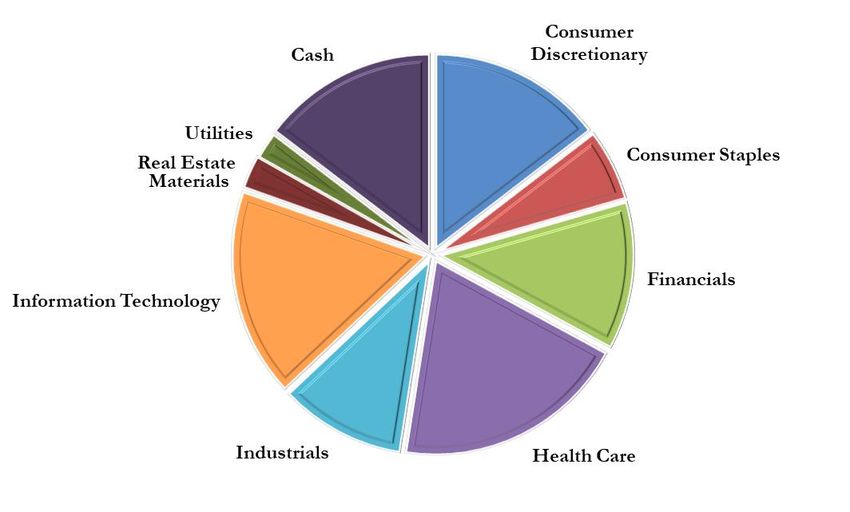
COMMON STOCK
Communication Services
5.5 Alphabet, Inc. - Class A GOOGL $1,696.09 $2,781.35 $15,297.43 3.94%
80 Electronic Arts, Inc. EA $104.34 $126.51 $10,120.80 2.61%
75 Match Group, Inc. MTCH $56.33 $108.74 $8,155.50 2.10%
$33,573.73 8.64%
Consumer Discretionary
5 Amazon.com, Inc. AMZN $3,352.40 $3,259.95 $16,299.75 4.20%
131 D.R. Horton, Inc. DHI $81.77 $74.51 $9,760.81 2.51%
860 Smith & Wesson Brands, Inc. SWBI $16.49 $15.13 $13,011.80 3.35%
32 Ulta Beauty, Inc. ULTA $360.00 $398.22 $12,743.04 3.28%
$51,815.40 13.34%
Consumer Staples
208 Altria Group, Inc. MO $48.40 $52.25 $10,868.00 2.80%
83 Kimberly Clark Corporation KMB $133.91 $123.16 $10,222.28 2.63%
$21,090.28 5.43%
Energy
Financials
122 CBOE Global Markets, Inc. CBOE $86.08 $114.42 $13,959.24 3.59%
134 Encore Capital Group, Inc. ECPG $37.21 $62.73 $8,405.82 2.16%
189 First American Financial Corporation FAF $57.20 $64.82 $12,250.98 3.15%
28 The Goldman Sachs Group, Inc. GS $382.75 $330.10 $9,242.80 2.38%
$43,858.84 11.29%
Healthcare
102 CVS Health Corporation CVS $60.96 $101.21 $10,323.42 2.66%
33 ICU Medical, Inc. ICUI $182.11 $222.64 $7,347.12 1.89%
56 Laboratory Corporation of America Holdings LH $155.68 $263.66 $14,764.96 3.80%
97 Medtronic PLC MDT $101.87 $110.95 $10,762.15 2.77%
123 Merck & Co. MRK $81.63 $82.05 $10,092.15 2.60%
62 Vertex Pharmaceuticals, Inc. VRTX $213.16 $260.97 $16,180.14 4.17%
$69,469.94 17.89%
Industrials
97 AGCO Corporation AGCO $130.75 $146.03 $14,164.91 3.65%
67 Huntington Ingalls Industries, Inc. HII $166.92 $199.44 $13,362.48 3.44%
22 Lockheed Martin Corporation LMT $369.51 $441.40 $9,710.80 2.50%
$37,238.19 9.59%
Information Technology
155 Cisco Systems, Inc. CSCO $45.45 $55.76 $8,642.80 2.23%
49 Microsoft Corporation MSFT $223.57 $308.31 $15,107.19 3.89%
79 Paypal Holdings, Inc. PYPL $132.54 $115.65 $9,136.35 2.35%
61 Salesforce.com, Inc CRM $211.60 $212.32 $12,951.52 3.33%
72 Visa, Inc. V $136.30 $221.77 $15,967.44 4.11%
$61,805.30 15.91%
Materials
Real Estate
140 Realty Income Corporation O $60.58 $69.30 $9,702.00 2.50%
$9,702.00 2.50%
Utilities
92 Nextera Energy, Inc. $64.71 $84.71 $7,793.32 2.01%
$7,793.32 2.01%
0.00%
COMMON STOCK Total $336,347.00 86.60%
CASH AND EQUIVALENTS
Fidelity Cash Reserves $52,024.96 13.40%
0.00%
Total Portfolio $388,371.96 100.00%
Purchases and Sales
                                                 McClain Torch Fund
                                            From 01/01/2022 to 03/31/2022

            Period    Date       Quantity     Price                    Company               Ticker    Amount
Purchases
             P2      2/11/2022     32       $ 360.00                Ulta Beauty, Inc         ULTA     $ 11,520.00

Sales
             P2      2/28/2022     49       $ 208.24              Meta Platforms, Inc.         FB     $ 10,203.07
             P2      3/11/2022     186      $ 76.29              Newmont Corporation         NEM      $ 14,189.86
             P2      3/11/2022     134      $ 63.20             Encore Capital Group, Inc.   ECPG     $ 8,468.75
             P2      3/14/2022     22       $ 447.00          Lockheed Martin Corporation    LMT      $ 9,833.94
             P2      3/25/2022     77       $ 101.30                InterActiveCorp           IAC     $ 7,800.06

                                 Performance Summary
Returning Managers

Tucker Cox joined the McClain Torch Fund in August 2021. He is from
Cleveland, Tennessee and is a senior majoring in finance with a collateral
in accounting. Tucker previously covered real estate and utilities and now
covers industrials and materials for the McClain Torch Fund which
includes the holdings AGCO, HII, LMT, and NEM. Tucker is currently
interning with Tennessee Valley Authority with the Strategy & Support
team within External Relations. Upon graduation in May 2022, Tucker
plans to pursue a career in wealth management or corporate finance.

Kyler Kring joined the McClain Torch Fund in August 2021. He is from
Knoxville, TN and is a senior majoring in finance with a collateral in
economics. Kyler previously covered information technology and now
covers energy and utilities for the McClain Torch Fund which includes the
holding NEE. He has been a member of the Dean’s List each semester
during his tenure at the University of Tennessee. This past summer, he
served as a Financial Analyst Intern for Slainte Investment Group. After
graduation in May 2022, Kyler will join LCG Associates in Atlanta, GA as a
Performance Analyst.

Kelli Ross joined the McClain Torch Fund in August 2021. She is from
Harlingen, TX and is a senior majoring in finance and business analytics
with a collateral in information management. Kelli previously covered
consumer discretionary and consumer staples and now covers financials
and real estate for the McClain Torch Fund which includes the holdings
CBOE, ECPG, FAF, GS, and O. Kelli previously interned with EmployBridge
and JPMorgan Chase & Co. She is currently an Analytics Intern at Hodges &
Pratt. After graduation in May 2022, Kelli will join Eagle Capital
Management in New York, NY as an Equity Research Analyst.

Austin Tallent joined the McClain Torch Fund in August 2021. He is from
Maryville, TN and is a senior majoring in finance with a collateral in
economics. Austin previously covered industrials and now covers
information technology for the McClain Torch Fund which includes the
holdings CRM, CSCO, MSFT, PYPL, and V. On campus, Austin is Founder
and President of College Libertarians at UTK and is a Local Coordinator for
Students for Liberty. After graduating in May 2022, Austin will join 49
Financial in Atlanta, GA as a Financial Advisor.
Sean Wynn joined the McClain Torch Fund in August 2021. He is from Rye
Brook, NY and is a senior majoring in accounting with a collateral in
finance. Sean previously covered financials and now covers healthcare for
the McClain Torch Fund which includes CVS, ICUI, LH, MDT, MRK and
VRTX. He has been a member of the Dean’s List during each of his
semesters at the University of Tennessee. Sean is a member of the
Tennessee Capital Market Society, the Order of Omega, and Beta Theta Pi.
Upon graduating in May 2022, Sean will join BNP Paribas in New York, NY
as an Investment Banking Analyst.

            New Managers

Emily Carter joined the McClain Torch Fund in January 2022. She is from
Knoxville, TN and is a junior majoring in finance with a collateral in
business analytics and minor in leadership studies. Emily covers the
consumer staples and consumer discretionary sectors including the
holdings AMZN, DHI, KMB, MO, and SWBI. She currently works as a Senior
Analyst in the Masters Investment Learning Center in the University of
Tennessee’s Haslam College of Business. Emily has been part of the Dean’s
List during each of her semesters at the University of Tennessee. Upon her
graduation in May 2023, she hopes to pursue a career in financial advising.

Evan Olds joined the McClain Torch Fund in January 2022. He is from
Chattanooga, TN and is a junior majoring in business analytics with a
collateral in finance. Evan will be covering the communications services
sector which includes the holdings EA, FB, GOOGL, IAC, and MTCH. He has
been a member of the Dean’s List each semester during his time at the
Haslam College of Business and is a member of UT Investment Group’s
team portfolio. Evan previously worked in sales and management in the
telecommunications industry and hopes to pursue a career in wealth
management or corporate finance after graduation in May 2023.
AGCO Corporation
                                         (AGCO)

 Market Price     Target Price     Market Cap       EPS (TTM)        P/E (TTM)        P2 Return
  $146.03           $155.13         $10.89B          $10.39            14.05x          26.04%

Description: AGCO Corporation (AGCO) is a manufacturer and distributor of agricultural
equipment. AGCO sells a wide range of agricultural equipment (e.g., tractors, combines, various hay
tools, sprayers, etc.). AGCO also sells replacement parts for these different types of equipment.
AGCO has a network of about 3,300 dealers and distributors across 140 countries with Europe
accounting for nearly 56% of annual revenue. AGCO’s mission is to offer farmer-focused solutions
to sustainably feed the world.
                                              Investment Thesis:
                                              As a fund we believe AGCO’s economic moat resides
                                              in its ability to be a leader in smart farming
                                              technologies as well as its long-term strategy of
                                              entering emerging markets. In 2021, 76% of revenue
                                              came from countries outside of North America.
                                              Entering new emerging markets will allow to capture
                                              market share previously held by Deere and Case IH.
                                              Global crop yields will need to dramatically increase
                                              by 2030 to meet the demands of a growing
                                              population. Large farms needing to maximize
                                              efficiencies while minimizing costs, allows smart
                                              technologies Fuse and Precision Planting to continue
                                              strong growth for AGCO.
                                              Recent quarters have seen record breaking inflated
                                              soft commodity prices.1 These conditions have been
                                              economically beneficial for farmers, allowing them to
                                              upgrade their fleet of tractors and other agricultural
                                              equipment. That is why it’s no surprise that AGCO
                                              was one of the funds best performers in P2. In turn, a
                                              decline in soft commodity prices would present a risk
                                              to AGCO like in 2014-2016 where prices fell, and
                                              AGCO saw a 11% dip in revenue during that period.2
                              Return Compared to Related Indices
Amazon.com, Inc.
(AMZN)
Market Price Target Price Market Cap EPS (TTM) P/E (TTM) P2 Return
$3,259.95 $4,099.60 $1.66T $46.64 69.89x (2.23%)
Description: Amazon.com, Inc. (AMZN) is currently one of the biggest tech companies in the world
and one of the largest businesses in terms of market share. Within the consumer discretionary
sector, Amazon is an advertising and analytics company with online retail as its main source of
revenue through selling and delivering various products.
Investment Thesis:
Amazon’s success is due largely to its pursuit to
deliver superior performance to its customers.
Examples include its exceptional customer service
with its Amazon Prime one-day delivery service and
tracking system along with innovative technology
like its virtual assistant Alexa. Amazon’s e-commerce
platform offers an immense selection of products at
competitive prices, both produced by Amazon and
provided through third parties. It consists of about
50% of Amazon’s total revenue.
Amazon’s cloud-based technology is encompassed
within Amazon Web Services (AWS), a subsidiary of
Amazon making up about 13% of Amazon’s revenue
in 2021.1 Dominating the cloud infrastructure
market, Amazon’s market share at the end of the
2021 4th quarter was 33% with its closest
competitors Microsoft and Google controlling a
combined 31%.2 Consumer’s increased demand for
online shopping and the expanding technology
industry can help hedge Amazon’s increased labor
costs.
Return Compared to Related IndicesChicago Board
Options Exchange
(CBOE)
Market Price Target Price Market Cap EPS (TTM) P/E (TTM) P2 Return
$114.42 $145.00 $12.20B $5.20 21.99x (11.89%)
Description: The Chicago Board Options Exchange (CBOE) is the largest U.S. options exchange.
CBOE generates most of its revenue through transaction fees from options and North American
equities but also has revenue coming in from Europe and Asia Pacific, futures, and global FX.
Investment Thesis:
CBOE provides cutting-edge trading and investment
solutions to investors around the world as the first
listed-options marketplace. The firm has three main
strategic growth priorities: hitting medium-term
organic net revenue growth of 5-7% annually by
focusing on data and access solutions, derivatives,
and Cboe Digital.1 Being a foundational firm in the
securities market means CBOE has a wide economic
moat.
CBOE thrives off market volatility which is beneficial
during market conditions such as what we’ve been
experiencing the first few months of the year. There
are some potential headwinds in regard to CBOE’s
market data fees which make up approximately 16%
of the firm’s revenue. The SIP Operating Committees
filed amendments on November 15th to adopt cost-
based fees for the content underlying consolidated
market data sold to various parties.2 While this
doesn’t necessarily change their economic moat, it
could potentially present some headwinds for the
firm depending on the outcome.
Return Compared to Related IndicesSalesforce, Inc.
(CRM)
Market Price Target Price Market Cap EPS (TTM) P/E (TTM) P2 Return
$212.32 $304.54 $210.20B $1.98 128.68x (16.45%)
Description: Salesforce (CRM) is a leading enterprise software company that specializes in
customer relationship management, cloud, and analytics for improving efficiency.
Investment Thesis:
Salesforce has been a proven leader over the past
several years in each of their fields, pulling market
share from experienced competitors such as SAP and
Oracle while also keeping large firms like Amazon,
Microsoft, and others from taking large amounts in
the CRM space.1
Strong acquisitions such as Slack and MuleSoft have
driven Salesforce over the past several years, though
earnings calls have alluded to a slowing of strategic
acquisitions for now. 2 Although this could mean
missing out on growth opportunities, it likely means
there is a rigid strategy which would be consistent
with opinion of Salesforce.
Attrition and the creation of proprietary enterprise
software is a risk for Salesforce. Given Salesforce’s
industry reputation, their ability to grow their client
base, and the desire of other firms to outsource and
focus on developing a competitive advantage,
Salesforce is unlikely to be impacted on a large scale.
Return Compared to Related IndicesCisco Systems, Inc.
(CSCO)
Market Price Target Price Market Cap EPS (TTM) P/E (TTM) P2 Return
$55.76 $64.88 $231.64B $2.87 19.41x (11.42%)
Description: Cisco Systems (CSCO) operates globally in the industries of networking, cloud,
security, and hardware. They offer hardware products as well as services and software that power
the internet.
Investment Thesis:
Over the past year, CSCO released the backbone of
their competitive advantage moving forward: Cisco
Silicon One routing solution and Cisco 8000 class
router. The two allow for CSCO to integrate routing
and pluggable optics, creating localized high-speed
connections at low costs.1
It is the integration of CSCO’s products and their
crucial place as an internet intermediary that create
their moat. CSCO’s security unit effectively integrates
with their networks utilizing a concept called full-
stack observability, and the objective is to provide
transparency of data flows for safety, efficiency, and
cost savings. 2 Furthermore, CSCO sells to a wide
customer base that includes retail consumers, large
firms, and governments. 3
CSCO’s development of hard goods has been and
could be further impacted by supply chain
disruptions in the form of rising commodities prices
and chip shortages.
Return Compared to Related IndicesCVS Health
Corporation
(CVS)
Market Price Target Price Market Cap EPS (TTM) P/E (TTM) P2 Return
$101.21 $117.84 $132.84B $7.21 14.03x (1.36%)
Description: CVS Health (CVS) is a diversified healthcare company that operates in three main
segments: pharmacy services, retail, and healthcare benefits. CVS’s diversification into different
verticals of pharmaceutical and healthcare products offers unique synergies that lead to industry-
leading operational success.
Investment Thesis:
CVS Health owns a health care payer to consumer
ecosystem by combining a health insurance company,
a pharmacy benefits manager (PBM), and a retail
pharmacy. 1
CVS’s three business segments synergize to create a
one-stop giant that owns a large portion of the health
care industry. People buy health insurance to help
manage health care costs. Insurers hire a PBM to best
determine which drugs should be covered on its
insurance plans. These drugs are then sold in
pharmacies purchased by people with health
insurance. CVS’s integrated business segments allows
them to profit at each step of the value chain.
In March, CVS removed a regional manager and
several other employees due to sexual harassment
allegations. It will be important in the coming months
to see if there is any more color into the issue and
evaluate whether there is a toxic organizational
culture.
Returns Compared to Related IndicesD. R. Horton, Inc.
(DHI)
Market Price Target Price Market Cap EPS (TTM) P/E (TTM) P2 Return
$74.51 $119.69 $26.40B $12.55 5.94x (31.09%)
Description: D.R. Horton, Inc. (DHI) is a U.S. homebuilding business that utilizes multiple brands to
reach a wider customer base more effectively. Located within the consumer discretionary sector,
DHI is known as the largest U.S. homebuilding company by volume since 2002 with homebuilding
with 95% of its revenue generated from completed home sales.
Investment Thesis:
DHI uses several brands to contribute to its
homebuilding sales, with its name brand focused on
selling to first-time buyers and generating about 65%
of DHI’s home sale revenue. Other brands include
Express Homes for entry-level buyers, Emerald
Homes for luxury buyers, and Freedom Homes for
active adult buyers. Differing brands allows DHI to
more efficiently market to consumers of different
stages of life, incomes, and needs, leading to DHI’s
competitive advantage in reaching a vast customer
base.
Residential construction material prices have risen
8% from January to March 2022 with a 20.4% YoY
price increase.2 However, the construction labor
market is growing with more jobs and a relatively
steady job quit level throughout this period.1 DHI can
more easily attract qualified labor with its
established reputation. Its size can also help DHI
negotiate with suppliers during the current supply-
chain shortages and material cost increase.
Return Compared to Related IndicesElectronic Arts Inc.
(EA)
Market Price Target Price Market Cap EPS (TTM) P/E (TTM) P2 Return
$126.51 $166.00 $35.58B $2.90 43.66x (3.96%)
Description: Electronic Arts (EA) is one of the largest publicly traded video game developers in the
world and has been a major player in the industry for nearly 40 years. Its extensive catalog of
games has established a diverse group of recurring customers spread across all major platforms.
Investment Thesis:
EA was founded by Apple employee Trip Hawkins in
1982 and found near immediate success as a video
game publisher.1 Following the upcoming acquisition
of Activision Blizzard by Microsoft, EA will be the
largest public traded American company focusing
primarily on the development and publishing of
video games.
EA owns a large catalog of game series that attract
customers of essentially all interests: Madden NFL
Football, military shooter Battlefield, and FIFA. In
January EA announced the development of three new
Stars Wars games after the highly successful release
of 2019’s Jedi Fallen Order.2 In addition, EA runs a
Full Game subscription service called EA play which provides
access to many of its titles. This service, along with
microtransactions in several popular mobile games,
has been responsible for fast growth in the ’Live
Live
Services & Services & Other’ division.3
Other
One risk to the company is the potential for
government regulators to label microtransaction
mechanics as forms of gambling. However, EA
recently had a 2019 fine for this practice in
overturned in the Netherlands.4
Return Compared to Related Indices
150% 250%
200%
100%
150%
100%
50%
50%
0% 0%
SPX Index RAV Index EA US Equity SPX Index RAV Index EA US EquityEncore Capital Group,
Inc.
(ECPG)
Market Price Target Price Market Cap EPS (TTM) P/E (TTM) P2 Return
$62.73 $65.75 $1.54B $11.99 5.23x 1.38%
Description: Encore Capital Group (ECPG) purchases past-due financial obligations and
receivables from major banks, credit unions and utility providers for pennies on the dollar. They
are then tasked with attempting to collect the debt themselves to generate revenue.
Investment Thesis:
Being the country’s largest debt collector allows for
ECPG to leverage their scale in operations and data
analytics to deliver attractive returns regardless of
economic cycle. Therefore, they have higher
conversion rates than their competition. ECPG also
operates in Europe and is the largest debt collector in
the U.K.1
Over the past few quarters ECPG has struggled with a
lack of supply of portfolios to purchase which has
dampened revenue.2 This is expected to change as
rising interest rates typically translates to an increase
in debt defaults which would create an opportunity
for ECPG to increase their volume. Though this same
environment could negatively impact their collection
rates.
The fund is experiencing a market with several
multiple contractions. Further, noticing some insider
trades that would indicate executives also believe it
was a good time to take profits, the team decided to
lock in gains from one of the portfolio’s best
performers and liquidated half the position.
Return Compared to Related IndicesFirst American
Financial
(FAF)
Market Price Target Price Market Cap EPS (TTM) P/E (TTM) P2 Return
$64.82 $87.42 $7.09B $8.06 8.04x (16.49%)
Description: First American Financial (FAF) provides a wide variety of financial services. The two
core business segments that generate revenue are the title insurance and specialty insurance
segments. Customers pay FAF a premium to cover them from potential financial loss sustained from
defects in a title to a property. This protects the customer from potential back taxes, liens, and
conflicting wills that can be tied to the property.
Investment Thesis:
Title insurance is essentially necessary with any type
of real estate purchase. FAF is the largest title
insurance company with over a fifth of the entire
market share.1 Due to their scale the firm is able to
leverage their data to create more efficient processes
in terms of both underwriting and providing
excellent service to their customers. FAF not only
generate revenue through their title and insurance
services but also their lender and servicer solutions,
real estate data solutions, home warranty and trust
services, and international services. This helps
diversify the firm through times of real estate market
cooling.
FAF’s title and insurance revenue is essentially tied to
the real estate market as this specific insurance is
only necessary at the time of purchase. With this in
mind, it will be vital to watch real estate market
conditions as it recovers from a chaotic two years of
astounding growth.2 We saw multiple firms
experience multiple contraction returning from
similar pandemic levels so it will be important to
avoid this with FAF.
Return Compared to Related IndicesMeta Platforms, Inc.
(FB) (SOLD)
Exit Price Target Price Market Cap EPS (TTM) P/E (TTM) P2 Return
$208.24 N/A $605.25B $13.80 16.11x (38.09%)
Description: Meta (FB) was first established as Facebook.com, created by Mark Zuckerberg along
with several fellow Harvard students. In late October, the company announced it would be
rebranding itself as Meta and reporting its hardware division as a new segment called Reality Labs.1
Investment Thesis:
FB is the owner of popular social media sites/apps
Facebook, Instagram, and WhatsApp. FB’s primary
income comes from serving targeted ads to users
based on the demographic information the company
is able to collect. FB’s share price crashed after the
subpar Q4 2021 earnings release, revealing
increasing losses of over $10B from the Reality Labs
division along with the first ever decline in Facebook
daily active users.2 CFO David Wehner also stated
that the iPhone app tracking transparency (ATT)
feature released mid 2021 would result in an
Facebook Daily Active Users estimated additional $10B loss to core operations
across 2022.3
We waited for some recovery in the share price, and
eventually decided to exit our position due to a belief
that FB was transitioning towards what could be
considered a speculative, growth investment and no
longer fit our fund’s value-based approach. We may
consider re-entering this position sometime in the
future after further earnings and guidance releases,
but only if we believe that the company has both
improved their algorithms to account for Apple’s ATT
feature and are able to keep reality labs spending in
check to allow the segment to reach profitability.
Return Compared to Related Indices
150% 300%
250%
100% 200%
150%
50% 100%
50%
0% 0%
SPX Index RAV Index FB US Equity SPX Index RAV Index FB US EquityAlphabet, Inc.
(GOOGL)
Market Price Target Price Market Cap EPS (TTM) P/E (TTM) P2 Return
$2,781.35 $3,350.00 $1.84T $99.78 27.88x (3.99%)
Description: Alphabet, Inc (GOOGL) currently reports its operations in three major segments. The
Google Services segment primarily generates revenue through advertisement and sales of apps,
subscription services, and consumer electronics. The Google Cloud segment provides businesses
with cloud computing and encryption services while the Other Bets segment consists of research in
emerging technologies such as AI and self-piloting vehicles.
Investment Thesis:
Like FB, GOOGL operates primarily as an online
advertiser. However, unlike FB, its search engine
shows no signs of decline in users and faces only a
small number of competitors with far lower market
shares.1 GOOGL’s market share in the smartphone OS
has also shown steady growth, likely due to
expansion into emerging markets where android
phones are a more affordable alternative compared
to the iPhone.2
Youtube.com and the streaming service YouTube TV
are increasingly threatening to the cable and
streaming industry, generating over $8.6B in ad
revenue in Q4 2021 alone. Overall, GOOGL was able
to increase its EPS from $58.61 in 2020 to $112.20 in
2021, an impressive increase of almost 100%.3
From one perspective, GOOGL faces some of the same
threats as FB due to the iPhone’s ATT feature, along
with increasing pressure from regulators regarding
online privacy. However, GOOGL recently announced
it was beginning a multi-year effort to build a similar
feature for android phones.4 GOOGL’s willingness to
embrace this technology along with increasing
earnings implies this threat may not be a major one.
Return Compared to Related IndicesThe Goldman Sachs
Group, Inc.
(GS)
Market Price Target Price Market Cap EPS (TTM) P/E (TTM) P2 Return
$330.10 $392.20 $117.67B $60.54 5.45x (13.19%)
Description: Goldman Sachs (GS) is one of the world's most renowned investment banks and
financial services companies. They generate revenue through four different business lines:
investment banking, global markets, asset management, and consumer and wealth management.
Investment Thesis:
GS consider their greatest asset to be their talent.
Through having the best talent in the industry GS
delivers their clients and shareholders long-term
value. Top talent is attracted to GS due to the fact that
they’ll have the opportunity to work with the best in
their industry and have a prestigious name on their
resume. GS pays competitive wages to ensure they
acquire the best talent to continue this successful
cycle.
GS is a diversified firm that generates revenue
through investment banking, but also their global
markets, asset management, and consumer and
wealth management segments. This helps fortify the
firm against different and volatile market conditions.
Due to the diversification mentioned above, GS has
benefitted internally from the market volatility that
we’ve seen recently but have taken a hit as
underwriting, mergers, and IPOs have slowed down
quite a bit this year.1 Their consumer banking
segment, Marcus, is expected to benefit from rising
interest rates alongside other consumer banking
firms.2
Return Compared to Related IndicesHuntington Ingalls
Industries
(HII)
Market Price Target Price Market Cap EPS (TTM) P/E (TTM) P2 Return
$199.44 $227.43 $8.0B $12.88 15.48x 7.43%
Description: Huntington Ingalls Industries (HII) designs, builds, and services ships for the U.S.
Navy and Coast Guard. HII is the sole supplier to the U.S. military. HII builds a variety of ships (e.g.,
warfare ships, submarines, and Coast Guard surface ships.)
Investment Thesis:
HII’s business segments are broken down into three
divisions: Ingalls Shipbuilding, Newport News
Shipbuilding, and Technical Solutions.1
All of HII’s revenue is generated through U.S.
government contracts. Ship building is a long and
drawn-out process, as one ship can take years to
manufacture. Ships are often purchased in pieces as
they are built. This process, mixed with the
consistency of ship orders creates reliable and
consistent cash flows for HII which decreases our
portfolio’s risk.
HII’s recent success and future growth prospects are
in the changing geopolitical landscape. The Russia
and Ukraine crisis should create periods of increased
defense budgets.2 As the U.S. looks to upgrade their
Navy with newer nuclear and non-nuclear ships, HII
is in a great spot to capture growth. While
government contracts are HII’s biggest growth
driver, a long term decrease in defense spending
could present a small risk of declining revenues.
Return Compared to Related IndicesInterActiveCorp
(IAC) (SOLD)
Exit Price Target Price Market Cap EPS (TTM) P/E (TTM) P2 Return
$101.30 N/A $9.00B ($0.31) -161.5x (22.50%)
Description: InterActiveCorp (IAC) is a holding company which primarily focuses on developing or
acquiring internet and media brands. Established in 1986 as Silver King Broadcasting, the company
was purchased in 1995 by Barry Diller who is still Chairman and Senior Executive to this day.1
Investment Thesis:
IAC operates similarly to a private equity firm,
focusing on acquiring primarily online businesses
and restructuring them in the hope of later spinning
them off at a profit. We currently hold one of these
companies, MTCH, but chose to sell YouTube
competitor VMEO after it was spun off in May of last
year. IAC has created 11 public companies in total
since its inception, and notably acquired media
conglomerate Meredith in late 2021, combining it
with the existing Dotdash business segment.2
After ANGI released Q4 earnings showing EPS was
moving in the wrong direction, we decided to revisit
IAC’s pipeline and did not identify any substantial
opportunities for further spinoffs over the next
several periods. In March, the SEC and DOJ
announced an insider trading probe into Barry Diller
and his stepson regarding ATVI option purchases
made shortly before the acquisition deal by MSFT
was publicly announced.3 Following this, Diller’s
gambling license, which is needed in order for IAC to
maintain its 12% stack in MGM Resorts, was delayed
by the Nevada Gaming Commission.4 These incidents
led us to the decision to liquidate our position during
the period.
Return Compared to Related Indices
150% 1200%
1000%
100% 800%
600%
50% 400%
200%
0% 0%
SPX Index RAV Index IAC US Equity SPX Index RAV Index IAC US EquityICU Medical Inc.
(ICUI)
Market Price Target Price Market Cap EPS (TTM) P/E (TTM) P2 Return
$222.64 $259.50 $5.30B $5.54 40.19x (6.19%)
Description: ICU Medical (ICUI) is a pure-play infusion therapy company that has a wide range of
products sold in their four business segments: infusion consumables, infusion systems, IV solutions,
and critical care.2
Investment Thesis:
ICUI is the only pure-play infusion therapy company
in the world. This focus on infusion therapy allows it
to have a superior understanding of its customers
and a vast scale. Its core business strategy relies on
two main characteristics: price undercutting for
infusion consumables and high switching costs for its
IV hardware.
ICUI helps medical providers cut costs over time as
they sell their infusion consumables at rock bottom
prices. While its hardware is initially expensive, it has
a long useful life that pairs well with its consumable
products. Altogether, ICUI establishes its moat by
selling providers a quality product at the most
competitive prices in the market.
In January of 2022, ICUI acquired Smith Medical to
further diversify its supply portfolio. Large
acquisitions such as this pose risks such as the
inability to integrate operations and failing to see the
expected synergies. It will be important to follow the
integration process in the coming quarters.
Return Compared to Related IndicesKimberly-Clark
Corporation
(KMB)
Market Price Target Price Market Cap EPS (TTM) P/E (TTM) P2 Return
$123.16 $150.20 $41.50B $6.29 19.58x (13.03%)
Description: Kimberly-Clark Corp (KMB), known as one of the world’s largest personal paper
product makers, manufactures and provides consumer health and hygiene products.
Investment Thesis:
KMB strives to serve its consumers around the world
through high quality goods and services across
several business segments divided among numerous
brands, providing goods to 175 countries and about
one-quarter of the world’s population.2 About half of
KMB’s revenue comes from personal care, its largest
business unit. KMB utilizes brands to better market
to consumers and create brand imaging, such as
through using different diaper brands for different
ages of children. Competing globally with a wide
variety of products offered through its business
segments personal care, consumer tissue, and K-C
Professional, KMB better offsets risk from rising
material costs.
KMB markets to consumers but sells to supermarkets
and mass merchandisers with 15% of sales to
Walmart, its largest customer. U.S. sales account for
about 55% of KMB’s sales.1 KMB is a good defensive
stock as part of the consumer staples sector with
relatively stable demand throughout economic
cycles, balancing other more-volatile sectors.
Return Compared to Related IndicesLaboratory
Corporation of
America Holdings
(LH)
Market Price Target Price Market Cap EPS (TTM) P/E (TTM) P2 Return
$263.66 $329.59 $24.63B $25.12 10.50x (16.09%)
Description: Laboratory Corporation of America (LH and LabCorp) is a clinical laboratory
company that offers clinical tests used in the medical profession for patient diagnosis, patient
monitoring in the treatment of disease, medical device testing, and clinical trials. The company has
two revenue segments: LabCorp Diagnostics (Dx) for testing patients and LabCorp Drug
Development (DD) for trial drugs.2
Investment Thesis:
Being a diagnostic company, LH is in the information
business. LH is consistently collecting data from both
medical diagnostics and clinical drug trials.
This process of information sharing between the
segments strengthens both segments and gives LH its
economic moat. For example, it can match a person
who got a rare medical diagnosis with a new clinical
drug that it is currently testing. The synergies of its
segments allow for great efficiency and offer strong
growth potential.
The medical industry is highly regulated and at times
can slow operational efficiency. For example, HIPPA
can restrict the use of customer information. This can
make it harder for LH to pair a person who was
diagnosed with a disease with a trial drug.
Return Compared to Related IndicesLockheed Martin
Cooperation
(LMT)
Market Price Target Price Market Cap EPS (TTM) P/E (TTM) P2 Return
$441.40 $506.51 $117.65B $32.63 13.53x 25.77%
Description: Lockheed Martin (LMT) is a security and aerospace company that facilitates in the
research, design, and manufacturing of advanced technologies, systems, and services. Business
segments include aeronautics, missiles, and fire control (MFC), rotary and missions’ systems (RMS),
and space.
Investment Thesis:
From vertical lift aircraft to hypersonic missiles, LMT
leads the way in technological innovation in the
defense sector which delivers on their mission of
“solve complex challenges, advance scientific
discovery and deliver innovative solutions to help
our customers keep people safe.”1
The F-35 jet program accounts for 30% of revenues
and is one of the most sought-after pieces of defense
equipment in the world. More than 70% of revenue
come from the U.S. government in the form of long-
term contracts, with the remaining coming from U.S.
allies.
During P2, we liquidated half of the portfolio’s
position in LMT. With a large position in LMT and HII
we felt it was a good opportunity to lock in gains
during a period of favorable conditions. The Russia
and Ukraine crisis allowed us to exit at an
advantageous price of $447/share.2 LMT is in a good
position to capture value as countries look to
increase defense spending following geopolitical
tensions in Eastern Europe.
Return Compared to Related IndicesMedtronic, PLC
(MDT)
Market Price Target Price Market Cap EPS (TTM) P/E (TTM) P2 Return
$110.95 $125.43 $148.84B $4.51 24.60x 7.86%
Description: Medtronic (MDT) is a medical equipment and supplies company that sells therapeutic
and diagnostic medical products to a wide range of medical providers and sub-verticals. MDT is
split into four operating segments: cardiovascular, medical & surgical, neuroscience, and diabetes.
Investment Thesis:
MDT’s economic moat is established through its
diversity of products and vast scale. It has marketing
and sales teams that are based around physician
specialists. These team members develop a high
knowledge of their customers and get a great
understanding of customer needs. This helps both
current sales and future product development.
Companies like MDT with a large product portfolio
run the risk of being over-diversified and not being
specialized in fewer products. Consequently, MDT
can spend too much time focusing on expanding its
product portfolio while ignoring its core strengths. It
will be important to follow if MDT can continue to see
strong consistent growth in all its operating
segments.
After a dip in FY 2021, MDT has shown strong YoY
growth in subsequent months. MDT should print
good earnings growth in FY 2022.
Returns Compared to Related IndicesAltria Group, Inc.
(MO)
Market Price Target Price Market Cap EPS (TTM) P/E (TTM) P2 Return
$52.25 $54.55 $94.95B $4.61 11.34x 12.15%
Description: Altria Group, Inc. (MO) is a holding company that manufactures and sells tobacco
products.1 Its business segments include smokable tobacco products, oral tobacco products, and
wine.
Investment Thesis:
Known as the largest cigarette company in the U.S.,
smokable tobacco products account for about 90% of
MO’s total revenue. MO sells products under
subsidiaries such as Philip Morris USA, the top
cigarette brand globally. Almost 10% of revenue
comes from MO’s oral tobacco products, sold under
the subsidiary UST. MO’s remaining revenue is
accounted within its wine and smokeless tobacco
business unit.2 MO is aware of the cultural shift from
tobacco product use, introducing programs to
transition users to less harmful products and
informing consumer choice with health information
readily available.
Although society is trending away from smokable
products, MO is still competitive with its smokeless
products such as Juul as well as an expanding alcohol
business segment through brewing. MO is a
worthwhile investment as a defensive holding from
its stable demand, characterizing MO as within the
consumer staples sector. MO also pays a dividend of
about 7% annually.
Return Compared to Related IndicesMerck & Co Inc.
(MRK)
Market Price Target Price Market Cap EPS (TTM) P/E (TTM) P2 Return
$82.05 $91.55 $207.40B $6.47 12.68x 7.96%
Description: Merck (MRK) is a global drug manufacturer with a large portfolio of medicines
covering a wide range of diseases and other health issues. MRK operates in two segments:
pharmaceutical and animal health.
Investment Thesis:
MRK is a legacy pharmaceutical power. They have
historically been market leaders in pharmaceutical
sales and have consistently had a strong portfolio of
approved drugs. MRK’s revenue is driven primarily
by its pharmaceutical segment (90% of total
revenue). Its best-selling drugs include Keytruda
($11B), Januvia/Janumet ($5.5B), and Gardasil
($3.7B).
MRK establishes its moat through its current drug
portfolio and successful future drug creation. Its
current patent protection on several top-selling
drugs gives them time to develop its next generation
of drugs. MRK’s track record gives investors
confidence that they will continue to produce high-
profit margin drugs in the future.
MRK’s reliance on future drug creation does run the
risk of a cold streak of drug development which
would hurt future earnings. It is important to closely
follow MRK’s clinical trial portfolio as it indicates
future sales potential.
Returns Compared to Related IndicesMicrosoft Corporation
(MSFT)
Market Price Target Price Market Cap EPS (TTM) P/E (TTM) P2 Return
$308.31 $316.09 $2.31T $8.73 35.33x (8.14%)
Description: Microsoft Corporation (MSFT) is one of the world’s most recognizable names and was
founded as a software company in 1975. Today, they provide various types of business and
networking solutions.
Investment Thesis:
MSFT innovations in their cloud segment, Azure, are
creating firm value by allowing users to remotely
access computing power through a combination of
subscription and fee for use offerings. MSFT’s scale
allows them to roll out low-cost data centers to reach
a global customer base. 2
MSFT talent attraction, results, and scale in business
ventures such as Azure but also in gaming, desktop,
and more make MSFT an attractive name to hold in a
value portfolio. MSFT returned $10.4B to
shareholders in Q4 2021 following its history of
strong cash generation. 1
Geopolitical stability and economic development
create demand for MSFT’s products globally. This and
the further risk of unfavorable pricing from suppliers
could cut into MSFT’s profitability and growth
moving forward. The proposed acquisition of
Activision Blizzard creates valuable synergies for the
firm and is a deal we are watching with our
investment objectives in mind. 3
Return Compared to Related IndicesMatch Group Inc.
(MTCH)
Market Price Target Price Market Cap EPS (TTM) P/E (TTM) P2 Return
$108.74 $160.00 $31.01B $0.87 124.96x (17.78%)
Description: Match Group Inc. (MTCH) is a company which runs a variety of online dating services.
It primarily generates revenue through the sale of monthly subscriptions which provide users with
initial access to the service or added benefits on it.
Investment Thesis:
MTCH is the owner of Tinder, the #1 downloaded
dating app worldwide.1 In addition, The company has
successfully acquired many new services to expand
their reach into additional markets. One example is
Hinge, which requires users to send a message when
liking, increasing the rate of meaningful interaction
between users. Their properties Match.com and
Plenty of Fish target a slightly older demographic
with a stronger focus on finding long-term
relationships over casual dating. Dating app BLK
exclusively markets itself to African American users
and was launched in 2017 after MTCH employees
believed they did not have a service that appealed
strongly enough to this large potential userbase.2
This network of dating services allows MTCH to
apply innovations and research discovered on one
platform to all others. This provides them with a
unique competitive advantage within a competitive
industry. We believe that this industry has very
strong growth potential over the next several months
as fears over the Omicron variant seem to have
largely subsided. However, the risk of future
lockdowns remains, presenting a potential threat to
MTCH’s business model.
Return Compared to Related Indices
150% 250%
200%
100%
150%
100%
50%
50%
0% 0%
SPX Index RAV Index MTCH US Equity SPX Index RAV Index MTCH US EquityNextEra Energy, Inc
(NEE)
Market Price Target Price Market Cap EPS (TTM) P/E (TTM) P2 Return
$84.71 $101.73 $148.27B $2.45 34.52x (8.81%)
Description: NextEra Energy (NEE) is one of the largest electric utility providers in the entire
country. NEE’s subsidiaries include Florida Power & Light (FP&L), NextEra Energy Resources
(NEER), Gulf Power Company and NextEra Energy Partners.
Investment Thesis:
We hold NEE because of their scale and cost
advantages. NEE is one of the largest utility
companies in the country which gives it the ability to
provide electricity to its customers at relatively low
costs while growing their profits effectively.1
NEE’s largest growth drivers come from their
growing backlog and the transition to cleaner energy.
Their subsidiary NEER has them poised to capture
tremendous value. In Q4 2021, NEE completed
~1500-MW of their solar program. They also
commissioned the world’s largest solar-powered
battery.2
NEE faces headwinds in the short term due to the
rising rate environment. In a capital-intensive
industry, they rely heavily on debt to cover their
costs. As rates rise, their cost of debt will increase
and could potentially hurt margins. NEE has also seen
a recent management change. Longtime CEO Jim
Robo is stepping down and will be replaced by John
Ketchum. It will be important to monitor future
earnings calls to ensure new management continues
to deliver strong results.
Returns Compared to Related IndicesNewmont Corporation
(NEM) SOLD
Exit Price Target Price Market Cap EPS (TTM) P/E (TTM) P2 Return
$76.29 N/A $62.97B 2.52 30.27x 23.89%
Description: Newmont Corporation (NEM) is the world’s largest producer of gold. Though NEM
primarily focuses on gold operations, they also are engaged in the production of copper, silver, lead,
and zinc. Gold made up 86% of NEM annual sales in 2021 followed by zinc at 5%, silver at 7%,
copper at 1%, and lead at 1%.
Investment Thesis:
During the period gold prices increased from $1,829
to $1,937. Rising gold prices leads to increased free
cash flows and an increase in dividends per share.
NEM uses advanced mining and drilling techniques to
successfully locate and extract the raw minerals from
the ground. NEM finds and develops land in what is
known as “Greenfield” projects, and purchases
previously developed mines known as “Brownfield”
projects. NEM claims to have a project pipeline that
will sustain production well into 2040.1
During P2, NEM was liquidated from the portfolio.
Ultimately, the team concluded that NEM had no
competitive advantage as share price was highly
correlated with the price of an external commodity.2
Because NEM did not have the ability to create its
own competitive edge, we no longer fit into our
definition of value investing. While gold was near an
all-time high and the Fed began a hawkish approach
to slowing inflation, we believe we had a well-timed
exit.
Return Compared to Related IndicesRealty Income
Corporation
(O)
Market Price Target Price Market Cap EPS (TTM) P/E (TTM) P2 Return
$69.30 $79.54 $41.44B $1.47 47.13x (2.17%)
Description: Realty Income (O) is a real estate investment trust that purchases commercial real
estate leased to clients, the lease payments generated each month are used to support predictable
monthly dividend payments to shareholders.
Investment Thesis:
O has long-term net lease agreements which are
typically 10-20 years long and own approximately
11,000 commercial properties found in all 50 states.
They currently have an occupancy rate of 98.8% and
their occupancy rate has never been below 96.6%.1
The firm has a 53-year track record with 621
consecutive monthly dividends paid since their
founding and 98 consecutive quarterly dividend
increases. Historically, O has delivered more return
per unit of risk versus the majority of other S&P 500
REITs.1
Increasing interest rates could become a double-
edged sword as retailers might be more hesitant to
purchase properties hence leading to more need for
rental properties but could also impact O’s profit
margins if the cost of acquiring attractive properties
becomes pricier with the increasing rates.2 With a
majority of O’s portfolio being retailers, it will be
important to keep an eye on the Consumer
Confidence Index. Most of O’s clients are considered
non-discretionary firms, such as Walgreens and
Walmart, which is a positive in times of economic
downturn.
Return Compared to Related IndicesPayPal Holdings, Inc.
(PYPL)
Market Price Target Price Market Cap EPS (TTM) P/E (TTM) P2 Return
$115.65 $140.04 $134.73B $3.50 33.00x (38.67%)
Description: PayPal (PYPL) is in the business of creating a holistic financial super app that
integrates payment processing with other avenues such as cryptocurrency, securities trading, buy-
now-pay-later, and more.
Investment Thesis:
We hold PYPL because of their ability to grow and
capitalize on a wide customer base and collect steady
revenues through a diverse collection of financial
instruments and applications. PYPL is creating a
financial super app that includes an integrated
platform for transfers, check out, cryptocurrency, and
securities trading. During the period, PYPL
announced their trading platform Invest at PayPal.
PYPL’s major competitors include Square (SQ) and
Fiserv (FISV). Square is oriented towards mobile
transactions and small business, while PYPL
specializes in e-commerce because of their relative
scale, security, and payment options.2
PYPL stock plummeted following lowered guidance
and a shift in strategy during the Q4 2021 earnings
call. PYPL is prioritizing value creation from existing
customers over the addition of new customers.1 The
uncertainty surrounding this change and the roll-out
of Invest at PayPal are the two largest risks currently
surrounding PYPL.
Returns Compared to Related IndicesSmith & Wesson
Brands, Inc.
(SWBI)
Market Price Target Price Market Cap EPS (TTM) P/E (TTM) P2 Return
$15.13 $32.91 $689.00M $5.11 2.96x (14.10%)
Description: Smith and Wesson Brands (SWBI) is a firearms manufacturer, known as one of the
largest U.S. manufacturers of handguns, modern sporting rifles, and handcuffs. SWBI manufactures
and designs firearms for both consumers and government agencies.
Investment Thesis:
SWBI’s mission is to empower Americans,
accomplished through designing and manufacturing
firearms such as pistols, revolvers, and long guns.
SWBI also meets various outdoor enthusiasts’ needs,
providing ammunition along with equipment for
activities like hunting, fishing, and camping.1 A top
gun brand in the U.S. for over 150 years, SWBI is
dedicated to Americans’ safety with discounts to law
enforcement, military, and first responders through
its American Guardians program.
Gun sales increased following the pandemic and civil
unrest throughout 2020 with many sales from first-
time buyers. This contributed to SWBI’s gun sales
reaching a historical high of $1B. The average
American gun-owner is changing as more women and
minorities buy guns, accounting for many of the
recent first-time buyers. As states continue to change
regulations around carrying permits and gun
regulations, shifting both towards increasing and
relaxing restrictions throughout various states, SWBI
remains prevalent in America.2
Returns Compared to Related IndicesUlta Beauty, Inc.
(ULTA)
Market Price Target Price Market Cap EPS (TTM) P/E (TTM) P2 Return
$398.22 $425.38 $20.84B $18.09 22.02x 10.62%
Description: Ulta Beauty, Inc. (ULTA) is the one stop shop for all things beauty such as cosmetics,
fragrance, skin care products, hair care products, and even beauty services. They offer everything
from low to high end products with something for every type of beauty consumer.
Investment Thesis:
ULTA is the country’s largest beauty retailer. They
have been recovering from the pandemic extremely
well, now outperforming their pre-pandemic levels
while still dealing with some uncertainty in the
market. ULTA has multiple unrivaled strategic
advantages such as their range in products and
services, large loyalty program, convenience, and
new partnership with Target to name a few.
ULTA offers over 25,000 products offered from over
600 brands including their own private label. They
have a robust loyalty program boasting over 37M
active members.1 ULTA has also recently partnered
with Target to create a “shop in shop” experience
with over 50 brands now available and Ulta Beauty
trained employees available to assist customers.
Shoppers can now seamlessly link Target and Ulta
Beauty memberships together. Target currently has
over 100M members, which is expected to boost
ULTA Memberships massively.2 As a discretionary
stock, it is important to monitor consumer spending
for potential downturn and the adversary effects that
could have on ULTA.
Returns Compared to Related IndicesVisa, Inc.
(V)
Market Price Target Price Market Cap EPS (TTM) P/E (TTM) P2 Return
$221.77 $250.22 $480.02B $5.57 39.80x 2.51%
Description: Visa (V), is a digital payments company operating in over 200 countries with over 160
currencies though the U.S. accounts for 45% of revenue. They operate in a wide range of payment
processing businesses including digital banking, digital wallets, fintechs, and governments as they
“accelerate the migration to digital payments.” 1
Investment Thesis:
V’s ability to offer business solutions with scale is
unmatched in the digital payments field, and their
security and consulting businesses further set them
apart because of their top talent and partner
ecosystem. V’s value proposition is faster customer
growth by accessing their payment solutions.
Tap to pay and tokenization are two quickly growing
V innovations. Tap to pay is at 90% penetration in 20
countries, and there are 400M tap to pay enabled
cards worldwide. Tokenization reduces the risk of
fraud by replacing an account number with a
representative token. The number of tokens created
doubled in the 2021 fiscal year.
V is exposed to many markets which may experience
geopolitical or currency volatility, but their
diversification and high exposure to stable economies
reduces this risk. 2
Return Compared to Related IndicesYou can also read


