Measurement of oxygen saturation in small retinal vessels with adaptive optics confocal scanning laser ophthalmoscope
←
→
Page content transcription
If your browser does not render page correctly, please read the page content below
Measurement of oxygen saturation in
                 small retinal vessels with adaptive optics
                 confocal scanning laser ophthalmoscope

                 Hao Li
                 Jing Lu
                 Guohua Shi
                 Yudong Zhang

Downloaded From: https://www.spiedigitallibrary.org/journals/Journal-of-Biomedical-Optics on 16 Feb 2021
Terms of Use: https://www.spiedigitallibrary.org/terms-of-use
JBO Letters

                                                                                                   gen saturation measurement in retinal vessels.9 Kagemann et al.
                Measurement of oxygen                                                              used Fourier domain optical coherence tomography to assess
                saturation in small retinal                                                        retinal oxygen saturation, and a difference between arterial and
                                                                                                   venous oxygen saturation was detected.10 Smith et al. used a
                vessels with adaptive optics                                                       scanning laser ophthalmoscope to measure retinal oxygen satu-
                                                                                                   ration in vessels with a diameter larger than 50 μm.11
                confocal scanning laser                                                                However, the image resolution of the above mentioned meth-
                                                                                                   ods is restricted by ocular aberrations. For the vessels smaller
                ophthalmoscope                                                                     than 50 μm, the image difference between different wavelengths
                                                                                                   and the vessel profile are difficult to be detected. Thus, it is very
                                                                                                   difficult to measure oxygen saturation in the vessels smaller
                Hao Li, Jing Lu, Guohua Shi, and Yudong Zhang                                      than 50 μm,5, 6, 11 though the small vessels can be imaged. On
                The Key Laboratory on Adaptive Optics, Graduate School of Chinese                  the other hand, the ocular aberrations can be compensated with
                Academy of Sciences, Institute of Optics and Electronics, Chengdu
                610209, China                                                                      adaptive optics (AO) to achieve a nearly diffraction-limited
                                                                                                   resolution.12 AO has been combined with confocal scanning
                Abstract. We have used an adaptive optics confocal scan-                           laser ophthalmoscope (AOSLO)13–15 to improve the imaging
                ning laser ophthalmoscope to assess oxygen saturation in                           resolution.
                small retinal vessels. Images of the vessels with a diameter                           In this study, oxygen saturation in small retinal vessels with
                smaller than 50 μm are recorded at oxygen sensitive and                            diameters ranging from 27 to 49 μm is assessed by AOSLO.
                isosbestic wavelengths (680 and 796 nm, respectively). The                         High resolution retinal vessel images are obtained at oxygen sen-
                vessel optical densities (ODs) are determined by a computer                        sitive and isosbestic wavelength (680 and 796 nm, respectively).
                algorithm. Then, OD ratios (ODRs), which are inversely pro-                        Optical densities (ODs) of vascular segments are determined by
                portional to oxygen saturation, are calculated. The results                        a computer algorithm. Then, the OD ratios (ODRs) that are
                show that arterial ODRs are significantly smaller than ve-
                                                                                                   inversely proportional to the oxygen saturation are calculated.
                nous ODRs, indicating that oxygen saturation in the artery
                                                                                                       A dual-wavelength AOSLO system for real-time (30 Hz)
                is higher than that in the vein. To the best of our knowl-
                edge, this is the first noninvasive measurement of oxygen                          retina imaging is used in the experiment. Figure 1 shows a
                saturation in small retinal vessels. C 2011 Society of Photo-Optical              schematic diagram of the setup. A band-filtered beam (680 or
                Instrumentation Engineers (SPIE). [DOI: 10.1117/1.3655354]                         796 nm, 7 nm bandwidth) of light emitted from a superlumi-
                                                                                                   nescent diode (SLD1: Superlumdiodes Ltd., SLD-261-HP or
                Keywords: adaptive optics confocal scanning laser ophthalmoscope;                  SLD2: Superlumdiodes Ltd., SLD-381-HP1) is focused to a
                retinal oximetry; retinal image registration; spectrophotometry.
                                                                                                   small spot on the retina. Two scanning mirrors [horizontal scan-
                Paper 11443LR received Aug. 16, 2011; revised manuscript received
                Sep. 20, 2011; accepted for publication Oct. 3, 2011; published online
                                                                                                   ner (HS): 16 KHz resonant scanner, Electro-Optical Products
                Nov. 10, 2011.                                                                     Corp. vertical scanner (VS): 30 Hz galvometric scanner, Cam-
                                                                                                   bridge 6800-HP-3YS] are used to control the focused spot to
                                                                                                   scan the retina. Light scattered back from the retina is split
                                                                                                   into two beams. One beam enters a photomultiplier tube (PMT,
                    The retina has a high demand for oxygen, and retinal hypoxia                   Hamamatsu H7422-20) for signal detection. By synchronizing
                is believed to be an important factor in retinal diseases, such as                 the PMT signal and two scanning mirrors, the retinal images
                diabetic retinopathy,1 glaucoma,2 and arteriovenous occlusion.3                    can be consecutively recorded. The other beam is captured by a
                Because retinal microvasculature plays an important role in the                    Shack–Hartmann wavefront sensor (WS) with 97 effective sub-
                oxygen supply, the measurement of the oxygen saturation in                         apertures in 11×11 arrays. The slope data of the wavefront are
                small retinal vessels would be very useful to diagnose and mon-                    acquired by a computer and transferred to control signals for a
                itor these diseases.                                                               37-channel deformable mirror (DM). After 20 to 30 iterations,
                    A lot of noninvasive techniques have been developed to mea-                    the error of the corrected wavefront approaches the minimum.
                sure the oxygen saturation of retina. Hickham et al. were the first                The resolution of our imaging system is approximately 2.5 μm
                to noninvasively measure the retinal oxygenation using photo-                      lateral and better than 100 μm axial.15
                graphic methods.4 Delori developed a three-wavelength oxime-                           Eight normal healthy volunteers (3 female, 5 male, ages
                try to obtain oxygen saturation in retinal vessels.5 Beach et al.                  range from 22 to 30 years) were recruited for this study. To
                presented a digital imaging system to measure oxygen satura-                       control the image location, a computer-controlled 8×8 LED
                tion in retinal vessels by dual-wavelength imaging.6 Khoobehi                      array fixation target was provided for the volunteer to view
                et al. developed a hyperspectral imaging technique for spa-                        while imaging. In order to find the best imaging plane of blood
                tially mapping the relative oxygen saturation in the optic nerve                   vessels, defocus was applied to section the retina axially. Video
                head.7 Narasimha-Iyer et al. developed automatic algorithms                        clips of retinal vessels at 680 and 796 nm were recorded sequen-
                for oximetry with dual-wavelength fundus images.8 Ramella-                         tially. The frame size is 512×480 pixels, and the field of view is
                Roman et al. introduced a multiaperture camera system for oxy-                     1.5 deg. The time interval between two wavelengths switching
                                                                                                   is approximately 3 s. Four sequential frames were averaged to
                                                                                                   improve the image quality.16
                Address all correspondence to: Guohua Shi, Institute of Optics and Elec-
                tronics, Chinese Academy of Sciences, Shuangliu P.O. Box 350, Chengdu
                610209, China; Tel: + 8613880184201; Fax: + 86028-85100433; E-mail:
                guohua_shi@yahoo.com.cn.                                                           1083-3668/2011/16(11)/110504/3/$25.00
                                                                                                                                         C 2011 SPIE

                Journal of Biomedical Optics                                              110504-1                                        November 2011 r Vol. 16(11)

Downloaded From: https://www.spiedigitallibrary.org/journals/Journal-of-Biomedical-Optics on 16 Feb 2021
Terms of Use: https://www.spiedigitallibrary.org/terms-of-use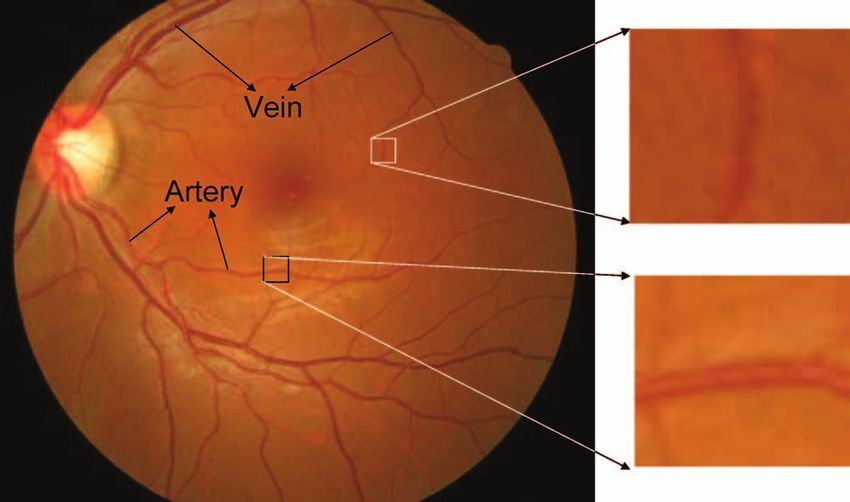
JBO Letters
Fig. 1 Schematic of a dual-wavelength AOSLO system. HS, horizontal
scanner; VS, vertical scanner; WS, wavefront sensor; DM, deformable
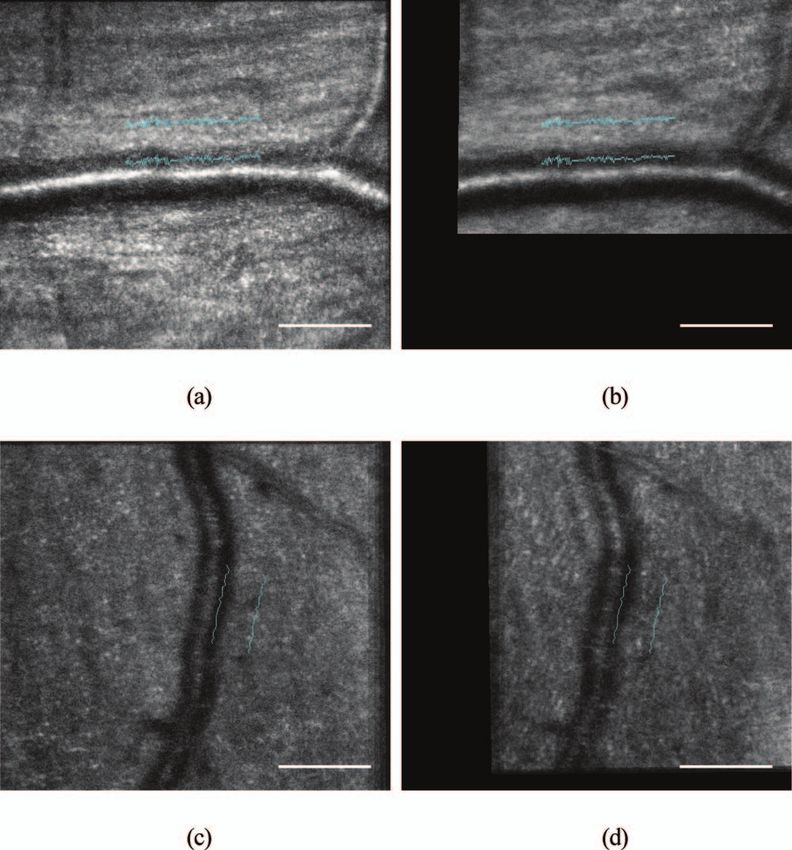
mirror; PMT, photomultiplier tube; BS1, BS2, BS3, beam splitters; BF1, Fig. 2 The paths tracked along the retinal vessels. (a) and (c) Retinal
BF2, band filters; CL, collecting lens; FM1, FM2, folding mirrors; SLD1, images acquired at 680 nm. (b) and (d) Retinal images acquired at
SLD2, superluminescent diodes; M1 ∼ M8, spherical mirrors; PH, pin- 796 nm. All scale bars represent 100 μm.
hole; TL, trial lens.
The ODRs between the ODs measured at oxygen sensitive wave-
Due to the eye motion, the retinal images at different wave- length and isosbestic wavelength bear an inverse linear relation-
lengths have to be registered. The similarity between the images ship to oxygen saturation.4, 6, 8, 11 ODR is expressed as:
at 680 and 796 nm is determined using mutual information,17
which is defined as ODR = ODsensitive /ODisosbestic . (3)
p AB (i, j) The extinction coefficients of HbO2 and Hb vary with
I (A, B) = p AB (i, j) log , (1)
p A (i, j) · p B (i, j) wavelength.18 At 680 nm, the difference in extinction coeffi-
i, j
cients between HbO2 and Hb is relatively large, while at 796 nm
where pAB (i, j) is the joint probability distribution of images the difference is small. For this reason, 680 nm was used as the
A and B, and pA (i, j) and pB (i, j) are probability distributions oxygen sensitive wavelength, and 796 nm was used as the isos-
of images A and B, respectively. pAB (i, j) can be estimated by bestic wavelength. OD680 nm /OD796 nm follows an inverse linear
calculating a normalized joint histogram of the gray values, and relationship with oxygen saturation. The calculated ODRs of
pA (i, j) and pB (i, j) can be estimated by calculating a normalized the vessels in Fig. 2 are presented in Table 1.
histogram.17 The image at 680 nm was used as a reference. A As is shown in Table 1, vascular ODR in Fig. 2(a) is sig-
subimage from the image at 796 nm was translated and rotated nificantly smaller than that in Fig. 2(c). This suggests that the
to maximize I(A,B) of the subimage and the reference image. vascular oxygen saturation in Fig. 2(a) is higher than that in
Then, the translation and the rotation of the image at 796 nm Fig. 2(a).
were determined, and the images were registered. A fundus camera (Cannon CR6-45NM) was used to identify
After the registration, a computer program was used to obtain retinal arteries and veins. A fundus camera image is shown in
the paths by tracking the minimum intensity inside the vessel Fig. 3, and the field of view is 37 deg. The black and white
and the outside intensity at a fixed distance from the minimum rectangles in Fig. 3 represent the regions in Figs. 2(a) and 2(c),
intensity. The paths were identified in the 796 nm images, and respectively. Arteries and veins were identified by visual inspec-
the corresponding paths on the 680 nm images were also de- tion of the fundus camera image. The vessel in Fig. 2(a) is an
termined. The results are shown in Fig. 2. Figures 2(a) and
2(c) were acquired at 680 nm, and Figs. 2(b) and 2(d) were ac-
Table 1 ODRs of the vessels in Fig. 2.
quired at 796 nm. The diameters of the vessels in Figs. 2(a) and
2(c) are approximately 49 and 34 μm, respectively. The vessel
diameter was determined by the method described in Ref. 5. Figures OD680 OD796 ODR
Then, a direct calculation of the vessel OD was obtained at
wavelength λ by averaging the intensities on the paths inside 2(a) 0.27 0.49 0.55
and outside the vessels (Iλin and Iλout ). 2(c) 0.46 0.48 0.96
ODλ = log10 (Iλout Iλin ). (2)
Journal of Biomedical Optics 110504-2 November 2011 r Vol. 16(11)
Downloaded From: https://www.spiedigitallibrary.org/journals/Journal-of-Biomedical-Optics on 16 Feb 2021
Terms of Use: https://www.spiedigitallibrary.org/terms-of-use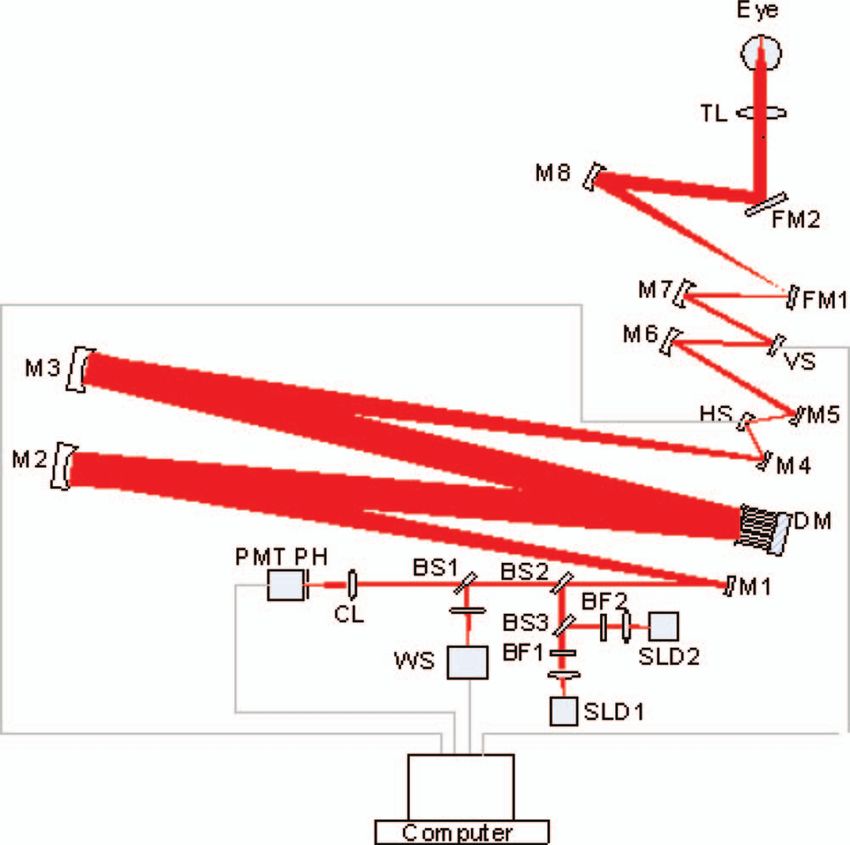
JBO Letters
saturation would be very useful to achieve early assessments of
retinal disease associated with oxygen utilization.
Acknowledgments
This research was supported by the Knowledge Innovation Pro-
gram of the Chinese Academy of Sciences, Grant No. KGCX2-
Y11-920.
References
1. E. Stefansson, M. B. Landers, and M. L. Wolbarsht, “Oxygena-
tion and vasodilatation in relation to diabetic and other proliferative
retinopathies,” Ophthalmic Surg. 14(3), 209–226 (1983).
Fig. 3 A fundus camera image showing the same regions imaged in 2. S. Blumenröder, A. J. Augustin, and F. H Koch, “The influence of
Fig. 2. intraocular pressure and systemic oxygen tension on the intravascular
pO2 of the pig retina as measured with phosphorescence imaging,”
Surv. Ophthalmol. 42(Supp l), S118–S126 (1997).
3. S. Yoneya, T. Saito, Y. Nishiyama, T. Deguchi, M. Takasu, T. Gil, and
E. Horn, “Retinal oxygen saturation evels in patients with central retinal
artery and the vessel in Fig. 2(c) is a vein. Thus, the vascular vein occlusion,” Ophthalmology 109(8), 1521–1526 (2002).
oxygen saturation in Fig. 2(a) is higher than that in Fig. 2(c). 4. J. B. Hickam, R. Frayser, and J. C. Ross, “A study of retinal venous
This agrees with the results obtained with AOSLO. blood oxygen saturation in human subjects by photographic means,”
ODRs of the eight volunteers’ vessels are presented in Circulation 27, 375–385 (1963).
5. F. C. Delori, “Noninvasive technique for oximetry of blood in retinal
Table 2, and the results show that the arterial ODRs are sig- vessels,” Appl. Opt. 27(6), 1113–1125 (1988).
nificantly smaller than the venous ODRs (0.60 ± 0.11 and 6. J. M. Beach, K. J. Schwenzer, S. Srinivas, D. Kim, and J. S. Tiedeman,
0.98 ± 0.07, respectively; p < 0.00001) (mean ± standard de- “Oximetry of retinal vessels by dual-wavelength imaging: calibration
viation). A significant difference between arterial and venous and influence of pigmentation,” J. Appl. Physiol. 86(2), 748–758 (1999).
7. B. Khoobehi, J. M. Beach, and H. Kawano, “Hyperspectral imaging
oxygen saturation is therefore detected.
for measurement of oxygen saturation in the optic nerve head,” Invest.
In summary, AOSLO has been used to assess retinal oxygen Ophthalmol. Visual Sci. 45(5), 1464–1472 (2004).
saturation. The retinal vessels with diameter ranging from 27 to 8. H. Narasimha-lyer, J. M. Beach, B. Khoobehi, J. Ning, H. Kawano,
49 μm were imaged at two wavelengths (680 and 796 nm), and and B. Roysam, “Algorithms for automated oximetry along the retinal
the ODRs of the vessels between 796 and 680 nm were calcu- vascular tree from dual-wavelength fundus images,” J. Biomed. Opt.
10(5), 054013 (2005).
lated. The results showed that arterial ODRs were significantly 9. J. C. Ramella-Roman, S. A. Mathews, H. Kandimalla, A. Nabili, D. D.
smaller than venous ODRs, indicating that oxygen saturation in Duncan, S. A. D’Anna, S. M. Shah, and Q. D. Nguyen, “Measurement
the artery is higher than that in the vein. As the oxygen satura- of oxygen saturation in the retina with a spectroscopic sensitive multi
tion in small vessels can be affected by the metabolic activity aperture camera,” Opt. Express 16(9), 6170–6182 (2008).
in the local areas of the retina, the measurement of the oxygen 10. L. Kagemann, G. Wollstein, M. Wojtkowski, H. Ishikawa, K. A.
Townsend, M. L. Gabriele, V. J. Srinivasan, J. G. Fujimoto, and
J. S. Schuman, “Spectral oximetry assessed with high-speed ultra-
high-resolution optical coherence tomography,” J. Biomed. Opt. 12(4),
041212 (2007).
Table 2 Comparison of arterial and venous ODRs. 11. M. H. Smith, K. R. Denninghoff, L. W. Hillman, and R. A. Chipman,
“Oxygen saturation measurements of blood in retinal vessels during
blood loss,” J. Biomed. Opt. 3(3), 296–303 (1998).
Artery Vein 12. A. Roorda and D. R. Williams, “The arrangement of the three cone
classes in the living human eye,”Nature 397(679), 520–522 (1999).
Diameter (μm) ODR Diameter (μm) ODR 13. A. Roorda, F. Romero–Borja, W. J. Donnelly, H. Queener, T. J. Hebert,
and M. C. W. Campbell, “Adaptive optics scanning laser ophthal-
1 49 0.55 34 0.96 moscopy,” Opt. Express 10(9), 405–412 (2002).
14. D. X. Hammer, R. D. Ferguson, C. E. Bigelow, N. V. Iftimia, T. E. Ustun,
2 46 0.69 33 0.95 and S. A. Burns, “Adaptive optics scanning laser ophthalmoscope for
stabilized retinal imaging,” Opt. Express 14(8), 3354–3367 (2006).
3 47 0.43 29 0.93 15. J. Lu, H. Li, L. Wei, G. Shi, and Y. Zhang. “Retina imaging in vivo with
the adaptive optics confocal scanning laser ophthalmoscope,” Proc.
4 32 0.51 37 1.09 SPIE 7519, 75191I (2009).
16. H. Li, J. Lu, G. Shi, and Y. Zhang, “Tracking features in retinal images
5 38 0.60 43 1.06 of adaptive optics confocal scanning laser ophthalmoscope using KLT-
SIFT algorithm,” Biomed. Opt. Express 1(1), 31–40 (2010).
6 27 0.77 38 0.93 17. C. Studholme, D. L. G. Hill, and D. J. Hawkes, “An overlap invariant
entropy measure of 3D medical image alignment,” Pattern Recogn.
7 31 0.58 47 0.88 32(1), 71–86 (1999).
18. Data tabulated from various sources compiled by S. Prahl,
8 49 0.68 31 1.00 http://omlc.ogi.edu/spectra.
Journal of Biomedical Optics 110504-3 November 2011 r Vol. 16(11)
Downloaded From: https://www.spiedigitallibrary.org/journals/Journal-of-Biomedical-Optics on 16 Feb 2021
Terms of Use: https://www.spiedigitallibrary.org/terms-of-useYou can also read