Evaluation of the Hazard Perception Skills of Young Drivers - Sciendo
←
→
Page content transcription
If your browser does not render page correctly, please read the page content below
LOGI – Scientific Journal on Transport and Logistics
                                                     Vol. 12      No. 1       2021       DOI: 10.2478/logi-2021-0008
                       © 2021 H. Sappl and T. Kubjatko. This is an open access article licensed under the Creative Commons
                         Attribution-NonCommercial-NoDerivs License (http://creativecommons.org/licenses/by-nc-nd/3.0/).

            Evaluation of the Hazard Perception Skills of Young Drivers

                                  Hannes Sappl1* and Tibor Kubjatko1
1
 University of Žilina, Institute for Forensic Research and Education, Ulica 1. mája 32, 010 26
Žilina, Slovakia; Email: sappl@unfallrekonstruktion.at, tkubjatko@gmail.com

*Corresponding Author: Hannes Sappl

Received: 14 October 2020; Revised: 3 November 2020; Accepted: 22 February 2021; Published:
31 May 2021

Abstract: The aim of this study is to collate valuable information about the hazard perception
process of (young) drivers and to evaluate their hazard perception skills. For this, an eye-tracking
system was used to record the visual behaviour of drivers. In addition, a system based on a data
logger and sensors was developed to capture and log the relevant data from the vehicle. By tapping
into the vehicle´s CAN bus (Controller Area Network), the needed parameters (e.g. position of
accelerator, brake, and clutch pedal, as well as the steering wheel angle) were acquired through the
reverse engineering of the vehicle´s CAN stream. All the captured data was subsequently
synchronized and overlaid in the eye-tracking video. The complete system, i.e. data-logger and
sensors, was consistently integrated into a driving school car. Due to the fact that all the data was
captured in real-time whilst driving in traffic, every analysed situation can be considered unique and
therefore cannot be compared to other situations. The results of the study revealed that only in 18%
of the analysed situations, the hazard-perception skills were adequate or the same as they were
taught at the driving school just a few months previous. Confronted by the videos of their lessons,
the participating drivers adjusted their self-assessment scores for their driving skills downwards by
around 25% on average.

Keywords: Hazard perception, eye tracking, real-time traffic, CAN bus, reverse engineering

1. Introduction
In countries like Great Britain and the Netherlands “hazard perception” has been an important topic
in driver education and the driving test for many years. In Great Britain for example, the Hazard
Perception Test (HPT) is part of the theory test, whereby traffic video clips from the driver’s point
of view are shown to the participant. Each video clip contains one or two developing hazards. A
developing hazard is a traffic situation that requires the driver to act, such as changing speed or

                                                        78
direction [1]. The participant must prove that they have spotted the developing hazard by clicking
on their mouse. The earlier a developing hazard is spotted, the higher the score they receive, with a
maximum of 5 points awarded [2]. In Austria and Germany for example, “hazard perception” only
plays a small and unimportant role in the process of driver education. In Austria, the German word
for hazard perception (Gefahrenwahrnehmung) only appears 4 times in the relevant legislation and
curricula for obtaining a driving licence [3]. On the other hand, studies show that hazard perception
abilities are a central part of someone’s driving skills and are closely connected to the risk of having
an accident [4].
    The aim of this study is to collate valuable information about the hazard perception process of
(young) drivers and to evaluate how good their hazard perception skills actually, and how they
perceive their own hazard perception skills before and after their debriefing.
    Obtaining information about hazard perception is usually either done by showing a video to a
candidate who has to push a button when they recognise a (potential) hazard, or in front of a driving
simulator in which the candidates are equipped with an eye-tracking system and all the needed
information is collected by the simulator [5].
    The basis of this study was to evaluate hazard perception by capturing data in a real car and in
real-time whilst driving in traffic to get as realistic results as possible. The disadvantage of this
methodology is that every captured situation was unique and could not be compared to other
situations. It was therefore not possible to conduct a statistical evaluation. The results are therefore
described qualitatively.

2. Methods
2.1 Experimental Setup
For this study, the Viewpointsystem eye-tracking system was used to record the visual behaviour of
the drivers. In the 25-fps output video of the eye-tracking system, the driver’s field of vision was
overlaid with their point of focus. As shown in Figure 1, the inner circle represents the 2° foveal
(detailed recognition) field of vision, and the outer circle the 10° parafoveal (perception of colours,
shapes and contrast) field of vision. In addition, a system based on a data logger and sensors was
developed to capture and log the relevant data from the vehicle. To log the accelerations (both
lateral and longitudinal) and the GPS position, the well-known DL1 (Data Logger) from Race
Technology was used and mounted onto a 10 kg steel plate with levelling screws to reduce the
influence of oscillatory instability. The unit was subsequently placed horizontally behind the
instructor´s/co-driver’s seat [6].
    By tapping into the vehicles CAN bus, the rest of the needed parameters were acquired through
reverse engineering of the vehicles CAN stream.

                                                  79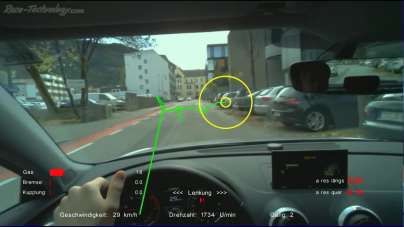
To eliminate the gravitational coupling due to the acceleration-dependent movement of the car,
and to get the real values of lateral and longitudinal acceleration, the car was also equipped with 4
ultrasonic sensors attached to the corners of the chassis, each measuring the distance to the ground.
The measured distances enabled the pitch and roll angle to be calculated, as well as the subtraction
of the gravity-based accelerations from the measured accelerations [7].

                    Fig. 1 Foveal and parafoveal fields of vision. Source: authors
    To capture all the signals and pass them on to the datalogger, as well as to provide the needed
voltage to the sensors, an input/output (I/O) board was developed and mounted to the steel plate
next to the DL1 (see Figure 2).

                           Fig. 2 Datalogger and I/O board. Source: authors
    To control the system from the driver´s or instructor´s/co-driver’s seat, a wired remote was also
installed and connected to the I/O board. This provided the driver or instructor with all the required
LEDs and buttons accordingly.
    The following data was captured by the sensors or via the CAN bus and logged or calculated by
the datalogger in real-time [8]:
•   Accelerations (both longitudinal and lateral)
•   Pitch and roll angle
                                                    80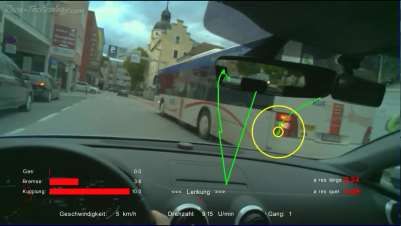
•   GPS position
•   Position of accelerator, brake and clutch pedals
•   Steering wheel angle
•   Steering wheel angular speed
•   Speed (CAN and GPS)
•   RPM
•   Active gear
    An LED was used to synchronize the video from the eye-tracking system and the logged data.
By pressing a button on the remote, an LED lit up in the driver’s field of vision. The act of pressing
the button was also logged by the data logger [9]. The final result: all the captured data was
synchronized and overlaid for the driving situation and time (Figure 3).

        Fig. 3 Eye-tracking video overlaid with signals from the datalogger. Source: authors
    To avoid deviations due to non-100% consistent frame rates, the process of synchronization
could be repeated as often as required [10]. The described system was able to measure:
•   Recognition: when the (potential) hazard appears in the driver´s foveal or parafoveal fields of
    vision.
•   Decision: when the driver changes pedal positions, speed, or direction.
•   Action: the strength of the driver’s reaction (e.g. measured deceleration).
    The complete system, i.e. datalogger and sensors, was consistently integrated into a driving
school car (Audi A3 Sportback 1.6 TDI, 85 kW, model year 2017) to perform the tests.

2.2 Participating Drivers
The participating drivers were young drivers who had passed their driving test between 3 and 15
months prior to the commencement of this study. The average age of the participants was 18 years,
each with 15,100 km of self-driving experience on average. According to their self-assessment, the
average score for their hazard perception skills was 8 out of 10. After every lesson the recorded

                                                 81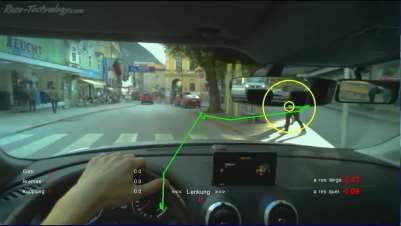
video was shown to the driver and the situations in which their hazard perception skills were
considered inadequate were discussed. After their debriefing, the drivers were given the opportunity
to reassess their hazard perception skills on the 10-point scale. In total, this study includes the
driving lessons of 25 drivers. Per driver, two suitable situations involving pedestrians crossing or
stepping in to the road were picked out and analysed. In the following section, three examples are
given and described in detail.

3. Results
3.1 First Example
In the first video, a driver passes parked cars in a built up area at 29 km/h. As can be seen in Figure
4, a pedestrian standing between the cars comes into the driver´s vision for the first time. At this
point, the accelerator pedal position is at 16%.

                       Fig. 4 Pedestrian in the driver´s vision. Source: authors
    9 frames later (between 360 and 440 ms), as can be seen in Figure 5, the pedestrian is still in
the driver´s vision. However, the driver has now completely taken their foot off the accelerator
pedal (0%).

         Fig. 5 Driver has taken foot completely off the accelerator pedal. Source: authors

                                                   82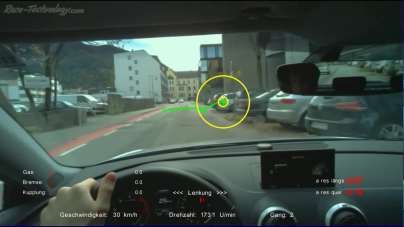
When it appears to be very clear that the pedestrian is looking at the car or driver, the driver
starts to press the accelerator pedal again (2%), while still watching the pedestrian’s behaviour (see
Figure 6).

                       Fig. 6 Driver starts to accelerate again. Source: authors
    As can been seen in Figure 7, when the car has almost come into line with the pedestrian’s
position at 25 km/h, the driver for the first time turns their focus away from the pedestrian and starts
to accelerate again (12% pedal position). This video shows that the driver, upon first noticing the
pedestrian, immediately took their foot off the accelerator pedal and subsequently kept observing
the pedestrian’s behaviour. The pedestrian didn’t have to take a step on to the road to trigger the
driver’s prompt reaction. Rather, the driver reacted by slightly reducing their speed in readiness to
brake, which was ultimately not necessary.

              Fig. 7 Driver turns their focus away from the pedestrian. Source: authors

3.2 Second Example
In the second video, the driver is approaching a zebra crossing in a built up area - speed 17 km/h;
accelerator pedal position 29%; longitudinal acceleration 1.12 m/s². Up ahead, there are buses
positioned on both sides of the street. In front of the bus on the left, the heads of pedestrians

                                                  83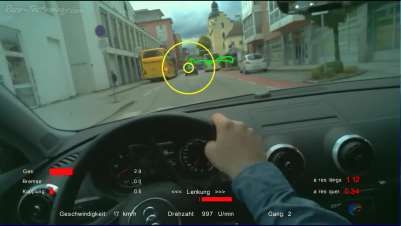
watching the oncoming traffic can clearly be seen. However, the driver is focused on the car in front
of them (see Figure 8).
Fig. 8 Pedestrians heads in front of the bus. Source: authors
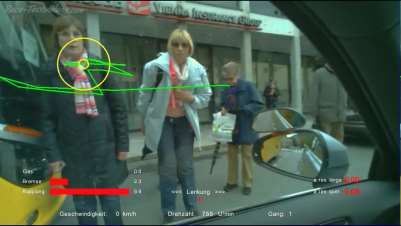
20 frames later, as can be seen in Figure 9, the bus on the right starts to indicate to the left. The
pedestrians on the left are still watching the traffic and the driver is still focused on the car in front -
speed 20 km/h; accelerator pedal position 47%; longitudinal acceleration 1.36 m/s². Only after the
accelerator pedal position reaches 56%, longitudinal acceleration 1.92 m/s², and speed 32 km/h,
does the driver start to react by pressing the clutch to shift down to 3rd gear, whilst still focusing on
the car in front of them. The bus on the right is still indicating and the complete upper bodies of the
pedestrians on the left are visible behind the yellow bus (see Figure 10). As passing an indicating
bus in a built up area is a traffic offence in Austria, the driving instructor intervenes to stop the car
with maximum deceleration of 6.1 m/s².
Fig. 9 Bus indicating to the left. Source: authors
84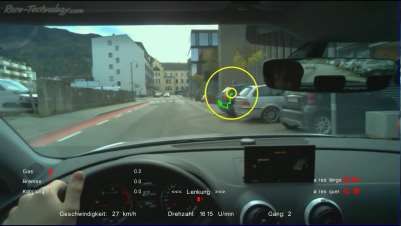
Fig. 10 Driving instructor intervenes to stop the car. Source: authors
    The surprised driver now takes their focus off the car in front and starts looking around to find
the reason for the driving instructor´s intervention. 29 frames later, as can be seen in Figure 11, the
driver focuses on the flashing indicator of the bus on the right. Seconds later, the driver also looks
to the left where they can see the waiting pedestrians for the first time (see Figure 12). This video
shows a situation in which the driver didn’t recognize a hazardous situation at all and keeps on
driving at an increasing speed.

         Fig. 11 Driver focuses on the flashing indicator for the first time. Source: authors

                 Fig. 12 Driver looks at the pedestrians for the first. Source: authors

                                                  85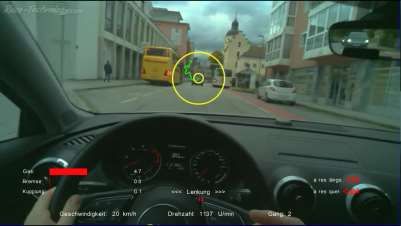
3.3 Third Example
In the third video, the driver is, once again, approaching a zebra crossing in a built up area at 27
km/h. The pedal positions are all 0% because the slightly downward sloping street maintains the
car´s momentum without the need for pressing the accelerator pedal. The driver´s vision is focused
on a building in front of them. However, on the right, two teenagers are approaching the zebra
crossing (see Figure 13). 30 frames later, the driver still hasn’t observed the pedestrians, whose
upper bodies are now hidden by the rear-view mirror (see Figure 14). It is only when the driver
looks in their rear-view mirror 14 frames later, that the legs of the pedestrians appear in the driver´s
parafoveal field of vision (see Figure 15), causing the driver to focus on them for the first time (see
Figure 16). As the pedestrians´ heads are hidden by the mirror, the driver is unable to see where the
pedestrians are looking. Nevertheless, the driver doesn’t change their pedal positions at all and
keeps on driving at the same speed.

               Fig. 13 Teenagers heading towards the zebra crossing. Source: authors

                Fig. 14 Pedestrians hidden by the rear-view mirror. Source: authors

                                                  86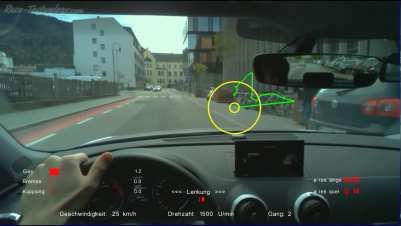
Fig. 15 Pedestrians become visible in the driver´s parafoveal field of vision. Source: authors

               Fig. 16 Driver looks at the pedestrians for the first time. Source: authors

3.4 Reassessment
After watching the recorded videos following the driving lesson, all participating drivers admitted
that there was at least one situation in which they were surprised or shocked at their own visual
behaviour or about the fact that they had not recognised a potentially hazardous situation.
Confronted by these videos, the participating drivers adjusted the self-assessment scores for their
hazard perception abilities downwards from 8/10 to 6/10 points on average, a decrease of 25%.

4. Conclusion
According to all 50 analysed situations of the 25 participating drivers, and according to the
examples given, three different types of hazard perception can be identified (see Figure 17):
1.   Drivers don’t recognise a (potential) hazardous situation at all and keep driving at the same or
     at increasing speed (occurred in 29 situations). In a few cases, the car had to be stopped by the
     driving instructor to avoid a traffic offence or an accident.
2.   Drivers see a (potential) hazard, but keep driving at the same speed and don’t change their
     pedal positions (occurred in 12 situations).

                                                    87
3. Drivers observe the situation attentively and decrease their accelerator pedal position or start to
press on the brake pedal to slow down the car a little bit (occurred in 9 situations). When the
situation becomes clearer (for example due to eye contact between the driver and the
pedestrian(s)), and the driver is sufficiently convinced that the pedestrian will not take a step
into the road, the driver increases the accelerator pedal position again and drives on.
In conclusion, in only 18% of the analysed situations were the hazard perception skills judged
to be adequate or as taught at the driving school just a few months previous.
Fig. 17. Types of hazard perception. Source: authors
When a driver is in a similar situation to “1” above, and is informed of their error during, not
after, the lesson, there is a noticeable improvement in behaviour when they are confronted with a
similar situation during the same driving lesson.
Under “3” above, the driver is not effectively applying the traditional 2-step model of “reacting
and braking fully”, which is widely applied in the field of accident reconstruction. By reducing
speed early, this type of driver adds an in-between step to the model, which makes their driving
much safer. Using this model would require a new method for calculating accident avoidance.
References
[1] Dirnbach, I., Kolla, E., Ondruš, J. & Kubjatko, T. (2020). Methodology designed to evaluate
accidents at intersection crossings with respect to forensic purposes and transport
sustainability. DOI: 10.3390/su12051972.
[2] Government Digital Service (GDS). Hazard perception test, Retrieved November 6, 2020,
from https://www.gov.uk/theory-test/hazard-perception-test.
88[3] Federal Ministry for Digitization and Business Location, Federal Legal Information System -
search term „Hazard warning*“ (in German), Retrieved November 6, 2020, from
https://www.ris.bka.gv.at/Ergebnis.wxe?Abfrage=Bundesnormen&Kundmachungsorgan=&In
dex=&Titel=&Gesetzesnummer=&VonArtikel=&BisArtikel=&VonParagraf=&BisParagraf=
&VonAnlage=&BisAnlage=&Typ=&Kundmachungsnummer=&Unterzeichnungsdatum=&F
assungVom=09.11.2020&VonInkrafttretedatum=&BisInkrafttretedatum=&VonAusserkrafttre
tedatum=&BisAusserkrafttretedatum=&NormabschnittnummerKombination=Und&ImRisSeit
VonDatum=&ImRisSeitBisDatum=&ImRisSeit=Undefined&ResultPageSize=100&Suchwort
e=Gefahrenwahr*&Position=1&SkipToDocumentPage=true.
[4] Horswill, M.S. & McKenna, F.P. (2004). Driver´s hazard perception ability: Situation
awareness on the road. ISBN 0754641988.
[5] Waard, D., Axelsson, A., Berglund, M., Peters, B. & Weikert, C. (2010). Human factors as
system view of human, technology and organization, Maastricht: Shaker Publishing. ISBN
978-9042303959.
[6] Nickel, M. & Hugemann, W. (2003) Longitudinal and lateral accelerations in everyday traffic
(in German). Retrieved December 10, 2020, from
https://www.researchgate.net/publication/237485864_LANGS-
_UND_QUERBESCHLEUNIGUNGEN_IM_ALLTAGSVERKEHR.
[7] Kolla, E., Vertal, P., Fallast, K., Huber, G., Franz, G., Neuschmied, H., Thallinger, G. &
Krebs, F. (2019). Evaluation of SIMMARC: An Audiovisual System for the Detection of
Near-Miss Accidents. DOI: 10.1007/978-3-030-38822-5_13.
[8] Ondruš, J. & Kolla, E. (2017). Practical use of the braking attributes measurements results.
DOI: 10.1051/matecconf/201713400044.
[9] Kubjatko, T., Görtz, M., Macurová, Ľ. & Ballay, M. (2018). Synergy of forensic and security
engineering in relation to the model of deformation energies on vehicles after traffic
accidents. DOI: 10.14669/AM.VOL84.ART11.
[10] Böhm, K., Kubjatko, T., Paula, D. & Schweiger, H-G. (2020). New developments on EDR
(Event Data Recorder) for automated vehicles. DOI: 10.1515/eng-2020-0007.
89You can also read