Sodium Chloride Concentration Measurement via Optical Fiber Tip Sensor - IOPscience
←
→
Page content transcription
If your browser does not render page correctly, please read the page content below

IOP Conference Series: Materials Science and Engineering

PAPER • OPEN ACCESS

Sodium Chloride Concentration Measurement via Optical Fiber Tip
Sensor
To cite this article: P N S S Ja’afar et al 2021 IOP Conf. Ser.: Mater. Sci. Eng. 1051 012030

View the article online for updates and enhancements.

 This content was downloaded from IP address 46.4.80.155 on 23/05/2021 at 03:05
ICATAS-MJJIC 2020 IOP Publishing
IOP Conf. Series: Materials Science and Engineering 1051 (2021) 012030 doi:10.1088/1757-899X/1051/1/012030

Sodium Chloride Concentration Measurement via Optical
Fiber Tip Sensor

 P N S S Ja’afar1, N M Razali1, S Ambran1*, F Ahmad1

 1
 Department of Electronis System Engineering, Malaysia – Japan International
 Institute of Technology, Universiti Teknologi Malaysia, Kuala Lumpur, Malaysia

 *Corresponding author: sumiaty.kl@utm.my

 Abstract. Sodium chloride (NaCl) is an essential compound that human needs mainly to
 regulate the amount of water in body. However, the level intake of NaCl daily consumption
 should wisely be regulated. Previously, various techniques have been employed to measure
 NaCl concentrations but high cost and complex fabrication become one of the limitations that
 need to be overcome. Thus, this paper demonstrates a sodium chloride (NaCl) concentration
 measurement using an optical fiber tip sensor. The flat end facet of single – mode fiber was
 used to emit the broadband light at near infrared wavelength region to detect NaCl at different
 concentration ranging from 0% – 4%. The optical power reading was recorded at every
 increment of 0.5% of NaCl concentration. When the aqueous NaCl was dropped onto the
 sensing region, the optical power decreases as the NaCl concentration increases. This
 experiment has shown that the sensitivity achieved by this sensor was 0.1239 dBm/% with
 regression value up to 0.999.

1. Introduction
Sodium Chloride (NaCl) is also known as salt in chemical term, is made up of sodium (Na+) and
chloride (Cl–) ions [1]. It appears as crystalline cubes, soluble in water and give a salty taste. Salt most
commonly used in food industry for food seasoning or natural preservative [2]. While in medical
industry, NaCl is used as for fluid loss treatment and NaCl balance, helping the patients that are
incapable to take nutrients and fluids by mouth [3]. Nutritionally, NaCl are essential to regulate the
amount of water in human body [4] and maintain the condition of blood pressure especially to
individual who are in their middle-aged to elderly with a family history of hypertension [5].
 Even though the intake of NaCl is important, its level in the body should wisely be regulated. It is
advised to aware with average daily consumption which not too little or too much because it can be
harmful to human health. The World Health Organization (WHO) had standardize the
recommendation dietary salt intake is around 5g per day [6] and those have risk of heart disease are
better to consume less than 2 grams of sodium per day [7]. Excessive level can cause hypernatremia,
but lack of NaCl can cause hyponatremia [8, 9]. Extremes hyponatremia can lead to muscle twitches
and seizures. While hypernatremia involves in dehydration due to not drinking enough fluids, diarrhea,
diuretics and kidney dysfunction [10].
 Based on previous studies, various techniques have been employed to measure the concentration of
NaCl via optical fiber sensors such as long period fiber gratings (LPFGs) [11], surface plasmon

 Content from this work may be used under the terms of the Creative Commons Attribution 3.0 licence. Any further distribution
 of this work must maintain attribution to the author(s) and the title of the work, journal citation and DOI.
Published under licence by IOP Publishing Ltd 1
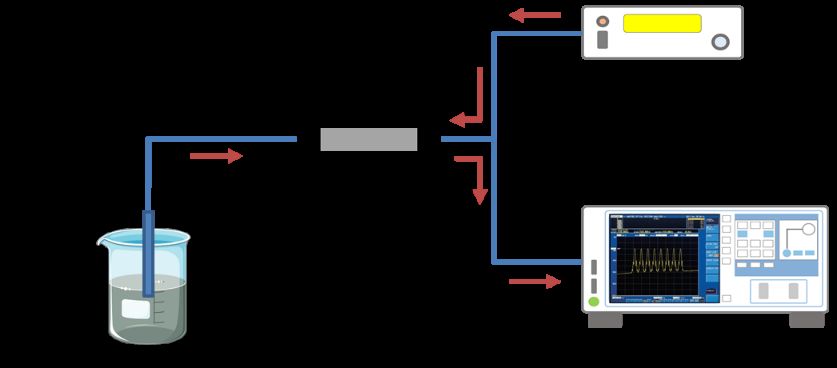
ICATAS-MJJIC 2020 IOP Publishing
IOP Conf. Series: Materials Science and Engineering 1051 (2021) 012030 doi:10.1088/1757-899X/1051/1/012030

resonance (SPR) [12], and tapered plastic multimode (PMM) [13]. However, there are some
limitations need to be considered including complex sensor fabrication and high cost.
 Thus, this paper proposed an optical fiber tip sensor to monitor the NaCl concentration. The main
advantage of this sensor is on the fabrication process. Due to simple step of fabrication process, an
optical fiber tip sensor has attracted attention in sensing field with the fabrication of flat end-facet
sensing surface by only cleaving the tip of the optical fiber [14]. Previously, optical fiber tip sensor
has been utilized for measuring acetone, methanol, benzene concentration [15], ethanol and sucrose
level [16].
 Based on these references, it is proven that optical fiber tip sensor can be utilized for monitoring
NaCl concentration. Therefore, an optical fiber tip sensor for NaCl concentration measurement is
proposed and demonstrates. The proposed sensor measures the output reading and monitor the changes
of optical power at different concentrations influenced by the interaction of Fresnel’s reflection
produced at the boundary between the fiber tip and the analyte solutions. This work offers simplicity,
reliability, and continuous capability of measurement.

2. Research Methodology
A single-mode fiber (Corning SMF-28e) with the core and cladding diameters of 9 μm and 125 μm
respectively was used. This experiment used SMF as the sensor because it produces low light loss [17]
and has better performance in measuring small phase changes in light transmitted through the sensing
region [18]. Next, the tip was cleaved by using a high precision cleaver to produce a flat end surface.
The sensor characterization for NaCl concentration measurement was carried out by the experimental
setup shown in Figure 1.

Figure 1. Experimental setup for the purposed NaCl concentration detection using a single-mode
optical fiber tip sensor

 The experimental setup consists of broadband light source (Fiberlabs – ASE FL7004), optical
circulator (Thorlabs – 6015-3-FC) and optical spectrum analyzer (Thorlabs – OSA205C). OSA is used
to monitor and record the sensing spectrum at ideal wavelength, 1550 nm. This is because 1550 nm
has low loss absorption of the glass material used in optical fiber is minimum, 0.2 dB/km. The
broadband spectrum is required to trace both optical power and wavelength changes. The optical
circulator is used to allow the transduced light (Fresnel light) travel in only one direction from the
sensing region directly to the OSA for monitoring sensing response. To reduce any physical
disturbance, the sensor was fixed inside the beaker and allowing the immersion of tip onto the mixture.
 Figure 2 shows the process of NaCl samples preparation. For continuous monitoring purposes, the
analyte was prepared by adding 0.5g of NaCl powder (R&M Chemicals) to increase the concentration.
To begin with, a 100mL of deionized (DI) water is poured into a beaker and placed on the hot plate.
Whilst stirring in a moderate speed, the first concentrated sample is made by adding 0.5g of NaCl
powder into the beaker and continue stirring the mixture for 6 minutes to ensure homogeneity. The

 2

ICATAS-MJJIC 2020 IOP Publishing
IOP Conf. Series: Materials Science and Engineering 1051 (2021) 012030 doi:10.1088/1757-899X/1051/1/012030

following sample was continued by adding another 0.5g of NaCl powder into the same beaker to get a
various NaCl concentration ranging from 0 - 4 %.

 Figure 2. Concentrated NaCl sample preparation for continuous measurement

 Due to limited instrument to measure the analyte refractive index at near infrared wavelength, the
refractive indices of all samples were determined by using a digital refractometer (Atago – PALRI
3850) operating at UV wavelength. DI water is used to calibrate the refractometer before
measurements to ensure the neutralization of the device. The experiment was repeated for three cycles
and conducted in a constant room temperature (23°C). To determine the NaCl concentration, the
concentration can be calculated by using Equation (1).

 !"## %& '"() *%+,-. (0) (1)
 Concentration (wt%) = x 100%
 !"## %& #%)234%5 (0)

2.1. Sensing Mechanism
As illustrates in Figure 3, the sensing principle is mainly based on Fresnel reflection, that occurs at the
coupling interfaces between the tip of optical fiber and the analyte that have different refractive
indices. Theoretically, some of the light will be transmitted and some of the light will be reflected
once the light propagates through a boundary that have different refractive index. The intensity of
reflection can be determined as in Equation (2).

 6 − 7 8 (2)
 = 1 5
 6 + 7

where 6 is the refractive index of the core optical fiber and 7 is the refractive index of the analyte
contacted at the core. The working principle of the proposed sensor used in this work is illustrated as
in Figure 3. Fresnel reflection occured at the sensing region will arising when the different
composition of 7 changes.

 3
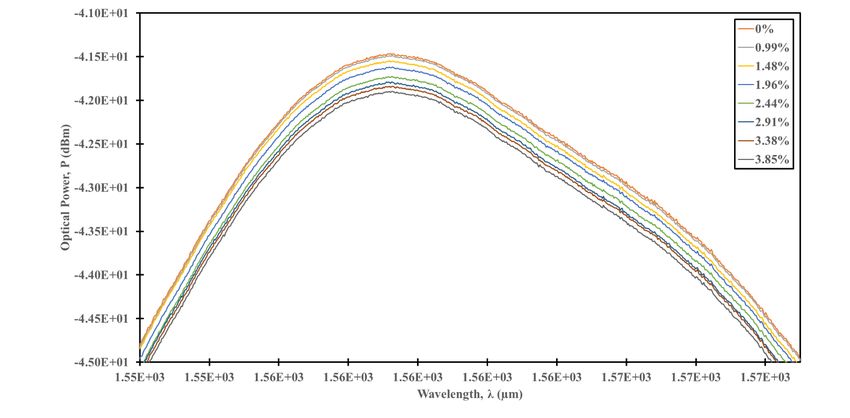
ICATAS-MJJIC 2020 IOP Publishing
IOP Conf. Series: Materials Science and Engineering 1051 (2021) 012030 doi:10.1088/1757-899X/1051/1/012030

 Figure 3. Working principle of the proposed optical fiber tip sensor

3. Result and Discussion
As depicted in Figure 4, the refractive index of the NaCl concentration samples was recorded and
analyzed for reference purposed. As the NaCl concentration increases from 0% – 4%, its refractive
index also increases from 1.3358 to 1.3421 with total changes of 0.0063. Based on the plotted graph, it
is worth to mention that the changes in chemical composition will affect the refractive index of the
analyte.

 Figure 4. Refractive indices of NaCl concentration samples at 0% – 4%

 Figure 5 shows the sensing spectra of the first cycle of experiment when measuring the NaCl
concentrations. The full optical sensing spectrum images throughout all measurements are plotted as in
Figure 5(a). From the inset image in Figure 5(b), there is no significant spectral changes shown by the
proposed sensor towards the NaCl concentration changes. Initially, at 0% of NaCl concentration, the
light propagates at -42.243 dBm, but slowly decreases to -42.699 dBm when the NaCl concentration
increased up to 4%.

 4
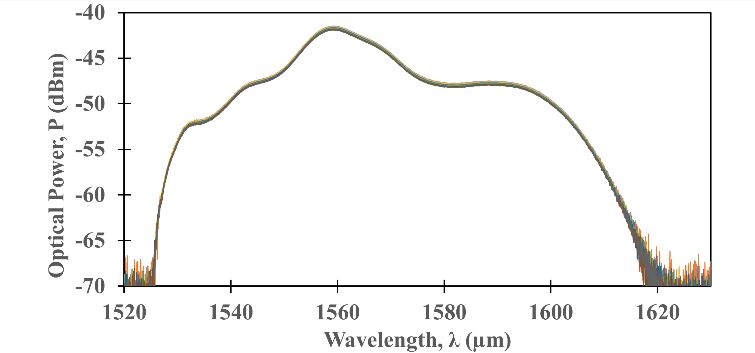
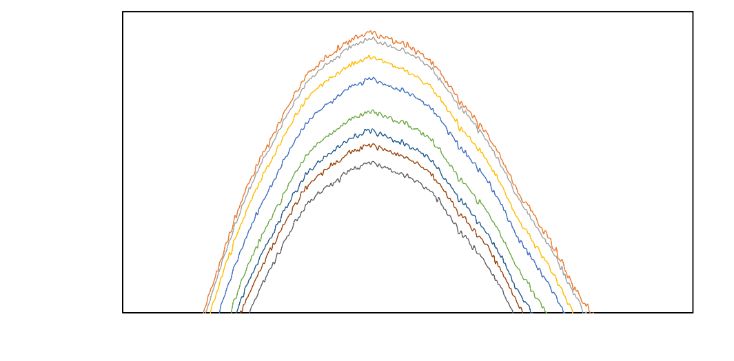
ICATAS-MJJIC 2020 IOP Publishing
IOP Conf. Series: Materials Science and Engineering 1051 (2021) 012030 doi:10.1088/1757-899X/1051/1/012030

 (a) (b)
 Figure 5. The sensing spectrum (a) full spectra (b) inset image of peak spectra

 Figure 6 shows the analysis of the optical power and wavelength changes from the sensing
spectrum. As can be seen from Figure 6(a), the peak wavelength at 1559 nm are constant for each
NaCl concentration. Hence, the sensor performance was evaluated based on the optical power
changes. Figure 6(b) shows the optical power changes towards the NaCl concentration. The optical
power decreases as the NaCl concentration increases. The total power loss for the experiment is
0.4746 dBm with initial reflected light of -41.4323 dBm is then reduced to -41.9067. It shows that the
optical power linearly decreases as the concentration of NaCl increases. The sensor sensitivity can be
determined from the slope of the graph. The sensitivity achieved by this sensor is 0.1239 dBm/% with
a linear regression value up to 0.9.

 (a) (b)
 Figure 6. Analysis of the sensing spectrum based on (a) optical power (b) wavelength changes

 Table 1 summarizes the sensor performance of the experiment for three repeated cycles and give
the average sensitivity of 0.1150 dBm/% and the linearity of 98.10%. The sensitivity of the sensor is
recorded from three repeated cycles and evaluated based on their standard deviation. The evaluation is
needed to monitor the changes in the results. The sensor sensitivity has a standard deviation of 0.0126
which shows low variation in sensitivity between three repeated experiments. All three sensors
sensitivity is close to the average value, hence define the sensor has high possibility to produce a
constant sensitivity for any repeated experiment.

 5
ICATAS-MJJIC 2020 IOP Publishing
IOP Conf. Series: Materials Science and Engineering 1051 (2021) 012030 doi:10.1088/1757-899X/1051/1/012030

 Table 1. Optical fiber tip sensor performance towards NaCl concentration at three repeated
 experiment

 No. of Cycles 1 2 3
 Sensor Sensitivity (dBm/%) 0.1239 0.1006 0.1206
 Regression Coefficient, R2 0.999 0.9655 0.9785
 Average Sensitivity (dBm/%) 0.1150
 Linearity (%) 98.10
 Standard Deviation of the Sensitivity for 0.0126
 three repeated experiment

4. Conclusion
In summary, the application of optical fiber tip sensor for NaCl concentration measurement from 0% –
4% of concentration has been succesfully demonstrated. The proposed sensor provides a good
performance at average sensitivity of 0.1150 dBm/%, average linearity of 98.10% and standard
deviations of 0.0126. The optical fiber tip sensor is easily and inexpensively fabricated. As the sensor
is sensitive towards the NaCl concentrations ranging 0 – 4%, which encompass the WHO
recommendation daily NaCl consumption intake of 5g, making this an important early stage towards
development of simple, sensitive and low-cost sensor to monitor the NaCl concentration in any foods.
This direct detection of NaCl concentration is a considerable interest in this work.

5. References
[1] Cracolice M S and Peters E I 2020 Introductory Chemistry: An Active Learning Approach:
 Cengage Learning)
[2] Brul S and Coote P 1999 Preservative agents in foods. Mode of action and microbial
 resistance mechanisms Int J Food Microbiol 50 1-17
[3] de Felippe Jr J, Timoner J, Velasco I and Lopes O 1980 Treatment of refractory hypovolaemic
 shock by 7· 5% sodium chloride injections The Lancet 316 1002-4
[4] Rakova N, Kitada K, Lerchl K, Dahlmann A, Birukov A, Daub S, Kopp C, Pedchenko T,
 Zhang Y, Beck L, Johannes B, Marton A, Muller D N, Rauh M, Luft F C and Titze J 2017
 Increased salt consumption induces body water conservation and decreases fluid intake J Clin
 Invest 127 1932-43
[5] Nho H, Tanaka K, Kim H S, Watanabe Y and Hiyama T 1998 Exercise training in female
 patients with a family history of hypertension Eur J Appl Physiol Occup Physiol 78 1-6
[6] Organization W H 2007 Reducing salt intake in populations: report of a WHO forum and
 technical meeting, 5-7 October 2006, Paris, France
[7] Neal B, Yangfeng W and Li N 2007 The effectiveness and costs of population interventions to
 reduce salt consumption
[8] Furukawa S, Takaya A, Nakagawa T, Sakaguchi I and Nishi K 2011 Fatal hypernatremia due
 to drinking a large quantity of shoyu (Japanese soy sauce) Journal of forensic and legal
 medicine 18 91-2
[9] Sahay M and Sahay R 2014 Hyponatremia: A practical approach Indian J Endocrinol Metab
 18 760-71
[10] Andreoli T E 2000 Water: Normal Balance, Hyponatremia, and Hypernatremia Ren Fail 22
 711-35
[11] Coelho L, Santos J, Jorge P and de Almeida J 2017 Optical fiber sensor for early warning of
 corrosion of metal structures. In: OCEANS 2017-Aberdeen: IEEE) pp 1-5
[12] Feng L H, Zeng J, Liang D K and Liu H Y 2012 Surface plasmon resonance spectral based
 fiber optic sensor for detection of total dissolved solids in water quality analysis Guang Pu
 Xue Yu Guang Pu Fen Xi 32 2929-34

 6
ICATAS-MJJIC 2020 IOP Publishing
IOP Conf. Series: Materials Science and Engineering 1051 (2021) 012030 doi:10.1088/1757-899X/1051/1/012030

[13] Rahman H A, Harun S W, Yasin M, Phang S W, Damanhuri S S A, Arof H and Ahmad H
 2011 Tapered plastic multimode fiber sensor for salinity detection Sensors and Actuators A:
 Physical 171 219-22
[14] Yuan J, Zhao C, Ye M, Kang J, Zhang Z and Jin S 2014 A Fresnel reflection-based optical
 fiber sensor system for remote refractive index measurement using an OTDR Photonic
 sensors 4 48-52
[15] Xu W, Huang X G and Pan J S 2012 Simple fiber-optic refractive index sensor based on
 fresnel reflection and optical switch IEEE Sensors Journal 13 1571-4
[16] Fujiwara E, Ono E and Suzuki C K 2012 Application of an optical fiber sensor on the
 determination of sucrose and ethanol concentrations in process streams and effluents of
 sugarcane bioethanol industry IEEE Sensors Journal 12 2839-43
[17] Miya T, Kawana A, Terunuma Y and Hosaka T 1980 Fabrication of single-mode fibers for 1.5
 µm wavelength region IEICE Transactions (1976-1990) 63 514-9
[18] Razali N M, Ja’afar P N S S and Ambran S 2020 Performance evaluation of a single mode
 optical fiber tip sensor for glucose detection Indonesian Journal of Electrical Engineering and
 Computer Science 19 1407-13

 7
You can also read