Mechanism Exploration of 3-Hinge Gyral Formation and Pattern Recognition - Oxford Academic
←
→
Page content transcription
If your browser does not render page correctly, please read the page content below
Cerebral Cortex Communications, 2021, 2, 1–15

                                                                            doi: 10.1093/texcom/tgab044
                                                                            Original Article

ORIGINAL ARTICLE

                                                                                                                                                        Downloaded from https://academic.oup.com/cercorcomms/article/2/3/tgab044/6313975 by guest on 25 December 2021
Mechanism Exploration of 3-Hinge Gyral Formation
and Pattern Recognition
Mir Jalil Razavi1 , Tianming Liu2 and Xianqiao Wang3
1 Department  of Mechanical Engineering, Binghamton University, Binghamton, NY 13902, USA, 2 Cortical
Architecture Imaging and Discovery Lab, Department of Computer Science and Bioimaging Research Center,
The University of Georgia, Athens, GA 30602, USA and 3 School of Environmental, Civil, Agricultural, and
Mechanical Engineering, College of Engineering, the University of Georgia, Athens, GA 30602, USA
∗ Address   correspondence to Xianqiao Wang. Email: xqwang@uga.edu

Abstract
The 3-hinge gyral folding is the conjunction of gyrus crest lines from three different orientations. Previous studies have not
explored the possible mechanisms of formation of such 3-hinge gyri, which are preserved across species in primate brains.
We develop a biomechanical model to mimic the formation of 3-hinge patterns on a real brain and determine how special
types of 3-hinge patterns form in certain areas of the model. Our computational and experimental imaging results show that
most tertiary convolutions and exact locations of 3-hinge patterns after growth and folding are unpredictable, but they help
explain the consistency of locations and patterns of certain 3-hinge patterns. Growing fibers within the white matter is
posited as a determining factor to affect the location and shape of these 3-hinge patterns. Even if the growing fibers do not
exert strong enough forces to guide gyrification directly, they still may seed a heterogeneous growth profile that leads to the
formation of 3-hinge patterns in specific locations. A minor difference in initial morphology between two growing model
brains can lead to distinct numbers and locations of 3-hinge patterns after folding.

Key words: 3-hinge gyri, axon fiber density, cortical folding, differential growth

Introduction                                                                autism spectrum disorder (ASD), and schizophrenia (Kulynych
                                                                            et al. 1997; Levine and Barnes 1999; White et al. 2003; Harris
Cortical convolution or cortical folding is a prominent charac-             et al. 2004; Tortori-Donati et al. 2005; Kapellou et al. 2006; Schaer
teristic of the mammalian cerebral cortex. There are several                et al. 2006; Van Essen et al. 2006; Nordahl et al. 2007; Wisco et al.
studies that have discussed that the study of cortical folding              2007; Csernansky et al. 2008; Guerrini et al. 2008; Kennedy and
could help us to better understand the normal development of                Courchesne 2008; Pang et al. 2008; Raybaud and Widjaja 2011; Sun
the human brain during the gestation period (Armstrong et al.               and Hevner 2014; Budday 2014a).
1993; Harris et al. 2004; Duchesnay et al. 2007; Wisco et al. 2007;             Cortical folding has multiple stages: primary, secondary, and
Fischl et al. 2008; Geng et al. 2009; Hu et al. 2010; Xu et al. 2010;       tertiary, which all take several months to complete (Sun and
Zilles et al. 2013; Bayly et al. 2014). Abnormal cortical folding           Hevner 2014; Budday et al. 2015c). Primary folding has been
in the fetal stage leads to cognitive or physiological difficulties         studied very well, while secondary and tertiary folding mecha-
and problems, for example, epilepsy, intellectual disabilities and          nisms are still quite unclear, leading to a need for more inves-

Received: 18 March 2021; Revised: 22 June 2021; Accepted: 24 June 2021

© The Author(s) 2021. Published by Oxford University Press.
This is an Open Access article distributed under the terms of the Creative Commons Attribution License (http://creativecommons.org/licenses/by/4.0/),
which permits unrestricted reuse, distribution, and reproduction in any medium, provided the original work is properly cited.

                                                                                                                                               1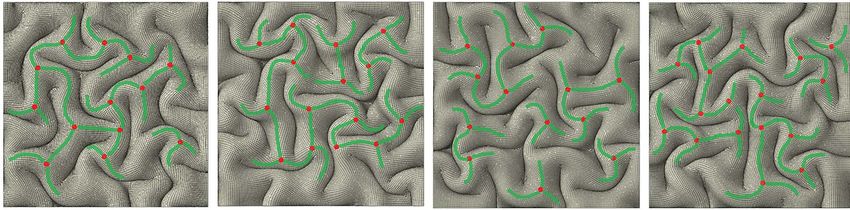
2      Cerebral Cortex Communications, 2021, Vol. 2, No. 3

tigations into the development of the developing complex mor-                 species does not show a clear association between brain size and
phology. Primary folding is notably preserved among individuals               number of 3-hinge patterns (Li et al. 2017). In our previous work,
(Lohmann et al. 2008), while secondary and tertiary folding evolve            we focused on the potential contribution of the dense growing
after primary folding is completed and can vary widely across                 axon fibers to the 3-hinges formation besides the differential
individuals (Gilles et al. 1983). It is believed that differential            growth in white and gray matters. However, it has not addressed
growth within the cortex is a possible stimulus for secondary                 the consistency of locations and patterns of certain 3-hinge
and tertiary folding (Richman et al. 1975; Tallinen et al. 2016).             patterns we have observed in cortical folding. Therefore, there
According to the tangential differential growth hypothesis, the               is a critical need to develop a unified biomechanical principle to
outer layers of brain show more rapid growth than the inner                   explain how the intrinsic relationships between cortical folding
layers. This growth rate mismatch acts as the driving mechanism               and structural connection patterns in brains lead to the for-
for brain structure instability and gyrification. The tangential              mation of the observed highly convoluted 3-hinge patterns and
differential growth hypothesis has been proven by recent exper-               to provide a novel diagnostic for neurological disorders useable

                                                                                                                                                   Downloaded from https://academic.oup.com/cercorcomms/article/2/3/tgab044/6313975 by guest on 25 December 2021
imental and computational analyses (Ronan et al. 2014; Razavi                 during early brain development. As an example, by a comparative
et al. 2015a, 2015b; Tallinen et al. 2016), although it is believed that      MRI study among control group and ASD group in their gyral
other factors such as axon fiber position and growth also play a              hinge morphology, we observed that the identified difference in
nonnegligible role in the regulation of morphology (Holland et al.            morphology and spatial distribution of 3-hinge patterns of ASD
2015; Zhang et al. 2016, 2017).                                               group is associated with the reported functional and cognitive
    Folding patterns of the human cerebral cortex show quite                  differences (Huang et al. 2019). The study helps explain that the
different morphologies between subjects in secondary and ter-                 gyral hinges could be related to brain functions and used as a
tiary foldings (Van Essen et al. 1998; Fischl et al. 1999; Liu et al.         potential indicator for diagnostics.
2004). Evidence also has shown that the folding patterns of the                    In the present work, we test the hypothesis that the dense
human cerebral cortex can predict its cytoarchitecture (Fischl                growing axon fiber pattern may regulate the patterns of the 3-
et al. 2008). Therefore, understanding of the underlying mech-                hinges and help form specific types of 3-hinges and correlate the
anism and quantitative description of folding patterns are two                location, number, and shape of 3-hinges with the fiber patterns.
important research goals. Before outlining the research subject, it           We develop a biomechanical model to reveal underlying mecha-
is necessary to define some concepts, for example, “hinge point.”             nism of the formation of 3-hinge gyral patterns. The geometrical
A hinge point is the point of minimum radius of curvature for                 and mechanical parameters are investigated to understand how
a fold, and when these hinge points on a fold surface connect                 these parameters control the number, location, and shapes of 3-
to each other, a hinge line is formed. As shown in Figure 1a, the             hinge patterns. In order to do so, along with the biomechanical
hinge of a fold is the field of marked curvature adjacent to the              model, we develop an algorithm to automatically detect the
hinge line (Li et al. 2010). Therefore, we can classify human gyral           number, location, and shapes of 3-hinge gyral patterns in in-
folding patterns into three classes according to their numbers                silico models and in the reconstructed 3D images of real brain.
of hinges: 2-hinge, 3-hinge, and 4-hinge gyri, Figure 1b. It has              Moreover, we try to elaborate the structural consistency and
been shown in the literature, including our recent work (Li et al.            inconsistency concepts using mechanical simulation to explain
2010), that the formation of folding patterns on the cortex at                the phenomenon where two individuals with globally distinct
the mesoscale and gyral-scale varies greatly among individuals.               number and shape of 3-hinges patterns might show certain
Therefore, the number of hinge lines connecting to a field can be             preserved 3-hinges patterns.
used to describe the folding pattern of a hinge field on a gyrus (Yu
et al. 2013). It is noteworthy that the 2-hinge structure is degener-
                                                                              Computational Models and Methods
ated with the hinge line and that four gyral crests rarely meet to
form 4-hinge gyri (Li et al. 2010). Thus, we will turn our attention          Constitutive Relationship and Governing Equation of a
to the most common identifiable structure, the 3-hinge pat-                   Growing Brain Model
tern. In contrast to ordinary gyri, gyral hinges are of importance
                                                                              Nonlinear finite element simulation accompanied by the theory
because they have the thickest cortices, the strongest long-range
                                                                              of finite growth was developed to mimic growth and folding of
axonal connections and the most pronounced connective diver-
                                                                              a developing brain. By implementing the theory of multiplicative
sity, and the most aggregative functional profiles (Yu et al. 2013;
                                                                              decomposition (Rodriguez et al. 1994), the deformation gradient
Chen et al. 2014; Jiang et al. 2015, 2018; Li et al. 2017; Ge et al. 2018).
                                                                              F(X) and Jacobian J are decomposed into an elastic element and a
Moreover, these gyral hinges behave more like cortical hubs in
                                                                              growth element. The elastic element describes pure deformation
the corticocortical networks and compose a majority portion of
                                                                              resulting from stresses, and the growth element indicates the
the network’s “core” (Zhang et al. 2020). Quantitative characteri-
                                                                              addition of materials.
zation of gyral folding patterns via hinge numbers with cortical
surfaces constructed from MRI data has been used to identify 6                                             F = A.G                           (1)
common 3-hinge gyral folds that exhibit consistent anatomical
                                                                                                      J = det (F) = Je Jg                    (2)
locations across humans, chimpanzees, and macaques, as well as
2 unique 3-hinge patterns in macaques, 6 in chimpanzees, and 14               Here, F = ∂x/∂X. Points X from the undeformed configuration are
in humans (Li et al. 2017). It is not surprising that the number of 3-        mapped to their new positions x in the deformed configuration.
hinge patterns identified in the human brain is 2.5 and 7.8 times             Although both A and G tensors may be incompatible deforma-
greater than the number found in chimpanzee and macaque                       tions, their multiplication, F, should be a compatible deformation
brains, respectively. Therefore, the shape and number of 3-hinge              (Ben Amar and Goriely 2005). We assume that growth in the
patterns in a growing brain could be a new metric to characterize             cortex is isotropic and defined by the growth ratio, g, in the
the folding of a primate brain. Interestingly, although there is a            growth tensor as:
direct relationship between the number of 3-hinge patterns and
                                                                                                           G = gI                            (3)
brain size across these three species (human, chimpanzee, and
macaque), the analysis of number of 3-hinge patterns in other                                         J = det (G) = g
                                                                                                       g                3
                                                                                                                                             (4)
Mechanism Exploration of 3-Hinge Gyral Formation and Pattern Recognition                                    Razavi et al.         3

                                                                                                                                                                                Downloaded from https://academic.oup.com/cercorcomms/article/2/3/tgab044/6313975 by guest on 25 December 2021
Figure 1. (a) An illustration to show the concepts of hinge points, hinge lines (dotted lines), and gyrus crest. (b) Example illustrations for 2-hinge, 3-hinge, and 4-hinge
patterns.

Here, g is a scalar. According to our previous works (Zhang et al.                       and ventricular zone. In human brains, the cerebral cortex is a
2016; Ge et al. 2018), we model the material property of the brain                       thin (2–4 mm) layer (Bayly et al. 2014), in contrast to the core
with a hyperelastic material incorporating a strain energy func-                         that has a much greater thickness of around 50 mm (Tallinen
tion W(A). We characterize the constitutive behavior through                             et al. 2014). The dimension of the model was selected based on
the following neo-Hookean free energy equation, parameterized                            experimental data gathered from small pieces of a brain. The
exclusively in terms of the elastic tensor A and its Jacobian J.                         dimension of the base model was 60 mm × 60 mm × 50 mm (not
                                                                                         including cortical thickness), and the thickness of the cortex was
                          1    2   1                                                     variable across different models in order to trace the relationship
                   W=       λln J + μ [A : A − 3 − 2 ln J]                     (5)       between cortical thickness and the number of 3-hinge patterns.
                          2        2
                                                                                         The thickness of the cortex and white matter before cortical
Here, λ and μ are Lamé constants. Following standard arguments                           folding was set to 1.5 and 50 mm, respectively. However, in the
of thermodynamics, the Piola stress P follows as energetically                           study of the effect of cortex’s thickness on the 3-hinge geomet-
conjugate to the deformation gradient:                                                   rical and mechanical features, the initial cortex’s thickness is
                                                                                         set to vary from 1 to 2 mm. Symmetric boundary conditions
                                                                                         were applied on four sides of the model and the bottom surface
                                       ∂W
                                P=J       · G−T                                (6)       of the core was fixed. The dimension of the model was large
                                       ∂F
                                                                                         enough in comparison with the wavelength of folded patterns
                                                                                         observed in experiments so as to prevent boundary effects. In
  In the absence of body forces, mechanical equilibrium
                                                                                         a bilayer model with an isotropic growth for both cortex and
imposes:
                                                                                         subcortex without stress-dependent growth and no boundary
                                   Div P = 0                                   (7)       confinement, only their relative growth ratio is a determinant
                                                                                         factor for instability and folding. Also in a human premature
   For all parts of the model (white matter, gray matter, and                            brain, the volume of the cortical plate increases by fourfold in the
axonal fibers), a similar shear modulus of 0.5 kPa was used                              first 2 months (22–30 GWs), while the subplate plus intermediate
(Budday et al. 2015c).                                                                   zone (SP + IZ) increases approximately by threefold (Scott et al.
                                                                                         2011). In our recent analytical–computational study, we have
                                                                                         already shown that the growth ratio of 4/3 between two distinct
Computational Model of a Growing Brain                                                   layers is sufficient enough to trigger the structural instability
We constructed a three-dimensional (3D) double-layer model as                            (Razavi, Zhang, Li, et al. 2015a). This ratio is independent of the
a small piece of the brain to explore the fundamental mechanism                          growth ratios’ absolute values. Without loss of generality, we set
of cortical folding and 3-hinge pattern formation, as demon-                             the cortex to grow gradually with no growth in the core (Tallinen
strated in Figure 2. This model has previously been used to study                        et al. 2014; Zhang et al. 2016). The growth of the cortex was
consistent gyrus formation and also fiber density effect on 3-                           assumed to be linear in time:
hinge formation (Ge et al. 2018). Since the main purpose of this
study is to investigate mechanisms of 3-hinge pattern formation                                                            ġcortex = gct                                 (8)
rather than the effect of the geometry of the model, a flat
structure was selected despite the fact that curvature has a con-
siderable effect on convolution patterning (Budday et al. 2015c).                        Here, gct is a cortex growth constant rate. Previous study has
In the finite element model, a thin top layer represents the cortex                      shown that brain growth and folding take place in a long period
(cortical plate). The bottom layer is the core, which is supposed                        of time without immediate growth activation (Zöllner et al. 2012).
to be a simple representation of the subplate, intermediate zone,                        Axonal fibers can elongate under the tensional axial forces as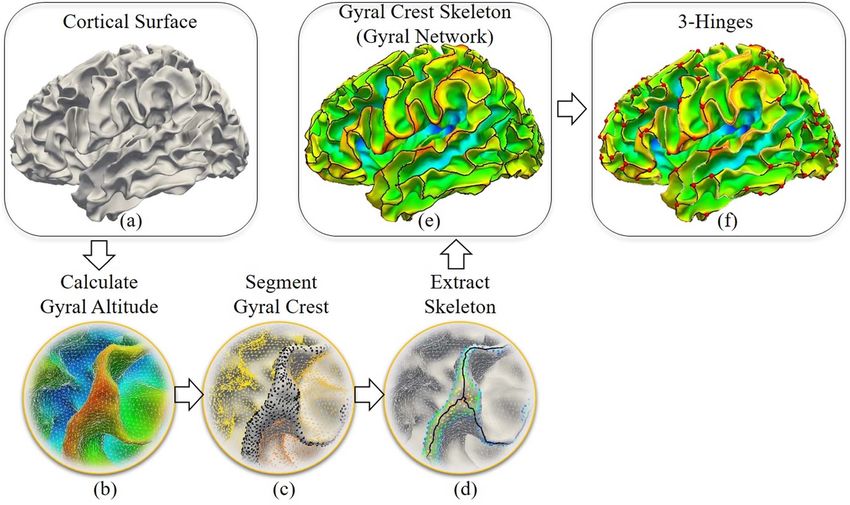
4      Cerebral Cortex Communications, 2021, Vol. 2, No. 3

Figure 2. A piece of brain selected to construct finite element model.

                                                                                                                                                    Downloaded from https://academic.oup.com/cercorcomms/article/2/3/tgab044/6313975 by guest on 25 December 2021
a soft slender structure, but their creep behavior and change            growth. In a real brain, this perturbation could stem from the
in the cross-section by the time due to stress accumulation are          variation of curvature or heterogeneous growth on distant sites
not modeled in this study (Lamoureux et al. 2010). We believe            of the brain. The amplitude of the checkerboard perturbation (z )
that the assumption, namely decoupling the axonal fiber growth           applied in the model brains is 1% of the thickness with a relation
from stress state, does not have a considerable effect on the            as follows:
results of the study. Another point is worthwhile to mention that
                                                                                            z = A0 sin (ωx) + sin ωy                    (9)
the behavior of axonal fibers inside the surrounding GS might
differ from what we can see from the microneedle experiments             where A0 is the amplitude and ω is the wavelength. The subscript
(Dennerll et al. 1989). Experimental studies (Bray 1984; Dennerll        “z” indicates the normal direction to the cortex surface. The ω in
et al. 1989; Lamoureux et al. 2010) have shown that axonal fibers        each 30 models is different, so every model has different initial
under deformation show a towed growth response (Zöllner et al.           perturbations.
2012), chronic lengthening/shortening to maintain a desired level            There are two types of growths in axon fiber bundles: 1)
of axonal tension. However, because cortical folding completes in        growth due to mechanical tension and 2) intrinsic biological
a long time scale, as the first-order approximation, a nonlinear         growth. For the first type of growth, fiber bundles emanate from
hyperelastic material model without tension-driven growth has            the base of the model all the way to the interface of the cortex
been adopted to study the behavior of the axonal fibers in this          and white matter, which are assumed to be elastic and can
study similar to the other micromechanical modeling studies              grow due to mechanical stress, called the tension-based growth.
including axonal fibers (Pan et al. 2013; Ahmadian 2018, Hoursan         This tension-based growth in axon fiber bundles depends on
et al. 2020; Yousefsani et al. 2018).                                    the mechanical stress state of cortical foldings and therefore
    Growth in the model was simulated by thermal expansion               dynamically varies with the stress state changes. With respect
(Razavi and Wang 2015; Razavi et al. 2015a). For further under-          to biological intrinsic growth, we assumed that axon fiber grows
standing of the analogy between the volumetric growth model              along the fiber axial direction and assigns a thermal expansion to
and thermal stress model, please check reference (Cao et al.             mimic it ( Cao, Jia, et al. 2012a). In this study, we set the biological
2012a, 2012b). By adjusting the thermal expansion coefficient to         intrinsic growth to be a constant growth. Growth in axonal fibers
the cortex and increasing temperature in dynamic steps, the cor-         is defined as:
tex expands, destabilizes, and then starts to fold. Finite element
models were constructed, meshed, and solved using the ABAQUS                                           ġaxon = gaf                         (10)
FE package, which is suitable for large deformation, nonlinear,          where gaf is an axonal fiber growth constant rate. Therefore, the
and quasistatic problems. The mesh size was selected as small            growth tensor for the axonal fiber is:
enough to make qualitative features of the model independent
from mesh size. Material properties of the cortex and core were
                                                                                                G = gaxon − 1 z ⊗ z + I                     (11)
supposed to be same, since there is no substantial difference
between gray matter and white matter material properties (Bud-
day et al. 2015b; Tallinen et al. 2016).                                     In the models, z shows a unit vector aligned with the axial
    A series of initial small perturbations were introduced into         direction. Increasing the temperature by time causes only the
the models to check the effect of initial perturbations on 3-hinge       axonal fibers to grow in axial direction.
patterns after convolution. Convolution patterns after instability           However, with combined tension-based growth and the
are not guaranteed to be exactly symmetric although the initial          intrinsic growth, the resultant growth of axon fiber bundles
model is symmetric (Tallinen et al. 2013; Tallinen and Biggins           varies across the entire cortex and along the entire process of
2015). Applying a small initial perturbation (e.g., displacement         cortical folding. As demonstrated in our prior study (Ge et al.
perturbation, force perturbation, or mech defects) in mechanical         2018), the axon fiber density concentration has been observed
models for triggering instability is a common method. There are          to be highest at the hinge point of 3-hinge patterns and decays
a lot of studies that have applied small initial perturbations in        gradually along the hinge spoke. Therefore, in our model brain,
their growth models for mimicking the biological or mechanical           we assumed that the hinge junction has the highest axial
postperturbation behaviors (Cai et al. 2012; Zang et al. 2012; Cao,      intrinsic growth with its growth rate being equal to the growth
Jia, et al. 2012a; Bayly et al. 2013; Budday et al. 2014b; Wang and      rate of the cortex. gaxon is the maximum growth ratio at the 3-
Zhao 2015; Budday, Kuhl, et al. 2015a). In our model brain, we           hinge junctions accompanied by growth ratios along the hinge
apply a small initial perturbation as a trigger of instability after     lines decaying proportionally from gaxon to 0. The growth in the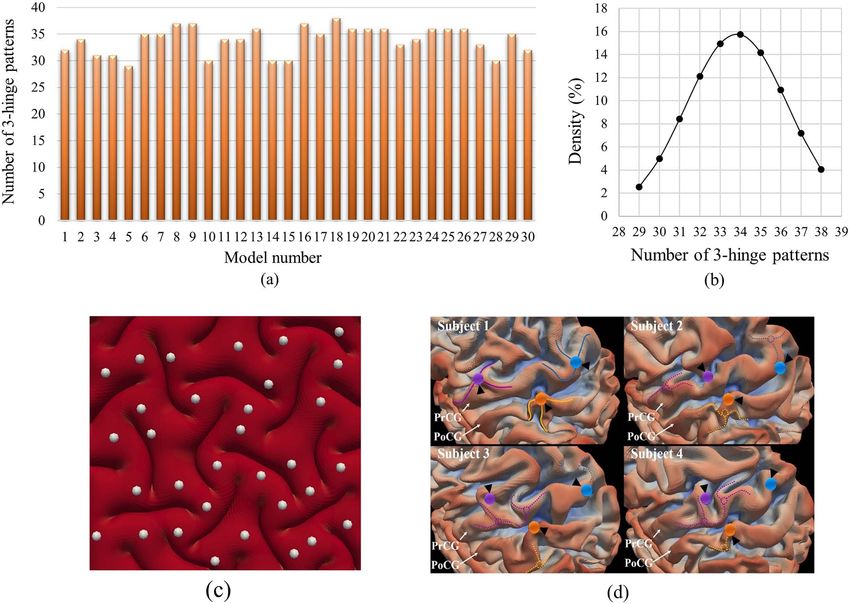
Mechanism Exploration of 3-Hinge Gyral Formation and Pattern Recognition               Razavi et al.      5

Table 1. Structural session imaging parameters in HCP 868 dataset

Type           Description         TR (ms)        TE (ms)        Flip angle        FOV (mm)         Voxel size               Acquisition
                                                                                                                             time (min:s)

T1w            3D MPRAGE           2400           2.14           8 deg             224 × 224        0.7 mm isotropic         7:40
T2w            3D T2-SPACE         3200           565            Variable          224 × 224        0.7 mm isotropic         8:24

fiber bundles is not isotropic. The hinge lines that include fibers    et al. 2017). The aim of gyral net extraction is to separate gyral
grow only in the axial direction (axial direction is normal to the     crests from other cortical regions and then skeletonize them
surface of the cortex). In this study, we also assume that the         to present them as a gyral network. The 3-hinge patterns are

                                                                                                                                               Downloaded from https://academic.oup.com/cercorcomms/article/2/3/tgab044/6313975 by guest on 25 December 2021
scaler value of gaf of axonal fibers is equal to gct .                 defined as the joints of such network for which the degree of con-
                                                                       nection is equal to 3. Briefly, the pipeline consists of two major
                                                                       steps: 1) Gyral crest segmentation: We defined the “midsurface”
Brain Imaging Data and Preprocessing                                   as a line that separates gyri and sulci. This “midsurface” is chosen
                                                                       so that the mean of the displacements of all surface vertices
The Q3 release of Human Connectome Project (https://www.hu
                                                                       from their original locations is zero. Gyral altitude for a vertex
manconnectome.org) data was used in this study. All HCP sub-
                                                                       is defined as the movement from its original location to the
jects were scanned on a customized Siemens 3 T “Connectome
                                                                       “midsurface” in the surface normal direction, Figure 3b. Based
Skyra.” As we focused on cortical morphology, the white matter
                                                                       on these definitions, the watershed algorithm (Bertrand 2005) is
surfaces reconstructed from structural MR scans of 868 healthy
                                                                       adopted to segment the gyral crest (regions over an altitude level,
subjects were of our major interest. Important structural ses-
                                                                       black dots in Fig. 3c). More details and effects of the watershed
sion imaging parameters are listed in Table 1. The white matter
                                                                       algorithm can be found in our previous works (Chen et al. 2017). 2)
surfaces have been produced via the version 3 preprocessing
                                                                       Gyral skeleton extraction: This step is to skeletonize gyral crests,
pipelines. Diffusion MRI data were also used to exhibit the dis-
                                                                       as seen in Figure 3d,e. Gyral skeletons are defined as the crest
tribution of axonal fibers shown. A full DTI session includes 6
                                                                       curves located in the central parts of gyral crest. First, a distance
runs, representing 3 different gradient tables. Each gradient table
                                                                       transformation algorithm was conducted on the segmented gyral
includes approximately 90 diffusion weighting directions plus 6
                                                                       crests to highlight their central regions. Then, a tree marching
b = 0 acquisitions interspersed throughout each run. It consists of
                                                                       algorithm was adopted to successively connect the vertices to
three shells of b = 1000, 2000, and 3000 s/mm2 interspersed with
                                                                       form multiple tree-shape graphs. After the redundant branches
an approximately equal number of acquisitions on each shell.
                                                                       were pruned, the major branches were left and taken as the
    The white matter surfaces reconstructed from structural MR
                                                                       skeleton of the gyral crests.
scans were provided by HCP dataset by following the structural
                                                                           This skeleton can be taken as a gyral network. We defined
protocols and data preprocessing pipelines in WU-Minn HCP
                                                                       vertices on this network with degrees more than 2 as gyral
900 Subjects Data Release. To produce the fiber density profile
                                                                       joints, red dots in Figure 3f . Gyral joints with degrees equal to
from diffusion MRI, we firstly performed skull removal, motion
                                                                       3 were defined as 3-hinge patterns and are the major interest of
correction, eddy current correction via FSL (Jenkinson et al. 2012;
                                                                       this work.
Andersson and Sotiropoulos 2016). The model-free generalized
Q-sampling imaging (GQI) method (Yeh et al. 2010) in DSI Studio
was then used to estimate the diffusing orientations. Next, the
deterministic streamline tracking algorithm in DSI Studio (Yeh         Detection of Location and Shape of 3-Hinge Patterns
et al. 2013) was used to reconstruct 4 × 10⁴ fiber tracts for each     Several FE models with different initial perturbations were run to
subject using the default fiber tracking parameters (max turning       find geometrical specifications of 3-hinges in a developing brain.
angle = 60o , streamline length between 30 and 300 mm, step            Node coordinates of FE models were extracted and fed as input to
length = 1 mm, and quantitative anisotropy threshold = 0.2). To        a MATLAB code to construct a surface of the convoluted model.
estimate the fiber density map, we also reconstructed the white        Then constructed surfaces were fed to a developed algorithm
matter surface from fractional anisotropic (FA) map of the diffu-      (Chen et al. 2017) to detect numbers and shapes of 3-hinge
sion MRI. Specifically, FA map was derived from diffusion MRI via      patterns. Figure 4 schematically shows how the numbers and the
FSL-FDT (Jenkinson et al. 2012), first. The FA value quantifies the    shapes of 3-hinge patterns are extracted from the FE models.
extent to which water molecules diffuse within a voxel (Beaulieu
and Allen 1994; Beaulieu 2002). Next, tissue segmentation (white
matter, gray matter, and cerebrospinal fluid, CSF for short) was
                                                                       Feature Extraction and the Shape Classification of 3-Hinges
performed on FA map via FSL-FAST (Zhang et al. 2001). Finally,
based on the segmentation results, the white matter surface,           Pipeline for the feature extraction and the shape classification
the border between the white matters and gray matters, was             of 3-hinges has been discussed in detail in our previous work
reconstructed via our home-made surface reconstruction toolkit         (Zhang et al. 2018). For details, the rationales and parameter
(Liu et al. 2008). Fiber density was defined as the number of          settings are referred to our work by Zhang et al. (2018).
streamline fibers that penetrate a unit surface area.

                                                                       Statistical Analysis
Imaging Data Analysis Methods
                                                                       Imaging data results are presented as arithmetic mean averaged
In general, 3-hinge data are based on the result of gyral net          over 868 human subjects with no outliers. Least mean square
extraction via our recently developed automatic pipeline (Chen         curve fitting method was used to produce the trend lines that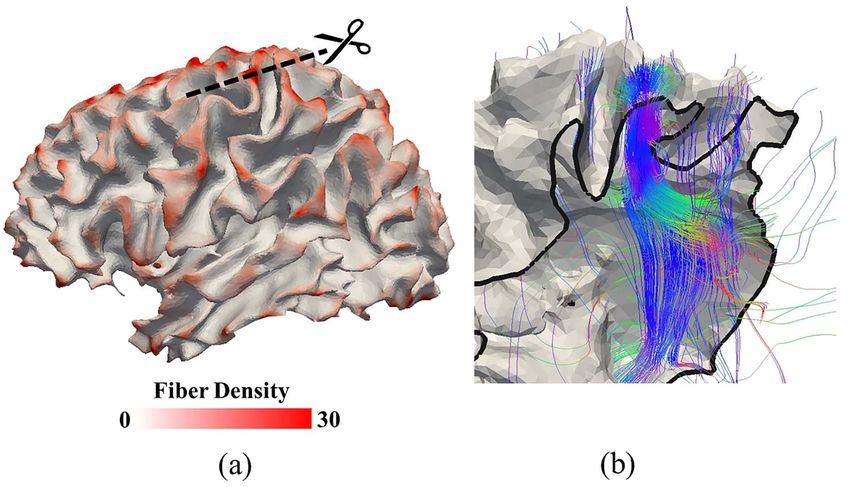
6 Cerebral Cortex Communications, 2021, Vol. 2, No. 3
Downloaded from https://academic.oup.com/cercorcomms/article/2/3/tgab044/6313975 by guest on 25 December 2021
Figure 3. Pipelines of the extraction of the gyral skeleton and 3-hinge patterns. (a) Cortical surface of the white matter/gray matter boundaries. (b) and (d) Gyral crest
segmentation and skeletonization on an enlarged region. (b) Presentation of gyral altitudes. Red regions have positive altitude values, while blue regions have negative
altitude values. (c) The cortical surface is segmented into gyral crests (black dots). (d) Gyral crest skeleton extraction (black curves). (e) The gyral crest skeleton on a brain.
(f ) The presentation of 3-hinge patterns’ centers (red dots).
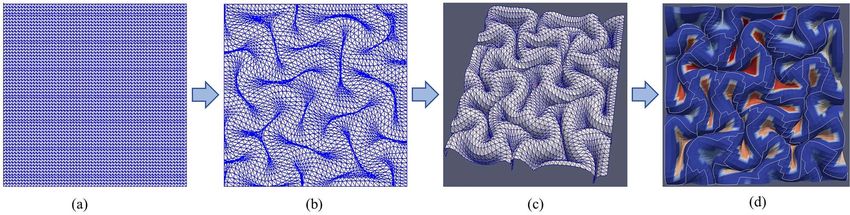
Figure 4. Process of 3-hinge patterns’ detection. (a) Initial state of the meshed area created by triangular mesh. (b) The deformed coordinates of the cortical surface in
ABAQUS are reconstructed in MATLAB. (c) The constructed surface is visualized by Paraview software. (d) A developed algorithm detects path lines and center points of
3-hinge patterns. Blue to red shows a transition from convex curvature to concave curvature.
fit the data points. Imaging data were analyzed using FreeSurfer Model of a Growing Brain section). The reason for considering
and MATLAB (R2015a). Computational data results are presented a small flat patch is that the focus of study is on the underlying
as arithmetic mean. Least mean square curve fitting method was mechanism of formation of 3-hinge patterns rather than the
used to produce the trend lines that fit the data points. ABAQUS effect of brain irregular geometry. Using simple geometry could
toolkit was used to execute the computational experiments. give basic knowledge regarding growth, folding, and formation of
3-hinges in a brain. The thickness of the cortex in the initial state
was considered to be1.5 mm. This number was found based on
Results and Discussions trial and error so that the average thickness of the cortex after
convolution is close to 3.5 mm (the average cortical thickness of a
Formation of 3-Hinge Patterns in the Human Brain mature human brain) (Bayly et al. 2014). Figure 5 shows a typical
In order to single out the mechanism of formation of 3-hinge evolution process of the growing brain model and the 3-hinge
patterns in a human brain, we first performed a series of pattern formation: 1) The cortex gradually grows under a small
finite element (FE) simulations with homogeneous growth in applied initial perturbation (check Methods Section for details of
the cortex. Therefore, a small part of the growing brain is initial perturbation); 2) instability is initiated on the cortex after a
mimicked by a flat bilayer plate model (see Computational critical growth ratio due to the considerable induced compressive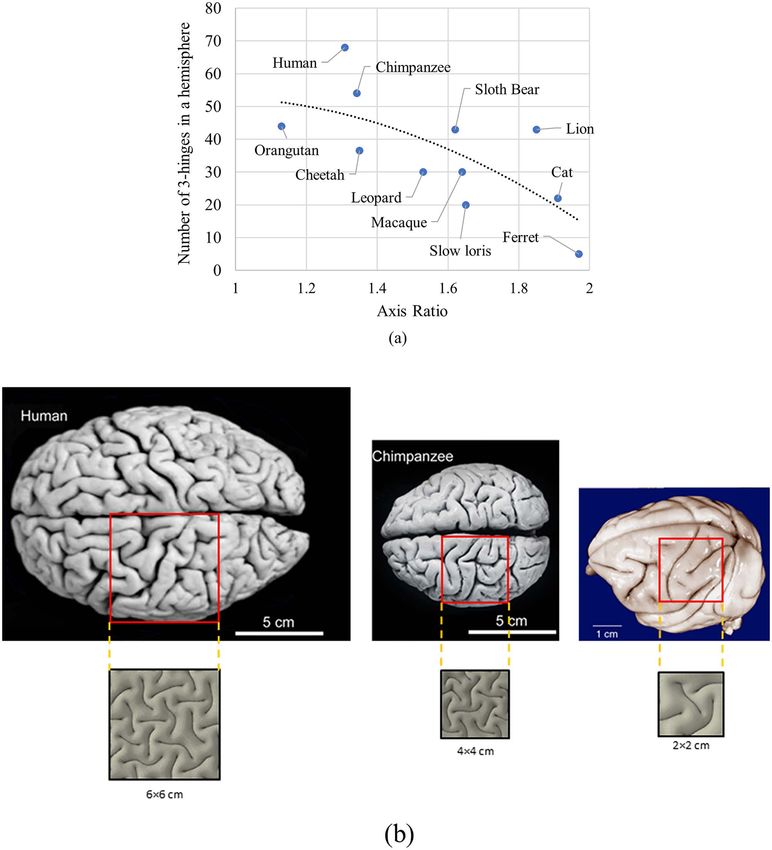
Mechanism Exploration of 3-Hinge Gyral Formation and Pattern Recognition                                      Razavi et al.          7

                                                                                                                                                                                   Downloaded from https://academic.oup.com/cercorcomms/article/2/3/tgab044/6313975 by guest on 25 December 2021
Figure 5. Morphological evolution of a growing brain model. (a) Initial perturbation before simulation. (b) Instability initiation. (c) Folding after instability. (d) Formation
of convoluted patterns and 3-hinge patterns. (e) Top view of the highly convoluted cortex. Some 3-hinge patterns are detected on the surface. Red points show centers
of 3-hinge patterns and green curves show their patterns.

stresses; 3) growth within the cortex after instability leads to                           can be observed that real brains have certain 3-hinge pattern
folds, producing gyri and sulci; 4) with increasing time and                               shapes that our FE models do not capture, although the observed
growth, folds become more convoluted and self-contacting folds                             percentage of such shapes is low even in data from real brains.
form 3-hinge patterns. Red points in Figure 5e show the locations                          Therefore, there should be other factors that regulate 3-hinge
of 3-hinge centers and the green curves denote hinge lines.                                gyral patterns in real brains, which are not yet included in our FE
    Thirty models with different small initial perturbations were                          models. We will discuss these factors in the following sections.
run while all other parameters were kept the same. After com-                              Figure 7b qualitatively compares convolution patterns between
putation and postprocessing of all models, the number and                                  randomly selected FE models and experimental images. The FE
location of 3-hinge patterns in every model were calculated                                models have different initial perturbations before growth, but
by the developed algorithm (see Methods section). Results are                              all other parameters are the same. The experimental images
shown in Figure 6a which illustrates that with different initial                           are extracted from the frontal lobes of real brains. Figure 7b
perturbations, different numbers of 3-hinge patterns form on                               indicates that FE models with small initial perturbations develop
the cortex. The number of 3-hinges patterns ranged from 29                                 different convolution patterns. From the mechanical view, as
to 38 and the average number is around 34. Figure 6b shows                                 folding process is a dynamic process, final patterns are highly
the normal distribution of the number of 3-hinge patterns. The                             dependent on the initial states and imperfections. Initial small
image in Figure 6c shows an example case of how our automatic                              perturbations in the FE model may be analogous to differences
algorithm has detected the locations of the 3-hinge patterns.                              in curvature for real brains. This means that different parts
Results indicate that in all models, the size and thickness of                             of a brain, without considering any other factors and just by
gyri in the hinge lines in 3-hinge patterns are similar to each                            attention to their location and curvature, are able to develop
other, but locations and shapes can be quite different. The similar                        different folding patterns (such as the 3-hinge patterns, which
variation of locations of 3-hinge patterns can be observed in                              are the focus of this work). Moreover, since the initial state of
different individual brains. As an example, Figure 6d shows how                            any individual brain is unique to a certain extent, we can expect
the locations of major 3-hinge patterns are different in four ran-                         that tertiary folding patterns are not consistent between any two
domly selected subjects. These results may explain why 3-hinge                             samples. On the other hand, there are some commonly preserved
patterns are notably different across individuals even when they                           3-hinge patterns in all real brains that demonstrate a certain
are quite similar in the size and thickness of gyri in the hinge                           amount of consistency; we thus strive to find an explanation to
lines. In other words, a very small difference in the initial smooth                       this consistency.
brain can lead to the formation of considerably different 3-hinge
patterns after the development.
    In addition to the number of 3-hinges, using the FE data, we
                                                                                           Contribution of Fibers on the Location and the Shape
have also extracted the dominant 3-hinge patterns in order to                              of 3-Hinge Patterns
create a comparison with those observed in the brain imaging                               In the previous section, we investigated how mechanical param-
data. For the experimental analysis, the dominant 3-hinge pat-                             eters are responsible for certain mechanisms of 3-hinge pattern
terns and their relative occurrence percentages were extracted                             formation. However, those factors alone are not able to deter-
from 68 brain subjects with 7498 detected 3-hinge patterns. For                            mine exact locations and geometry of formed 3-hinge patterns,
the computational analysis, from the FE models, 844 3-hinge                                as shown in Figure 7. Therefore, as discussed previously, there
patterns were detected and extracted. Figure 7a shows eight                                should be other factors that regulate the conserved shape of 3-
dominant shapes of 3-hinge gyral patterns identified in the                                hinge patterns in a real brain, which have not yet been consid-
human brain and FE models. The top numbers (red) and bottom                                ered in our FE models. In our previous study (Ge et al. 2018),
numbers (blue) are the percentages found in real brains and FE                             we showed that, in accompaniment with the differential growth
models, respectively. This comparison indicates that “Y”-shaped                            theory, growing fibers could possibly control the location of 3-
3-hinge patterns are the most favorable patterns found in real                             hinge gyrus formation. Figure 8a demonstrates that in the real
brains as well as in FE models, although overall the real brain                            brain, axonal fibers connected to 3-hinge gyral folds are much
demonstrates more variety in terms of 3-hinge patterns’ shapes.                            denser than those found in other areas.
These results show that our biomechanical model, at least par-                                 We obtained average fiber densities of brain locations con-
tially, can mimic the growth of a brain and capture complex                                taining 3-hinge gyral patterns and realized that there is a signif-
convoluted 3-hinge patterns. With a careful look at Figure 7a, it                          icant difference in the fiber density between 3-hinge gyral folds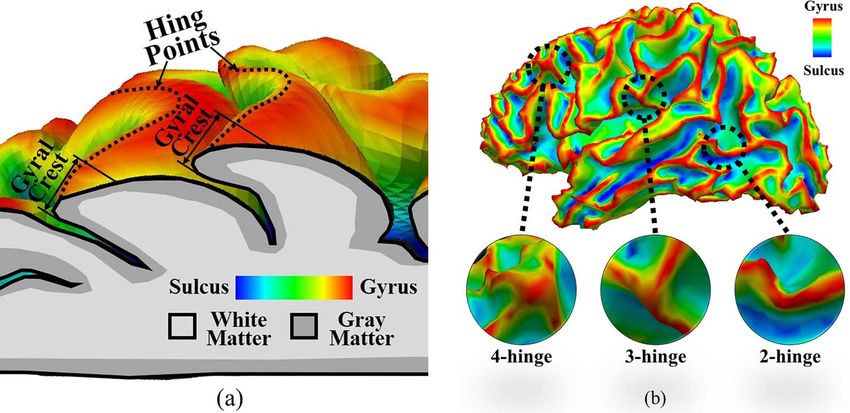
8 Cerebral Cortex Communications, 2021, Vol. 2, No. 3
Downloaded from https://academic.oup.com/cercorcomms/article/2/3/tgab044/6313975 by guest on 25 December 2021
Figure 6. (a) Dependency of numbers of 3-hinge patterns on small initial perturbation. (b) Normal distribution of the number of 3-hinge patterns. (c) An example case to
show how the developed algorithm automatically detects the locations of 3-hinge patterns. (d) Variation in location of 3-hinge patterns on the precentral gyrus (PrCG) and
postcentral gyrus (PoCG) for four randomly selected subjects. The cortical surfaces of four subjects have been aligned to the gray-ordinate standard system by the HCP
preprocessing pipeline (corresponding vertices are of the same ID). We manually identified three 3-hinge patterns on subject #1. The hinge centers are represented by
color bubbles. The hinge spokes are represented by solid curves. The anatomical corresponding vertices on subjects #2-#4 via HCP preprocessing pipeline are highlighted
by the corresponding color bubbles and black arrows. We also manually identified the corresponding 3-hinges on subjects #2-#4, the centers and spokes of which are
represented by dashed circles and curves and color-coded by the correspondences. This figure has been reused with permission from Ref. (Zhang et al. 2018).
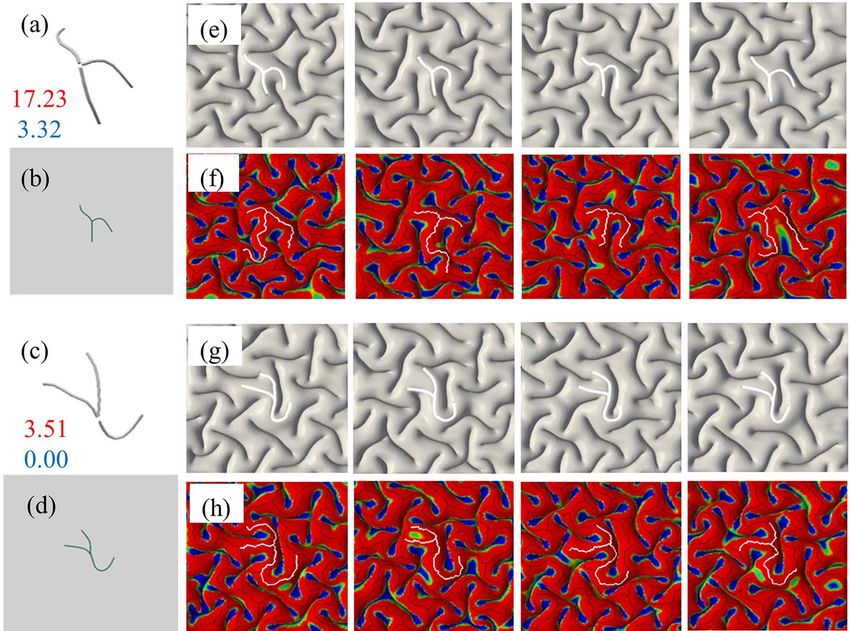
Figure 7. (a) Dominant shapes of 3-hinge patterns in real brains and FE models. The top numbers (red color) and bottom numbers (blue color) are the percentages found
in real brains and FE models, respectively. (b) Comparison of convolution patterns between our FE models (left) and experimental images of real brains (right). In the
experimental images, gray matter has been removed for easier analysis of gyral crests.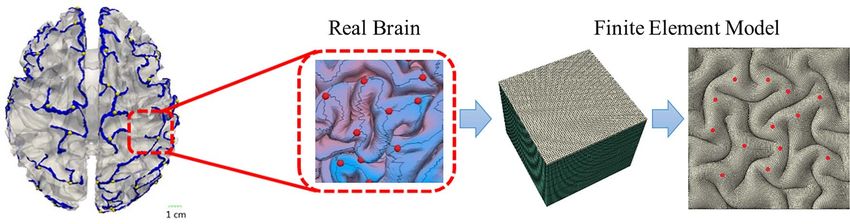
Mechanism Exploration of 3-Hinge Gyral Formation and Pattern Recognition                                    Razavi et al.          9

                                                                                                                                                                                Downloaded from https://academic.oup.com/cercorcomms/article/2/3/tgab044/6313975 by guest on 25 December 2021
Figure 8. (a) Fiber density in the 3-hinge patterns is higher than other locations of a brain (red color regions). The reconstructed surface is white matter surface. (b) The
cross-section shows how dense fibers are projected to a 3-hinge fold. Black arrow heads in (a) and (b) highlight the same 3-hinge fold. Diffusion MRI of this subject was
used to produce the streamline fibers (color curves in (b)) and the white matter surface and the fiber density map on this surface in (a). More details are referred to
section “Imaging Data Analysis Method”.

Figure 9. Top view of four FE models with same mechanical and geometrical parameters and different initial perturbations. Locations and 3-hinges patterns are
unpredictable.

and the typical gyral crest lines. Therefore, a possible factor that                     of 3-hinge pattern from Figure 7 which were observed in real
can be incorporated into FE models to explain certain consisten-                         brain and not in FE models, Figure 10a,c. We incorporated fibers
cies in location and shape of 3-hinge patterns is the presence                           with gradient growth along the hinge lines following the selected
and growth of axonal fibers. To do so, we incorporated the role of                       special types of 3-hinge pattern, Figure 10b,d. These concentrated
axonal wiring into the regulation of location and shape of 3-hinge                       bundles of fibers project from the base of white matter to the
patterns. We created several models with and without growing                             interface of gray–white matters to mimic higher fiber density on
fibers with gradient growth rates. The assigning gradient growth                         3-hinge patterns. The axial growth rate of the fibers in the hinge
to fibers considers that the hinge points have higher growth rate                        points is considered to be the same as the growth rate of the
than the hinge lines, because the concentration of fibers around                         cortex (Ge et al. 2018). This axial growth rate reduces over the
the hinge points is highest, which decreases over the hinge lines                        hinge lines linearly to zero at the tip of the hinge lines (gradient
with moving away from the hinge points (see Methods section                              growth). Figure 10e,g shows top view of four FE models with
for more details). Figure 9 shows a top view of the final state                          growing fibers after growth and convolution. Despite different
of four FE models without contribution of fibers. All parameters                         initial perturbations, we can see that all models formed com-
of models except initial perturbation are the same. The 3-hinge                          plex 3-hinge patterns, which have been observed in real brains.
patterns (green lines) and their locations (red dots) are different                      Therefore, growing fibers could be a possible factor to determine
although their qualitative features are similar to each other,                           or regulate the location and shape of 3-hinge patterns. In our
which indicates that the differential growth theory by itself only                       previous study, we set the growth rate of axonal fibers as five
produces 3-hinge patterns in unpredictable locations. We could                           different values, all of which are comparable with the growth rate
not find any specific relationship between the wavelength of the                         in the cortex. Results showed that there is a very high possibility
initial perturbation and the location of the formed 3-hinges.                            to form a 3-hinge gyrus in the specific area when the growth rate
    As we observed in Figure 7a, models without contribution                             of axonal fibers is close to the growth rate of the cortex, while
of fibers do not exactly capture 3-hinge patterns and locations                          the area in models without axonal fibers could be located on
same as real images. In the next step, we selected two types                             hinge, sulci, or in-between banks. In addition, the sites with a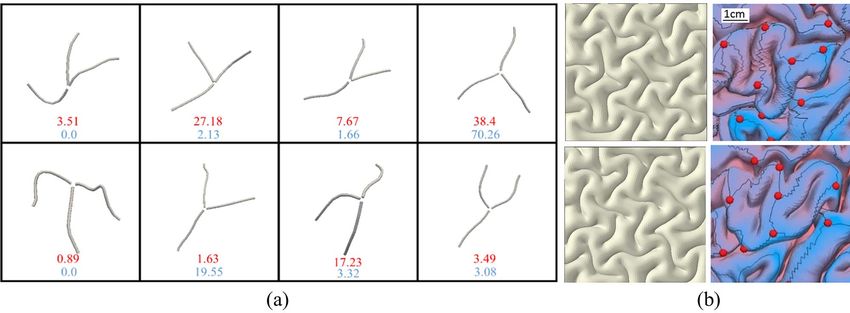
10       Cerebral Cortex Communications, 2021, Vol. 2, No. 3

                                                                                                                                                                               Downloaded from https://academic.oup.com/cercorcomms/article/2/3/tgab044/6313975 by guest on 25 December 2021
Figure 10. (a) and (c) Two selected 3-hinge patterns taken from images of a real brain are incorporated into the FE models. (b) and (d) The top view of FE models in initial
state and without growth, with highlighted areas containing fibers. (e) and (g) Four FE models with growing fibers along the selected 3-hinge patterns shown in (b) and
(d). All parameters of models are same except initial perturbations. After convolution, 3-hinge patterns same as those seen in a real brain form in the center of cortex.
(f ) and (h) The 3-hinge patterns (white lines) are detected by the developed algorithm.

high density of growing axonal fibers do not develop any sulci                             such as heterogeneity in stiffness and growth and curvature
in agreement with the experimental results. This study similar                             controls the 3-hinges number, location, and shape. For example,
to the other studies (Ge et al. 2018; Chavoshnejad et al. 2021)                            the initial curvature of the smooth brain has shown a great
reveals that although fiber bundles do not induce folding, they                            impact on the morphology of folds (Budday et al. 2015c; Tallinen
can regulate the locations of gyri and sulci.                                              et al. 2016). Narrow elongated brains tend to fold mainly in
    It is interesting to see that 3-hinge patterns far from their                          the longitudinal direction, while rounder brains, such as the
centers are quite different from one another. This result shows                            human brain, fold in the transverse direction (Budday et al.
that besides the commonly preserved 3-hinge patterns, we can                               2015c). Our previous study also showed that the heterogeneous
also have various and different 3-hinge patterns in a growing                              regional growth in the cortex can produce consistent gyrus in
brain such as those illustrated in the previous section. Previous                          a developing brain (Zhang et al. 2016). However, the effect of
analysis on the relationship between axonal elongation and                                 curvature and heterogeneity in growth and stiffness on the shape
cortical growth (Holland et al. 2015) concludes that rather than                           and location of 3-hinge patterns in a brain has not yet been
axons pulling on the brain to induce cortical folding, the folding                         thoroughly investigated.
cortex pulls on the axons to trigger axonal elongation and white
matter growth. In our models, we assign axial growth to the
fibers. With this assumption before instability and folding in the
                                                                                           Effect of the Brain Size and Cortex Thickness
model brain, compressive forces appear in the fibers. But, after
the gyrification, this statement is not true and some of the fibers
                                                                                           on the 3-Hinge Patterns
can feel the tension even if they are growing (mostly fibers in the                        So far, we have discussed human subjects, but what are the
gyri part). This can happen because the differential growth in the                         possible patterns of 3-hinges in other primates? DTI data from 64
gyrification process is a dominating factor to the axonal growth.                          HCP human brain specimens revealed that the average number
Therefore, we observe both tensile and compressive fibers at                               of 3-hinge patterns in a human brain is around 137 (Ge et al.
distant locations.                                                                         2018), which is considerably greater than the average number
    It is worth noting that only the contribution of fibers has been                       of 3-hinge patterns found in chimpanzee and macaque brains,
included in the discussion. Admittedly, the axonal wiring is not                           108 and 60, respectively (Zhang et al. 2020). Brain size could be
the only parameter that controls the shape of certain 3-hinges. It                         a possible parameter on the number of 3-hinges, in that bigger
is highly possible that axonal wiring together with other factors                          brains (with higher prefolding surface area) will have a larger
Mechanism Exploration of 3-Hinge Gyral Formation and Pattern Recognition Razavi et al. 11
Downloaded from https://academic.oup.com/cercorcomms/article/2/3/tgab044/6313975 by guest on 25 December 2021
Figure 11. (a) Dependence of number of 3-hinge patterns on the axis ratio of brains between different species. The number of 3-hinge patterns is only for a hemisphere.
(b) Dependence of folding patterns and number of 3-hinge patterns on cortical thickness. In FE models, square patches show representative folding patterns of human,
chimpanzee, and macaque brains. The size of the patches is selected to be representative of folding patterns.
number of 3-hinge patterns. However, results from image data to the minor axis of it (front to rear distance divided by top to
show that different species with similar brain sizes may have a bottom distance). As an example, the brains of both a cat and a
huge difference in the number of 3-hinge patterns (Zhang et al. lion have similar axis ratios but a big difference in the number
2020). Hence, other parameters may control the number of 3- of 3-hinge patterns. Therefore, neither brain size nor axis ratio is
hinge patterns beyond the brain size. Interestingly, Figure 11a a singular factor in controlling the number of 3-hinge patterns.
shows that even species with the same axis ratio of the brain Another possible factor that could be considered is the
may not have similar numbers of 3-hinge patterns. The axis thickness of the cortex. The thickness of the cortex is different
ratio is the ratio of major axis of the ellipsoidal shape of brain between species and is independent from the size or mass of the12 Cerebral Cortex Communications, 2021, Vol. 2, No. 3
Downloaded from https://academic.oup.com/cercorcomms/article/2/3/tgab044/6313975 by guest on 25 December 2021
Figure 12. (a) Dependency of number of 3-hinge patterns to the surface area and initial thickness of cortex. Numbers on the series legends show the areal dimensions
of the cortex in centimeters. (b) Dependency of density of 3-hinge patterns in a unit area of models; N is the number of 3-hinge patterns per unit area and t is the initial
thickness of cortex.
brain (Sun and Hevner 2014). The average cortical thicknesses surface area. Furthermore, it is not necessary to have data after
for human, chimpanzee, and macaque brains roughly are2.5, convolution; only initial geometrical parameters are required.
2, and1.68 mm, respectively (Fischl and Dale 2000; Zhang et al. The human brain in a smooth state, that is, before convolution,
2017). A previous study analytically indicated that the number has an average surface area of 120 cm2 at 23 weeks of gestation
of folds increases linearly with the ratio of brain radius to cortex (Zhang et al. 2013) and a cortical thickness of around1.5 mm.
thickness (Budday 2015c). Although the human brain has a From these numbers, based on Figure 2b, we can predict that
higher cortical thickness, it is more convoluted and has a larger the human brain after convolution will form roughly “142” 3-
number of 3-hinge patterns. This happens because the human hinge patterns, which is comparable with the real brain observed
brain has larger surface area and the ratio of brain radius to average of 137 (Ge et al. 2018). The discrepancy could possibly be
cortex thickness is higher than in both other primates. In our FE from real brain curvature, which has not been considered in this
models, the average radii for the brains of human, chimpanzee, model. This result shows that by tuning the initial geometrical
and macaque were set as50, 32, and26 mm, respectively. Average parameters in a mechanical model brain, we are able to predict
radius in the patch model is equal to the total height of the the number of such complex 3-hinge patterns after convolution.
model including the thickness of the white and gray matters. The result shows that the role of mechanics on the growth and
Figure 11b shows a top view of the FE models for a square patch formation of complex shapes in brain is greater than what we
of every species. The sizes of the patches were selected to be previously thought. Future studies are required to help reveal the
representative of the folding geometry. Figure 11b shows that fundamental contributions of mechanics on the folding of brain
the number of 3-hinge patterns could be a function of cortical and its associated structural disorders.
thickness. To investigate this relationship, we ran several models
for human brains with various cortical thicknesses. The initial
cortex thickness varies from1 to 2 mm. It is worth mentioning
Conclusions
that the cortex thickness after growth and convolution is Although mechanical forces play a vital role in the evolution of 3-
increased compared with the initial thickness. hinge patterns in cortical folding, the fundamentals underlying
Figure 12a shows the dependency of the number of 3-hinge these active forces that drive this process remain unclear. By
patterns and final cortical thickness on the initial cortical thick- using imaging and computational tools, we set out to identify and
ness and the surface area of the cortex. As can be seen, a cortex study the force-generating parameters that have been included
with a higher surface area has a higher number of 3-hinge in this complex process. We showed that differential growth
patterns, and a thicker cortex has the trend of forming fewer 3- along with the presence of axonal fibers could be a potential
hinge patterns. Figure 12a also shows that cortex thickness after factor in controlling the number, location, and shape of 3-hinge
convolution has a linear relationship with the initial thickness gyral patterns in a developing human brain. The mechanism of
of cortex. Since the cortical layer after convolution does not have the formation of 3-hinge patterns as a part of cortical folding
a uniform thickness, being notably different between sulci and may involve differential growth in a primary role and axonal
gyri, the thicknesses were roughly calculated and averaged in wiring in a secondary role. From our study, we can speculate that
random locations. To calculate the density of 3-hinge patterns in axonal wiring is one of the main contributors to the formation
a unit area for all models presented in Figure 12a, a square patch of 3-hinge patterns with certain unique shapes in designated
6 × 6 cm was cut from the center of models (so as to lessen possi- specific locations, as the differential growth hypothesis does not
ble edge effects), and the calculated number of 3-hinge patterns predict the spatially consistent patterns of certain identifiable 3-
over this area is presented in Figure 12b. Based on Figure 12b we hinge patterns. It is a challenging and unanswered question of
can, with high accuracy, predict how many 3-hinge patterns will the complex causal relationship: Whether the formation of a 3-
form on the cortex with a known initial cortical thickness and hinge pattern then attracts more fibers toward the 3-hinge site,Mechanism Exploration of 3-Hinge Gyral Formation and Pattern Recognition Razavi et al. 13
or whether the dense and growing fibers push a specific site to Bertrand G. 2005. On topological watersheds. J Math Imaging
help drive the formation of a 3-hinge pattern initially induced Vision. 22(2–3):217–230.
by differential growth. Nevertheless, one clear point is that for Bray D. 1984. Axonal Growth in Response to Experimen-
the formation of a 3-hinge pattern both differential growth and tally Applied Mechanical Tension. Dev Biol. 102(2):379–89.
axonal wiring accompany each other. We also showed that the https://doi.org/10.1016/0012-1606(84)90202-1.
thickness of the cortex is the main geometrical parameter, which Budday S, Kuhl E, Hutchinson JW. 2015a. Period-doubling and
determines the number of 3-hinges patterns in a certain brain period-tripling in growing bilayered systems. Philosophical Mag-
surface. However, the size and axis ratio of the brain do not have azine. 95(28–30):3208–3224.
considerable effect on the number of 3-hinge patterns among Budday S, Nay R, de Rooij R, Steinmann P, Wyrobek T, Ovaert
different species. TC, Kuhl E. 2015b. Mechanical properties of gray and white
In our work, we choose a small part of the brain with a simple matter brain tissue by indentation. J Mech Behav Biomed Mater.
geometry as our basic model to investigate the fundamental of 46:318–330.
Downloaded from https://academic.oup.com/cercorcomms/article/2/3/tgab044/6313975 by guest on 25 December 2021
the formation of 3-hinges patterns. This simple model helps us Budday S, Raybaud C, Kuhl E. 2014a. A mechanical model predicts
achieve the key findings as we expected; however, future studies morphological abnormalities in the developing human brain.
with a more realistic model brain will be worthwhile to invest Sci Rep. 4:5644.
for further exploring the details. The effect of the curvature and Budday S, Steinmann P, Goriely A, Kuhl E. 2015c. Size and cur-
heterogeneity in growth and stiffness on the formation of 3- vature regulate pattern selection in the mammalian brain.
hinge patterns could also be studied. Conducting such a com- Extreme Mechanics Letters. 4:193–198.
prehensive model may result in the development of an effective Budday S, Steinmann P, Kuhl E. 2014b. The role of mechanics
tool to diagnose certain common brain disorders such as autism. during brain development. J Mech Phys Solids. 72:75–92.
Therefore, understanding of 3-hinge gyral patterns formation Budday S, Steinmann P, Kuhl E. 2015d. Secondary instabilities
and development can provide useful insight into the differences modulate cortical complexity in the mammalian brain. Philo-
between normal and pathological brain function. sophical Magazine. 95(28–30):3244–3256.
Cai S, Chen D, Suo Z, Hayward RC. 2012. Creasing instability of
elastomer films. Soft Matter. 8(5):1301–1304.
Notes Cao Y, Jiang Y, Li B, Feng X. 2012b. Biomechanical modeling
of surface wrinkling of soft tissues with growth-dependent
M.J.R. thanks the start-up support from Department of Mechan-
mechanical properties. Acta Mechanica Solida Sinica. 25(5):
ical Engineering at Binghamton University. X.W. and T.L. were
483–492.
supported by National Science Foundation (NSF No. 2011369). We
Cao Y-P, Jia F, Zhao Y, Feng X-Q, Yu S-W. 2012a. Buckling and post-
would like to thank the Human Connectome Project for sharing
buckling of a stiff film resting on an elastic graded substrate.
the datasets used in this work. Conflict of Interest: The authors
Internat J Solids Structures. 49(13):1656–1664.
declare no competing financial interests.
Chavoshnejad, Poorya, Xiao Li, Songyao Zhang, Weiying Dai, Lana
Vasung, Tianming Liu, Tuo Zhang, Xianqiao Wang, and Mir
Ethical Statement Jalil Razavi. 2021. Role of Axonal Fibers in the Cortical Folding
Patterns: A Tale of Variability and Regularity. Brain Multiphysics,
All procedures performed in studies involving human partic- June, 100029.
ipants were in accordance with the ethical standards of the Chen H, Li Y, Ge F, Li G, Shen D, Liu T. 2017. Gyral net: a new
University of Georgia and with the 1964 Helsinki declaration representation of cortical folding organization. Med Image Anal.
and its later amendments or comparable ethical standards. All 42:14–25.
applicable international, national, and/or institutional guidelines Chen, Hanbo, Xiang Yu, Xi Jiang, Kaiming Li, Longchuan Li,
for the care and use of animals were followed. Xintao Hu, Junwei Han, Lei Guo, Xiaoping Hu, and Tianming
Liu. 2014. Evolutionarily-Preserved Consistent Gyral Folding
Patterns across Primate Brains. In 2014 IEEE 11th International
References Symposium on Biomedical Imaging (ISBI), 1218–21. Beijing, China:
Andersson JLR, Sotiropoulos SN. 2016. An integrated approach to IEEE. https://doi.org/10.1109/ISBI.2014.6868095.
correction for off-resonance effects and subject movement in Csernansky JG, Gillespie SK, Dierker DL, Anticevic A, Wang L,
diffusion MR imaging. Neuroimage. 125:1063–1078. Barch DM, Van Essen DC. 2008. Symmetric abnormalities in
Armstrong E, Zilles K, Schleicher A. 1993. Cortical folding and the sulcal patterning in schizophrenia. Neuroimage. 43(3):440–446.
evolution of the human brain. J Hum Evol. 25(5):387–392. Dennerll, T J, P Lamoureux, R E Buxbaum, and S R Heidemann.
Bayly P, Okamoto R, Xu G, Shi Y, Taber L. 2013. A cortical folding 1989. The Cytomechanics of Axonal Elongation and Retrac-
model incorporating stress-dependent growth explains gyral tion. The Journal of Cell Biology. 109(6):3073–83. https://doi.o
wavelengths and stress patterns in the developing brain. Phys rg/10.1083/jcb.109.6.3073.
Biol. 10(1):016005. Duchesnay E, Cachia A, Roche A, Rivière D, Cointepas Y,
Bayly P, Taber L, Kroenke C. 2014. Mechanical forces in cerebral Papadopoulos-Orfanos D, Zilbovicius M, Martinot J-L, Régis J,
cortical folding: a review of measurements and models. J Mech Mangin J-F. 2007. Classification based on cortical folding pat-
Behav Biomed Mater. 29:568–581. terns. IEEE Trans Med Imaging. 26(4):553–565.
Beaulieu C. 2002. The basis of anisotropic water diffusion in Fischl B, Dale AM. 2000. Measuring the thickness of the human
the nervous system—a technical review. NMR Biomed. 15(7– cerebral cortex from magnetic resonance images. Proc Natl Acad
8):435–455. Sci. 97(20):11050–11055.
Beaulieu C, Allen PS. 1994. Determinants of anisotropic water Fischl B, Rajendran N, Busa E, Augustinack J, Hinds O, Yeo
diffusion in nerves. Magn Reson Med. 31(4):394–400. BT, Mohlberg H, Amunts K, Zilles K. 2008. Cortical folding
Ben Amar M, Goriely A. 2005. Growth and instability in elastic patterns and predicting cytoarchitecture. Cereb Cortex. 18(8):
tissues. J Mech Phys Solids. 53(10):2284–2319. 1973–1980.You can also read