Drought resilience of conifer species is driven by leaf lifespan but not by hydraulic traits
←
→
Page content transcription
If your browser does not render page correctly, please read the page content below
Full paper

Drought resilience of conifer species is driven by leaf lifespan but
not by hydraulic traits
Yanjun Song1               , Frank Sterck1              , Xiaqu Zhou1,2                , Qi Liu1          , Bart Kruijt3              and Lourens Poorter1
1
Forest Ecology and Forest Management Group, Wageningen University and Research, 6700 AA, Wageningen, the Netherlands; 2Department of Earth and Environmental Sciences, KU
Leuven, PO Box 2411, 3001, Leuven, Belgium; 3Water Systems and Global Change Group, Wageningen University and Research, 6700 AA, Wageningen, the Netherlands

                                                            Summary
Author for correspondence:                                   Increased droughts impair tree growth worldwide. This study analyzes hydraulic and carbon
Yanjun Song                                                 traits of conifer species, and how they shape species strategies in terms of their growth rate
Email: yanjun.song2021@gmail.com
                                                            and drought resilience.
                                                             We measured 43 functional stem and leaf traits for 28 conifer species growing in a 50-yr-old
Received: 20 January 2022                                   common garden experiment in the Netherlands. We assessed: how drought- and carbon-
Accepted: 14 April 2022
                                                            related traits are associated across species, how these traits affect stem growth and drought
                                                            resilience, and how traits and drought resilience are related to species’ climatic origin.
New Phytologist (2022)                                       We found two trait spectra: a hydraulics spectrum reflecting a trade-off between hydraulic
doi: 10.1111/nph.18177                                      and biomechanical safety vs hydraulic efficiency, and a leaf economics spectrum reflecting a
                                                            trade-off between tough, long-lived tissues vs high carbon assimilation rate. Pit aperture size
Key words: carbon physiology, drought
                                                            occupied a central position in the trait-based network analysis and also increased stem
resilience, functional trait, hydraulic trade-              growth. Drought recovery decreased with leaf lifespan.
off, leaf economics spectrum, leaf lifespan,                 Conifer species with long-lived leaves suffer from drought legacy effects, as drought-
pit aperture, stem growth.                                  damaged leaves cannot easily be replaced, limiting growth recovery after drought. Leaf
                                                            lifespan, rather than hydraulic traits, can explain growth responses to a drier future.

                                                                                                  of essential resources for plants, such as water, nutrients and car-
Introduction
                                                                                                  bon (Choat et al., 2018). The traits of different plant organs (i.e.
                                                                                                  leaf, stem and root) are expected to be associated and integrated,
Climate change and conifer species
                                                                                                  since they jointly determine resource use (Reich, 2014). World-
One of the most important challenges in ecology is to predict cli-                                wide, a plant economics spectrum has been identified ranging
mate change impacts on plants, and its cascading effects on plant                                 from species with conservative resource use, slow growth and
species distributions, community structure, ecosystem function-                                   high survival to species with acquisitive resource use, fast growth
ing and ecosystem services (Bellard et al., 2012; Jump et al.,                                    but low survival (Reich, 2014; Dıaz et al., 2016). This global
2017). Here we focus on conifer species as they are important                                     spectrum is well established for leaves (i.e. the leaf economics
components of many temperate and boreal forests because they                                      spectrum (LES)) (Wright et al., 2004), but developed to a lesser
provide timber, carbon storage, food and shelter (Pan et al.,                                     extent for stems (Yang et al., 2022).
2011; H€am€al€ainen et al., 2018; Davies et al., 2020). Global                                       Conifers tend to occupy the conservative end along the global
warming and the increased frequency and intensity of droughts                                     spectrum (Dıaz et al., 2016) because they possess specific features,
are endangering the growth and survival of tree species worldwide                                 such as tough, needle-like and mostly evergreen leaves, and nar-
(IPCC, 2013; Choat et al., 2018; Brodribb et al., 2020), includ-                                  row tracheids, which reduce their water transport capacity but
ing conifer species (DeSoto et al., 2020). In this study we analyze                               make them more tolerant to drought or cold. Most large-scale
the hydraulic and carbon traits of conifer species, and how they                                  comparative studies have confirmed the LES for a broad range of
shape species strategies in terms of their growth and drought                                     angiosperm species. However, a comparative study on gym-
resilience.                                                                                       nosperms failed to find the LES (Anderegg et al., 2018), probably
                                                                                                  due to the relatively narrow range of leaf trait values within this
                                                                                                  group. Moreover, it remains unclear to what extent leaf and stem
Plant economics spectrum and conifer species
                                                                                                  traits are coordinated, and whether conifer species show a plant
Functional traits have been widely used to predict species                                        economics spectrum that integrates leaf and stem traits (Rosas
responses to climate change, since they affect plant growth and                                   et al., 2019). Here we address this knowledge gap by quantifying
survival in different environments (Poorter et al., 2008; Wu et al.,                              a comprehensive set of 43 stem and leaf traits of 28 conifer tree
2016). Plant traits determine the uptake, transport, use and loss                                 species growing in a common garden experiment. We assess the

Ó 2022 The Authors                                                                                                                                     New Phytologist (2022)   1
New Phytologist Ó 2022 New Phytologist Foundation                                                                                                   www.newphytologist.com
This is an open access article under the terms of the Creative Commons Attribution-NonCommercial-NoDerivs License, which permits use and
distribution in any medium, provided the original work is properly cited, the use is non-commercial and no modifications or adaptations are made.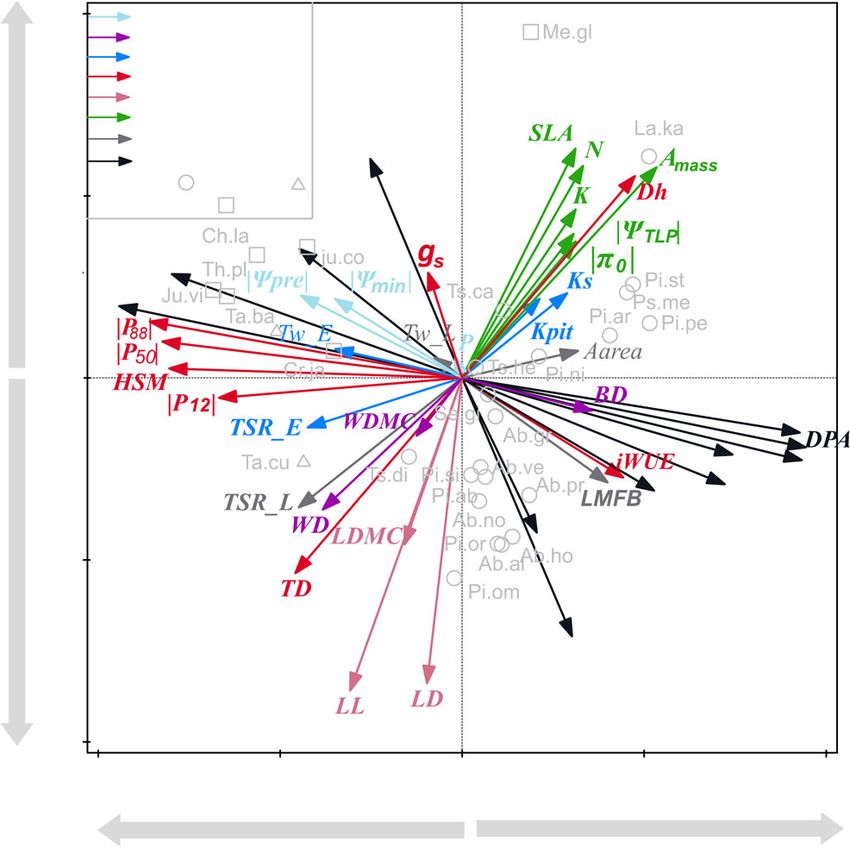
New
2 Full paper                                                                                                                            Phytologist

  existence of economics spectra across leaves and stems, with a               (3) How are stem growth and drought resilience related to
  particular emphasis on hydraulic traits, and explore the implica-            species climatic origin? We predict that conifer species originat-
  tions for stem growth and drought resilience.                                ing from harsh xeric or cold habitats are characterized by a con-
                                                                               servative strategy and traits that are associated with slow growth,
                                                                               such as small tracheids, low specific leaf area and long leaf lifes-
  Traits and tree strategies of conifer species
                                                                               pan. Because of these conservative trait values they will be
  Traits that increase carbon gain, water transport and reduce tissue          drought-resistant and, hence, also drought-resilient.
  construction costs tend to increase growth but come at the
  expense of reduced survival (Reich, 2014). For example, acquisi-
                                                                               Materials and Methods
  tive leaf trait values, such as a high specific leaf area, stomatal con-
  ductance and nutrient concentration, and low leaf dry matter
                                                                               Study site and species selection
  content and short leaf lifespans, may contribute to a higher
  growth rate (Sterck et al., 2006; Kitajima & Poorter, 2010), but             This study was conducted in a 50-yr-old common garden experi-
  may come at the cost of higher mortality risks with low resistance           ment at the Schovenhorst Estate (52.25°N, 5.63°E), near Putten,
  to drought. Conservative leaves, by contrast, facilitate the resis-          the Netherlands. The study site is characterized by a temperate
  tance to drought stress, but come at the cost of reduced growth              maritime climate. Mean annual temperature and rainfall are
  (Onoda et al., 2017). Similarly, acquisitive stem trait values such          10.1°C and 830 mm, respectively. The area has dry, loamy and
  as wide pits and tracheids favor conductivity and growth rates of            sandy, nutrient-poor soils with a low water retention capacity
  conifer species, but this may come at the expense of reduced                 (Cornelissen et al., 2012) and a long distance (19 m) to the soil
  drought tolerance (Song et al., 2022).                                       water table (TNO-NITG, 2020). In total, 28 conifer species from
     Few studies have explored growth responses of large numbers               the northern hemisphere with different climatic origins were
  of conifer species using a broad range of functional traits (Walters         planted in monospecific stands (Supporting Information
  & Gerlach, 2013; Anderegg et al., 2018), and even fewer studies              Table S1), and trees had an average stem diameter at breast height
  link the resultant trait spectra to differences in stem growth rate          (1.3 m) of 35.8 cm, varying from 5.0 to 86.3 cm across species.
  or drought resilience across conifers (Gazol et al., 2017). Some of
  the species’ generalizations may therefore be premature for
                                                                               Sample collection and functional trait measurements
  conifers.
     In this study, we quantified 43 leaf and stem traits of 28 conifer        Between 2018 and 2019, we collected 43 traits for each of the
  species growing in a common garden experiment and used den-                  28 conifer species (Table 1). One branch per individual was
  drochronology to quantify stem growth rate and drought                       selected for the following measurements. These traits were
  resilience. Resilience consists of two components, the reduction in          related to leaf size and display (three traits), carbon assimilation
  stem growth during dry years (resistance) and the increase in stem           (seven), tissue toughness (six), wood anatomy (13), hydraulics
  growth (recovery) after dry years (Lloret et al., 2011). We                  and cavitation resistance (eight), and pressure–volume traits
  addressed three questions and their corresponding hypotheses:                (six). To reduce phenotypic variation among individuals and
                                                                               species, we harvested branches (c. 65 cm long, see Fig. S1) in
  (1) How are functional traits associated with each other? We                 the most illuminated position with an average height of 6 m (5–
  expect that traits that contribute to similar functions are more             7 m; see Methods S1). Due to time limitations, traits related to
  closely correlated than traits related to other functions. From this,        wood anatomy and pressure–volume traits were measured based
  we predict that traits can be classified into different clusters, reflect-   on three individuals per species. For the remaining traits, five or
  ing, for example, structural construction costs, drought tolerance,          six individuals per species were measured. All trait values were
  water transport and carbon assimilation. In combination, these               averaged at the species level.
  functions and clusters result in different plant strategies to deal
  with water, carbon and nutrient use. As a result, we expect a plant          Leaf size and display Specific leaf area (SLA, cm2 g 1), leaf mass
  strategy spectrum that runs from conservative species with dense             fraction of branch (LMFB, g g 1) and leaf number per unit
  tissues and high hydraulic safety to acquisitive species with soft tis-      branch length (LNBL, mm 1) imply the capacity of light capture,
  sues, high hydraulic efficiency and carbon assimilation rates.               since SLA represents biomass efficiency for leaf display, LMFB
  (2) How do functional traits predict the inherent growth rate                represents biomass allocation to leaves and LNBL indicates the
  and drought resilience of conifer species? We hypothesize that               efficiency of branches packing their leaves (Poorter et al., 2018).
  traits related to hydraulic efficiency and carbon assimilation pre-          SLA was calculated as leaf area per unit dry mass. LMFB was
  dict conifer species’ inherent growth rate since these traits allow          calculated as leaf dry mass divided by branch dry mass. LNBL
  species to have high photosynthesis. We expect that different                was calculated as the number of needles divided by branch length.
  traits underlie drought resistance and drought recovery. Drought
  resistance will increase with higher values for multiple hydraulic           Carbon and nutrient investments To estimate the carbon
  safety traits, whereas drought recovery will increase with traits            assimilation rate, the maximum photosynthetic rate per unit leaf
  associated with fast growth, such as high carbon assimilation rates          area (Aarea, lmol CO2 m 2 s 1) and stomatal conductance (gs,
  and soft tissues.                                                            mol H2O m 2 s 1) were measured using a portable

  New Phytologist (2022)                                                                                                           Ó 2022 The Authors
  www.newphytologist.com                                                                              New Phytologist Ó 2022 New Phytologist Foundation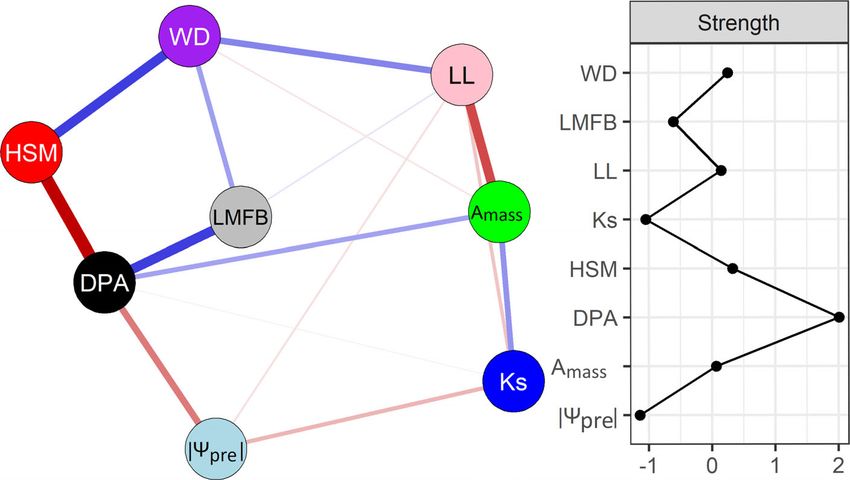
New
Phytologist Full paper 3
Table 1 Overview of 43 functional traits for 28 conifer species in this study: trait name, abbreviation, units, median, 5th percentile, 95th percentile and
coefficient of variation (CV) based on trait values (n = 3–6 individuals 9 28 species).
Percentile
Traits function Trait name Abbreviation Units Median 5th 95th CV
Leaf size and display Specific leaf area SLA cm2 g 1
59.20 36.10 116.72 0.45
(3) Leaf mass fraction of the branch LMFB gg 1 0.84 0.54 0.93 0.15
Leaf number per branch length LNBL mm 1 1.44 0.48 3.94 0.73
Carbon and nutrient Photosynthetic rate (area) Aarea lmol CO2 m 2 s 1 8.03 4.31 14.97 0.39
investments (7) Photosynthetic rate (mass) Amass nmol CO2 g 1 47.37 24.12 90.44 0.46
Stomatal conductance gs mol H2O m 2 s 1 0.06 0.03 0.14 0.52
Intrinsic water-use efficiency iWUE mmol CO2 132.40 69.34 181.16 0.26
(molH2O) 1
Leaf nitrogen concentration N % 1.45 0.98 2.37 0.27
Leaf phosphorus concentration P % 0.13 0.06 0.24 0.43
Leaf potassium concentration K % 0.44 0.24 0.83 0.38
3
Tissue toughness (6) Leaf density LD g cm 0.41 0.23 0.49 0.20
Leaf dry matter content LDMC gg 1 0.48 0.37 0.53 0.16
Wood dry matter content WDMC gg 1 0.51 0.42 0.58 0.11
3
Bark density BD g cm 0.42 0.34 0.51 0.14
3
Wood density WD g cm 0.53 0.44 0.66 0.12
Leaf lifespan LL yr 5.00 1.00 9.00 0.52
Wood anatomy (13) Hydraulic diameter Dh µm 12.49 10.35 17.76 0.18
Tracheid density TD mm 2 3.57 9 103 2.34 9 103 4.69 9 103 0.21
Wall thickness (earlywood) Tw_E µm 2.34 1.82 3.16 0.18
Wall thickness (latewood) Tw_L µm 2.92 2.37 3.75 0.52
Thickness to span ratio TSR_E µm µm 1
0.17 0.08 0.51 0.79
(earlywood)
Thickness to span ratio (latewood) TSR_L µm µm 1 0.78 0.15 1.98 0.84
Pit aperture diameter DPA µm 4.29 3.12 5.16 0.16
Pit aperture resistance RPA MPa s m 3 3.28 9 108 2.10 9 108 1.00 9 109 0.71
Pit membrane diameter DPM µm 12.83 9.86 15.31 0.14
Torus diameter DT µm 0.35 0.28 0.44 0.14
Margo flexibility MF – 0.48 0.44 0.58 0.09
Torus overlap TO – 0.35 0.28 0.44 0.14
Valve effect VE – 0.17 0.14 0.20 0.11
Hydraulics and Predawn water potential |Ψpre| MPa 1.13 0.73 1.91 0.30
cavitation resistance Minimum water potential |Ψmin| MPa 1.83 1.45 2.25 0.15
1 1 1
(8) Xylem-specific hydraulic Ks kg m s MPa 0.29 0.08 0.67 0.59
conductivity
1 1 1
Pit-specific hydraulic conductivity Kpit kg m s MPa 0.34 0.24 0.81 0.45
Xylem pressure when 12% of |P12| MPa 3.05 2.31 5.09 0.26
hydraulic conductivity is lost
Xylem pressure when 50% of |P50| MPa 3.72 2.92 7.34 0.32
hydraulic conductivity is lost
Xylem pressure when 88% of |P88| MPa 4.33 3.37 9.83 0.38
hydraulic conductivity is lost
Hydraulic safety margin HSM MPa 2.16 1.27 5.33 0.51
Pressure–volume traits Turgor loss point |ΨTLP| MPa 1.57 0.90 1.93 0.24
(6) Osmotic potential at full turgor |p0| MPa 1.02 0.62 1.51 0.29
Bulk modulus of elasticity of cell e MPa 10.99 4.07 20.94 0.51
walls
2 1
Hydraulic capacitance at full turgor CFT mol m MPa 0.06 0.04 0.14 0.53
Saturated water content SWC gg 1 1.76 1.19 2.60 0.26
Relative water content at turgor RWCtlp % 90.72 75.14 95.90 0.16
loss point
photosynthesis meter (Li-6400; Li-Cor, Lincoln, NE, USA) . when being expressed on a mass basis (Osnas et al., 2013), we
Given that the physiological efficiency of plants is better used the maximum photosynthetic rate per unit leaf mass (Amass,
expressed on a mass basis, and that the LES is more pronounced nmol CO2 g 1) as the indicator of carbon assimilation capacity
Ó 2022 The Authors New Phytologist (2022)
New Phytologist Ó 2022 New Phytologist Foundation www.newphytologist.com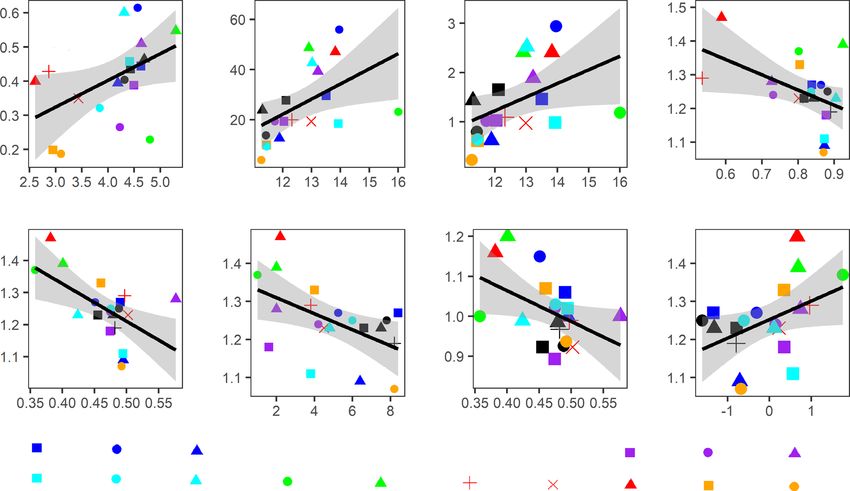
New
4 Full paper                                                                                                                       Phytologist

  (He et al., 2019). Amass was obtained by multiplying Aarea by           content (SWC, g g 1), hydraulic capacitance at full turgor (CFT,
  SLA. Intrinsic water use efficiency (iWUE, mmol CO2                     mol m 2 MPa 1) and bulk modulus of elasticity of the cell wall
  (molH2O) 1) was calculated as Aarea/gs (Yao et al., 2021). Leaf         (Ɛ, MPa). For more detailed information, see Methods S5.
  N, P and K concentrations were measured using a flow-injection
  autoanalyzer. For detailed measurements, see Methods S2.
                                                                          Inherent growth rate and drought resilience components
  Tissue toughness Leaf density (LD, g cm 3), leaf lifespan (LL,          For inherent growth rate and drought resilience components (i.e.
  yr), bark density (BD, g cm 3), wood density (WD, g cm 3), leaf         resistance, recovery and resilience), we measured tree rings for the
  dry matter content (LDMC, g g 1) and wood dry matter content            period 1974–2017 for 20 of the 28 species. Eight species were
  (WDMC, g g 1) all contribute to toughness construction and              excluded because trustful tree-ring dating and/or physiological
  structural reinforcement (Wright et al., 2005; Poorter et al.,          measurements were not feasible for them (e.g. Juniperus species)
  2018). LD, BD and WD were calculated as the corresponding               (Table S1). To quantify the inherent growth rate of species, three
  dry mass divided by fresh volume. LDMC and WDMC were cal-               different dimensions of growth rate were obtained from Song
  culated as the corresponding dry mass divided by fresh mass. LL         et al. (2021): stem diameter growth rate (cm yr 1), stem basal
  was defined by the oldest leaf along the main branch, cutting           area growth rate (BAI, cm2 yr 1) based on the averaged basal area
  down the branch at the position where the oldest leaf appeared          increment, and stem mass growth rate (kg yr 1 m 1) calculated
  and counting annual rings. Deciduous species were all counted as        based on wood density and stem area growth (Sterck et al., 2012).
  1 yr for their LL.                                                      These growth rates were calculated based on the first 20 yr since
                                                                          tree species were established, the canopy was perhaps relatively
  Wood anatomy Wood anatomical traits indicate species capac-             open and there was less competition among individuals (see
  ity for hydraulic transport (i.e. conduits and pits) and cavitation     methods described by Song et al., 2021).
  resistance (i.e. pit size and sealing) (Delzon et al., 2010; Poorter       To calculate drought resilience components (i.e. resistance,
  et al., 2010). On the transverse section, tracheid traits, namely       recovery and resilience), we first quantified drought year using a
  hydraulic (weighted) diameter (lm), tracheid density (mm 2),            climate–water balance index (i.e. standardized precipitation evap-
  wall thickness for earlywood and latewood (lm), and thickness           otranspiration index, SPEI), and then calculated the three
  to span ratio for earlywood and latewood (lm lm 1), were mea-           drought resilience components based on each drought year.
  sured using light microscopy. Along the tangential section, pit         Drought resistance was the ratio of tree-ring width (TR) during
  traits, that is diameter of pit aperture (DPA, lm), pit membrane        drought to mean TR 2 yr earlier, recovery was the ratio of mean
  (DPM, lm) and torus (DT, lm), pit aperture resistance (i.e. RPA,        TR two years after drought to TR during drought, and drought
  MPas m 3) and pit sealing (i.e. torus overlap, margo flexibility       resilience was the ratio of mean TR 2 yr after drought to mean
  and valve effect) were measured using electron microscopy (see          TR 2 yr before (Fig. S2). These indices were averaged per species
  Methods S3; Song et al., 2022).                                         for further analysis. For the quantification of drought year and
                                                                          calculation of resilience components, see Methods S6.
  Hydraulics and cavitation resistance The xylem-specific
  hydraulic conductivity (Ks, kg m 1 MPa 1 s 1), xylem potential
                                                                          Climate origin of conifer species
  specific hydraulic conductivity (Kp, kg m–1 MPa 1 s 1) and pit-
  specific hydraulic conductivity (Kpit, kg m 1 MPa 1 s 1) all            Although it would have been best to know the climatic origin of
  indicate species water transport efficiency (Domec et al., 2006;        the provenance used in this experiment, this was not possible
  Poorter et al., 2010). Ks, Kp and Kpit were measured following          because the specific seed origin of the trees is not known. We
  Methods S4. To indicate species cavitation resistance to drought,       therefore quantified the climatic conditions in the distribution
  xylem pressures when 12, 50 or 88% of hydraulic conductivity            range of the species, based on occurrence data. Specifically, we
  was lost (P12, P50 and P88), predawn water potential (Ψpre, MPa),       determined the range of distributions of all 28 species based on
  minimum water potential (Ψmin, MPa) and hydraulic safety                Farjon & Filer (2013), which allowed us to determine the original
  margin (i.e. HSM = Ψmin P50, MPa) for the twigs were mea-               distribution per species, thus avoiding areas where the species had
  sured. P12, P50, P88, Ψmin and HSM are good predictors for              been introduced. We then extracted the occurrence records (i.e.
  species hydraulic safety and drought resistance (Bhaskar & Ack-         longitude and latitude, Fig. S3) of each species from the Global
  erly, 2006; Anderegg et al., 2016).                                     Biodiversity Information Facility (GBIF, 2019) using the R RGBIF
                                                                          package (Chamberlain et al., 2017: https://www.gbif-uat.org/).
  Pressure–volume traits Leaf water potential at turgor loss point           Based on occurrence records, we extracted elevation and cli-
  (ΨTLP, MPa) is a good predictor for drought tolerance. A more           mate data related to water deficit, heat and cold. Water deficit
  negative turgor loss point implies species have lower leaf wilting      includes the following factors: mean annual precipitation (MAP,
  risks and would be more drought-tolerant (Bartlett et al., 2012;        mm), mean annual evapotranspiration (PET, mm) and mean
  Marechaux et al., 2015). A bench dehydration technique was used        annual aridity index (MAI), minimum and maximum monthly
  to determine pressure–volume traits (Sack et al., 2011), that is tur-   precipitation (Pmin, mm; Pmax, mm), and maximum monthly
  gor loss point, osmotic potential at full turgor (p0, MPa), relative    potential evapotranspiration (PETmax, mm month–1). Mean
  water content at turgor loss point (RWCtlp, %), saturated water         annual aridity index was calculated based on the ratio of annual

  New Phytologist (2022)                                                                                                      Ó 2022 The Authors
  www.newphytologist.com                                                                         New Phytologist Ó 2022 New Phytologist Foundation
New
Phytologist Full paper 5
precipitation and annual potential evapotranspiration (Trabucco done with eight trait names as nodes, and partial correlation coef-
& Zomer, 2018). Heat and cold factors include the following ficients between every two nodes after controlling all other vari-
indices: mean annual temperature (MAT, °C), minimum and ables in the dataset as edges (Poorter et al., 2021). To assess the
maximum monthly temperature (Tmin, °C; Tmax, °C), and maxi- importance of nodes in the network, centrality was computed by
mum monthly solar radiation (SRmax, kJ m 2 d 1). Elevation, summing the absolute values of partial correlations to obtain the
MAP, Pmin, Pmax, MAT, Tmin, Tmax and SRmax were extracted higher values quantified as important traits (Epskamp & Fried,
from WORLDCLIM 2.0 (http://worldclim.org/version2). PETmax, 2018; Epskamp et al., 2018). To check the sensitivity of the net-
PET and MAI were extracted for the original distribution sites work for trait selection, we performed 100 random selections of
from a global dataset by Trabucco & Zomer (2018). one trait per group, repeated the network analysis 100 times, and
All climate data were extracted based on the period 1970– calculated from this the average importance values of each of the
2000 with a resolution of 1 km2 by implementing the R RASTER 43 traits based on the networks when it was included (Fig. S6).
package (Hijmans et al., 2015). To better quantify the climatic This showed that DPA still occupied an important position in
limits for each species distribution, the 10th, 50th and 90th per- the network. Network analysis was performed with the R package
centiles of climatic variables based on each species were subse- BOOTNET (Epskamp et al., 2015).
quently extracted. Because different quantiles of climate data To assess how functional traits affect growth rate and drought
gave similar results (Tables S2–S5), we used the 90% quantile of resilience, we first used bivariate Pearson correlations and then
climate data for further analysis. used model selection with dredge function in the MUMIN package
(Barton, 2020) based on the selected groups from cluster analysis.
To compare the effect size of different traits, all traits were stan-
Data analysis
dardized by subtracting the mean and dividing by the standard
To address our research questions we used three complementary deviation.
analyses: a cluster analysis to identify how these 43 traits were To assess how climatic harshness affects stem growth, drought
coordinated into different functions, a principal component anal- resilience and the underlying functional traits, bivariate Pearson
ysis (PCA) to evaluate how traits were associated and what plant correlations were used. All data analyses were performed using R
strategy spectra can be distinguished, and network analysis to v.4.0.2 (R Core Team, 2020) and residuals were checked for nor-
identify which ‘core traits’ or ‘central hub traits’ (He et al., 2020) mality and homoscedasticity with QQ plots.
are strongly linked to other traits and underlie trait coordination.
Before analysis, data were log10-transformed to improve normal-
Results
ity and homoscedasticity. We used the absolute values of Pearson
correlation to do the cluster analysis. Pearson correlation and
Trait clusters
cluster analysis were carried out with the R packages HMISC (Har-
rell & Harrell, 2019) and PHEATMAP (Kolde, 2019), respectively. Eight functional trait groups were identified using hierarchical
Second, PCA was performed in CANOCO 5 based on identified clustering (Fig. 1). The first cluster (in light blue) consisted of
cluster groups. We used the first two principal components three traits related to drought tolerance since it contains predawn
because the third and fourth PCA axes explained considerably less and minimum branch water potential (Ψpre and Ψmin), and it
of the variation (respectively 10 and 7%), and a parallel analysis was also associated with leaf phosphorus (P). The second cluster
(Dinno, 2018) indicated that only the first two principal compo- (in purple) consisted of three traits related to branch toughness,
nents were significant (Fig. S4). including wood density (WD), wood dry matter content
The cluster analysis resulted in eight clusters of closely associ- (WDMC) and bark density (BD). The third cluster (in blue)
ated traits. Although a cluster may have multiple functions, we consisted of traits related to water transport, including stem-
coined each cluster according to its most important function, for specific conductivity (Ks), pit conductivity (Kpit), cell wall thick-
the sake of clarity and overview. To assess which traits are ‘central ness and thickness to span ratio of the earlywood (Tw_E and
traits’ or ‘key traits’, which are closely associated with other traits TSR_E). The fourth cluster (in red) consisted of traits related to
for mechanistic or ecological reasons, we used network analysis. water use efficiency (iWUE, gs, Dh and TD) and cavitation resis-
Note that multivariate analysis with larger numbers of variables tance (P12, P88, P50, HSM). The fifth cluster (in pink) contained
than observations may induce low confidence (Jennions & three traits related to leaf toughness, namely leaf dry matter con-
Møller, 2003). For this statistical reason, the maximum number tent (LDMC), leaf density (LD) and leaf lifespan (LL). The sixth
of traits that can be included in a network analysis of 28 species is cluster (in green) was composed of traits related to carbon assimi-
eight. For each of the eight identified clusters, we therefore lation (SLA, N and Amass) and water status of the symplast
selected one trait based on two different criteria (Table S6), (|ΨTLP| and |p0|). The seventh cluster (in grey) reflected branch-
resulting in two different network analyses (Fig. S5): we selected level traits mainly associated with structure such as leaf mass frac-
the most ecologically relevant trait, based on the literature, and tion of the branch (LMFB), latewood structure such as cell wall
we selected for each cluster group the trait that had the highest thickness and thickness to span ratio of the latewood (Tw_L and
number of significant bivariate correlations with the other 42 TSR_L). The eighth cluster (in black) was the largest and
traits because a network analysis requires high collinearity among involved 12 pit traits, that is those related to pit size such as the
variables (Epskamp & Fried, 2018). The network analysis was diameter of the pit aperture, pit membrane and torus (DPM,
Ó 2022 The Authors New Phytologist (2022)
New Phytologist Ó 2022 New Phytologist Foundation www.newphytologist.comNew
6 Full paper Phytologist
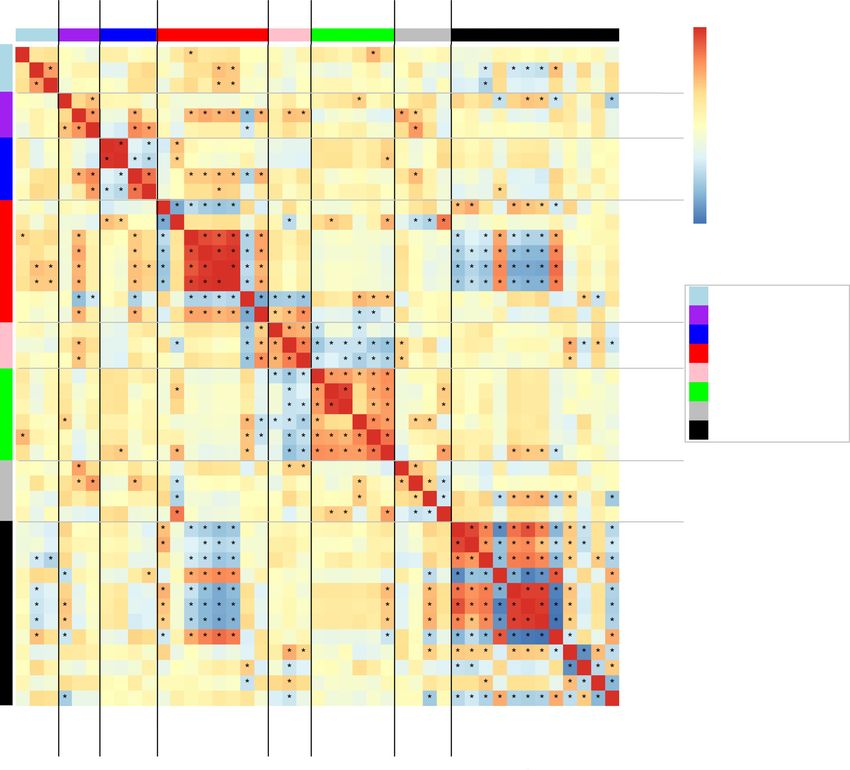
Fig. 1 Covariance of plant functional traits (n = 28 species) analyzed by cluster analysis (hierarchical clustering) combined with a heatmap of covariation
among the 43 traits. Trait correlations are indicated using colors; warm (red) shades indicate positive Pearson correlations and cool (blue) shades indicate
negative correlations. The distance tree of traits derived from hierarchical clustering is illustrated at the top. Eight resulting clusters are given names: group
1, drought tolerance; group 2, branch toughness; group 3, water transport; group 4, cavitation resistance; group 5, leaf toughness; group 6, carbon
assimilation and water status; group 7, branch-level trait associated with structure; and group 8, pit size and pit sealing. The number of groups is shown at
the bottom and right. *, P < 0.05. For trait abbreviations see Table 1.
DPA and DT), and pit sealing such as torus overlap (TO), margo biomechanical safety (red, blue and light blue) at the left and
flexibility (MF) and valve effect (VE). hydraulic efficiency (black and blue) at the right. It also indicated
We then further explored the relationships among these traits a conservative strategy with high cavitation resistance (red), cell
and the eight groups using PCA. The first two PCA axes wall thickness (Tw_L and Tw_E; blue) and thickness-to-span
explained 63% of the variation and showed two trait spectra ratio of earlywood (TSR_E, blue) on the left side of the axis; and
(Fig. 2). The first axis reflected a trade-off between hydraulic and an acquisitive strategy with high water use efficiency (iWUE, red)
New Phytologist (2022) Ó 2022 The Authors
www.newphytologist.com New Phytologist Ó 2022 New Phytologist FoundationNew
Phytologist Full paper 7
flexibility (MF) to the left, and conductive Pinaceae with wide
pits and potentially fast growth to the right.
The second axis reflected a trade-off between leaf tissues tough-
ness and lifespan at the lower end of the axis vs carbon assimila-
tion at the higher end of the axis, where tissues toughness (pink)
was associated with high leaf density (LD), leaf lifespan (LL) and
leaf dry matter content (LDMC) at the bottom; and carbon
assimilation (green) associated with high specific leaf area (SLA),
photosynthetic rate (Amass) and hydraulic diameter (Dh) at the
top.
Trait network
When traits for the network analysis were selected based on
mechanistic reasons, then the most central trait was pit aperture
diameter (DPA), which was positively related to carbon assimila-
tion (Amass, photosynthetic rate) and negatively related to
drought tolerance (|Ψpre|, absolute value of predawn branch water
potential). It was followed by four traits with a similar centrality:
hydraulic safety margin (HSM), wood density (WD), leaf lifes-
pan (LL) and Amass (Fig. 3). A comparable network was obtained
Fig. 2 Principal components analysis (PCA) for the first two PCA axes of
when the eight traits were selected based on statistical reasons (i.e.
43 traits across 28 conifer species. The x-axis indicates the hydraulics spec- the highest number of statistical correlations, Fig. S5). Finally,
trum and y-axis indicates the leaf economics spectrum. Eight trait groups when an explorative sensitivity analysis was done, the DPA was
were classified based on cluster analysis in Fig. 1 and indicated with arrows still an important central trait next to DPM, but other important
in different colors. Different families (Cupresssaceae, Pinaceae, Taxaceae) traits included cavitation resistance traits such as Dh, P88 and
are indicated by different symbols. For trait abbreviations see Table 1, and
for species abbreviations (in light grey) see Supporting Information
HSM (Fig. S6).
Table S1.
Effects of traits on stem growth and drought resilience
and wide pits (DPA, DPM and DT; black) on the right side. Of all 43 traits evaluated, stem diameter growth only significantly
This hydraulic spectrum also reflected an old split between increased with pit aperture diameter (Fig. 4a), which was also
cavitation-resistant Cupressaceae and Taxaceae with high margo confirmed by the multiple regression (Tables 2, S7). Stem area
(a) (b)
Fig. 3 Ecological reason-based network analysis among eight main functional traits from eight different clusters (a), and the strength of centrality indices
(b). Node colors vary among the different groups; see Fig. 1. Each trait is a node and connections represent partial correlation coefficients between two
variables after conditioning on all other variables. The links in blue indicate positive coefficients and the links in red indicate negative coefficients in the
model. The partial correlation value is proportional to the thickness of the links. Strength was calculated from accumulated values of absolute partial coeffi-
cients between a focal node and all other connected nodes in the network. Strength was standardized by subtracting the mean from the specific values and
dividing it by the standard deviation. Large strength values indicate high central traits. For trait abbreviations see Table 1.
Ó 2022 The Authors New Phytologist (2022)
New Phytologist Ó 2022 New Phytologist Foundation www.newphytologist.comNew
8 Full paper Phytologist
(a) (b) (c) (d)
(e) (f) (g) (h)
Fig. 4 Bivariate significant relationships between growth rate and trait for (a) stem diameter growth and pit aperture diameter (DPA), (b) stem area growth
and hydraulic diameter (Dh), (c) stem mass growth and hydraulic diameter; and relationships between growth resilience components and traits or PC2
scores for: (d) recovery and leaf mass fraction of the branch (LMFB), (e) recovery and leaf dry matter content (LDMC), (f) recovery and leaf lifespan,
(g) resilience and leaf dry matter content (LDMC), and (h) recovery and PC2 scores from the result of PCA. Regression lines, 95% confidence intervals
(grey), R2 and P values are shown. The same color indicates the same genus. For species abbreviations see Supporting Information Table S1.
growth (BAI) and mass growth increased with hydraulic tracheid lesser extent, with maximum potential evapotranspiration
diameter (Fig. 4b,c). Unexpectedly, growth rate was not signifi- (PETmax) (Table 3). Similarly, drought resilience increased with
cantly related to any of the two PCA axes that reflect multivariate maximum solar radiation and mean annual evapotranspiration
trait strategies (Fig. S7). Hence, stem growth of conifer species (PET). Functional traits were also significantly related to climate
was determined by pit aperture size and hydraulic tracheid origin (Table S5).
diameter. Overall, species of warm climate origin, characterized by high
Bivariate correlations showed that drought recovery decreased solar radiation, temperature and evapotranspiration, had acquisi-
with an increase in leaf mass fraction of the branch (LMFB), leaf tive trait values (i.e. high stomatal conductance and photosyn-
dry matter content (LDMC) and leaf lifespan (LL) (Fig. 4d–f). thetic rate, short leaf lifespan, low leaf density, low cavitation
Drought recovery also increased with the second PCA axis, resistance and small valve effect), and hence high stem growth
reflecting a trade-off between carbon assimilation and leaf tough- rate and high stem growth resilience to drought.
ness and – to a lesser extent – branch toughness (R2 = 0.19,
P = 0.05; Fig. 4h). Multiple regression indicated that drought
Discussion
recovery was negatively affected by leaf lifespan (LL) (Table 2),
and positively affected by specific hydraulic conductivity (Ks) We assessed associations and clusters amongst 43 functional traits
(Table 2). Surprisingly, none of the traits could explain drought and showed how traits affected stem growth and drought
resistance. In sum, species with a slow turnover rate (i.e. long leaf resilience of conifer species. Two trait spectra were found. The
lifespan) have reduced drought recovery. first reflects a hydraulics spectrum driven by traits related to pit
size, pit sealing and cavitation resistance, indicating a trade-off
between hydraulic safety and hydraulic efficiency. The second
Relationships among climate origin, stem growth, drought
reflects an LES driven by traits related to leaf toughness and car-
resilience and functional traits
bon assimilation, reflecting a trade-off between leaf persistence
Pairwise correlations showed that stem growth rates in terms of and high leaf carbon assimilation. Stem growth rate increased
area, mass and diameter all increased with maximum solar radia- with traits of the first spectrum (i.e. large tracheids and pits),
tion (SRmax) of the species in their original climate, and, to a whereas drought recovery increased with traits related to the
New Phytologist (2022) Ó 2022 The Authors
www.newphytologist.com New Phytologist Ó 2022 New Phytologist FoundationNew
Phytologist Full paper 9
Table 2 Results of averaged models based on best models (DAICc < 2) showing how these functional traits from eight different cluster groups affect conifer
species growth (in light blue) and growth resilience (in light grey).
Model |Ψpre| WD Ks HSM LL Amass LMFB DPA
Stem diameter growth
Avg 0.48 0.62
Imp 0.73 1.00
P 0.04 0.01
Stem area growth
Avg 0.35 0.32 0.37 0.26 0.30
Imp 0.34 0.10 0.18 0.15 0.18
P 0.16 0.18 0.13 0.28 0.22
Stem mass growth
Avg 0.22 0.27 0.26 0.37 0.22 0.32
Imp 0.09 0.11 0.11 0.23 0.09 0.16
P 0.38 0.27 0.29 0.12 0.38 0.19
Resistance
Avg 0.24
Imp 1.00
P 0.31
Recovery
Avg 0.41 0.47 0.43
Imp 0.33 0.52 0.71
P 0.045 0.04 0.057
Resilience
Avg 0.27 0.23 0.30 0.30
Imp 0.16 0.13 0.20 0.20
P 0.27 0.34 0.21 0.22
The bold coefficients indicate P < 0.05. The model indexes, degrees of freedom (df), log-likelihood (logLik), corrected Akaike information criterion (AICc)
and AICc weight are given in Supporting Information Table S7. The average coefficients (Avg), relative importance (Imp) and significances (P) are shown.
The relative importance of the predictor variables is calculated as the sum of the Akaike weights over the best-selected models. |Ψpre|, predawn water
potential; Amass, photosynthetic rate (mass); DPA, pit aperture diameter; HSM, hydraulic safety margin; Ks, xylem-specific hydraulic conductivity; LL, leaf
lifespan; LMFB, leaf mass fraction of the branch; WD, wood density.
Table 3 Pearson correlations between the 90th quantile of climate data, stem growth rate, growth resilience and the first two PCA scores from Fig. 2.
Functional traits MAT Tmin Tmax MAP Pmin Pmax SRmax PETmax PET MAI Elev Long Lati
Growth rate Area 0.00 0.39 0.06 0.09 0.27 0.12 0.60 0.50 0.39 0.10 0.13 0.73 0.28
Mass 0.04 0.42 0.14 0.13 0.24 0.15 0.62 0.46 0.32 0.05 0.17 0.75 0.36
Diameter 0.14 0.24 0.18 0.10 0.18 0.09 0.49 0.31 0.20 0.03 0.20 0.70 0.26
Growth resilience Resistance 0.16 0.19 0.07 0.13 0.11 0.18 0.03 0.10 0.17 0.27 0.27 0.06 0.25
Recovery 0.02 0.35 0.00 0.09 0.33 0.03 0.42 0.44 0.33 0.20 0.01 0.37 0.19
Resilience 0.15 0.16 0.00 0.11 0.36 0.03 0.48 0.53 0.45 0.12 0.08 0.51 0.13
PCA scores PC1 0.22 0.27 0.15 0.14 0.11 0.11 0.16 0.19 0.07 0.01 0.37 0.12 0.03
PC2 0.51 0.23 0.56 0.09 0.20 0.05 0.01 0.24 0.35 0.20 0.12 0.01 0.25
The bold coefficients indicate P < 0.05. Similar results were produced when using the 10th quantile and 50th quantile of climate data, using Supporting
Information Tables S3 and S4. For trait abbreviations see Table 1. Elev, elevation; Lati, latitude; Long, longitude; MAI, mean annual aridity index; MAP,
mean annual precipitation; MAT, mean annual temperature; PET, mean annual evapotranspiration; PETmax, maximum potential evapotranspiration of
warmest month; Pmax, maximum precipitation of the wettest month; Pmin, minimum precipitation of the driest month; SRmax, maximum solar radiation
among the warmest months; Tmax, maximum temperature of the warmest month; Tmin, minimum temperature of the coldest month.
second spectrum (i.e. low leaf toughness and short leaf lifespan). scales. Structural trait clusters ranged from the subcellular level
Below we discuss how traits are associated and how they underlie (pit traits) to branch level (branch toughness) and leaf level (leaf
growth and drought resilience. toughness). Physiological trait clusters were related to hydraulics
(drought tolerance, water use efficiency and cavitation resistance,
water transport) and leaf physiology (carbon assimilation and
Trait associations and function for growth strategy of
water status). This suggests that the strongest integration is
conifers
within each organizational level (e.g. pit, leaf, branch, individual)
Trait associations We expected that traits are clustered accord- and less across these organizational levels, probably because of
ing to their main functions. We found eight clusters related to developmental reasons or optimization of specific physiological
structural and physiological traits at different organizational processes at each organizational level. The divergent clusters
Ó 2022 The Authors New Phytologist (2022)
New Phytologist Ó 2022 New Phytologist Foundation www.newphytologist.comNew
10 Full paper Phytologist
indicate that there is less tight integration across organs and func- adapt to divergent environments for their water use strategy in a
tions. This means suboptimal solutions at the whole-plant level changing climate.
and that different clusters may be important under different envi- The second axis reflected a trade-off between the leaf tough-
ronments. ness cluster (high LDMC, LD and LL) with lower water storage
Despite the weaker integration across clusters and their func- capacity at the branch level (low SWC and CFT) vs the carbon
tions, we found that leaf economics traits and stem hydraulic assimilation cluster (high SLA, N, K and Amass) (Figs 1, 2). It
traits were at least partly coupled (Figs 1, 2). Species with an indicates that tough tissues and increased leaf lifespan come at
acquisitive strategy for leaves, such as high leaf nutrient concen- the expense of a reduced photosynthetic capacity. This is consis-
trations (N, K), SLA, gs and Amass, had a larger hydraulic diame- tent with the literature showing that thick, dense leaves increase
ter (Dh) in the branches. Since wider tracheids increase hydraulic the resistance and pathlength for CO2 diffusion (Niinemets,
conductivity and water supply (Sterck et al., 2008), this may 2001), while nitrogen investment in cell wall defence cannot be
allow for a higher gs, transpiration rate and, coupled to that, invested in the photosynthetic enzyme Rubisco (Onoda et al.,
Amass (Brodribb & Feild, 2000; Chave et al., 2009) and growth 2017), and the observation that small and thick cells are metabol-
for both conifers (Sterck et al., 2012) and broadleaf trees (Poorter ically less active (Brown et al., 2004). In the long run, both leaf
et al., 2010). The key traits for carbon, nutrient and water eco- strategies may have a similar lifetime carbon gain, as short-lived
nomics are thus partly coordinated across leaf and stem. This leaves have a high capacity, and long-lived leaves have a long pho-
indicates that an integrated whole-plant economics spectrum tosynthetic revenue stream over the lifetime of a leaf (Westoby,
(Reich, 2014) also exists across conifer species (Rosas Torrent, 1998; Edwards et al., 2014). High leaf toughness was also associ-
2019). ated with lower water storage capacity at the branch level. Such
In contrast to our expectation, an acquisitive leaf strategy was lower water storage capacity implies high water potential fluctua-
associated with a large absolute (i.e. ‘safe’) twig turgor loss point tions, which may cause stomatal closure, and thus reduce carbon
(|ΨTLP|). Such large |ΨTLP| is commonly interpreted as an indica- gain (Sack & Tyree, 2005). In sum, the second axis thus mainly
tor of drought tolerance worldwide (Bartlett et al., 2012). Given reflects an LES, running from a conservative strategy with high
that the needles were dense and tiny, we used twigs for pressure– leaf toughness and long leaf lifespan to an acquisitive strategy
volume curves to infer leaf ΨTLP, reflecting twig ΨTLP rather than with leaf trait values that increase carbon gain.
needles. This may lead to different findings for twigs compared Pinaceae tend to occupy the efficient side of the hydraulics
with leaves; its is probable that twigs with their parenchyma and spectrum and Cupressaceae the safe side (Fig. 2). This suggests
bark have a larger hydraulic capacitance (CFT, SWC; Fig. 2). that the traits underlying these clusters (i.e. cavitation resistance
The reason for this puzzling result requires further attention in and pit size) are under strong phylogenetic control (cf. Song
future studies. et al., 2022). Gymnosperms are therefore characterized by a
strong evolutionary integration of hydraulic safety traits whereas,
Trait spectra and plant strategies The PCA shows that the trait for example, for tropical trees P50 and ΨTLP have been the result
clusters are loosely organized into different multivariate plant of repeated evolutionary adaptation (Guillemot et al., 2022). We
strategy axes (Fig. 2). The first axis is strongly associated with trait did not find a clear phylogenetic split along the LES, probably
clusters related to pit size and hydraulic safety measures, indicat- because all conifers have relatively tough and tiny needles
ing that wider pits that facilitate hydraulic conductivity come at with relatively less variation in leaf traits, whereas a global tree
the expense of reduced hydraulic safety (Roskilly et al., 2019). study that also included angiosperms did find that leaf nutrient
Overall, the first axis reflects a hydraulics spectrum, running from concentrations were phylogenetically conserved (Sardans et al.,
a conservative strategy with high hydraulic and biomechanical 2021).
safety (i.e. high cavitation resistance, more negative water poten-
tial, large hydraulic safety margin and dense wood with high What drives trait associations? Trait network analysis shows
wood dry matter content) to a more acquisitive strategy with that pit aperture diameter (DPA) is the most central trait in the
higher hydraulic efficiency (i.e. high conductivity and wide pits). trait network (Fig. 3). DPA is positively associated with increased
The trade-off between hydraulic and biomechanical safety and carbon assimilation (i.e. Amass) but comes at the cost of reduced
efficiency has been frequently found in Mediterranean (Quero hydraulic safety, as indicated by the negative correlation with
et al., 2011; Ramırez-Valiente et al., 2020), tropical and temper- HSM and |Ψpre|. Wide pits not only facilitate hydraulic transport
ate forests or tree species (Hacke et al., 2006; van der Sande et al., but may also result in relatively small torus overlap and, hence,
2019; Lopez et al., 2021), whereas the trade-offs across areas of higher cavitation risks (Jansen & McAdam, 2019).
temperate conifer species are rarely reported, or no such a trade- The second-most central trait is HSM. HSM is positively
off has been found within species (Lopez et al., 2013; Rosas et al., linked to WD, indicating that tough tissues, which can avoid tra-
2019). Hence, our study supports the evidence that such a cheid implosion, are also safer (Hacke et al., 2001). High HSM
safety–efficiency spectrum is not only found across angiosperms indicates that plants follow a hydraulically safe strategy by reduc-
and gymnosperms, where gymnosperms occupy the safe end of ing the risk of drought-induced cavitation and hydraulic failure.
angiosperms and gymnosperms (Yang et al., 2022), but also The importance of HSM is also highlighted by a global metaanal-
within gymnosperm species. We conclude that the hydraulics ysis (Choat et al., 2012), where tree species from biomes that dif-
spectrum exists in different forest ecosystems, enabling species to fer strongly in aridity operate at very similar hydraulic safety
New Phytologist (2022) Ó 2022 The Authors
www.newphytologist.com New Phytologist Ó 2022 New Phytologist FoundationNew
Phytologist Full paper 11
margins just above zero, presumably to balance the need for effects on growth (Zweifel & Sterck, 2018; Zweifel et al., 2020).
safety to survive in a certain environment, with the need to Droughts can either damage leaves through bleaching, photo-
increase carbon gain to effectively compete with other species. damage and membrane rupture that reduce leaf functioning
Additionally, the sensitivity analysis suggests that, apart from (Thomas & Gay, 1987; Hansen & D€orffling, 2003; Brodribb
HSM, other traits that belong to the cavitation cluster (P88 and et al., 2016) or lead to leaf loss, which in both cases results in
narrow Dh) occupy a central position in the trait network reduced carbon gain and recovery. Species with a short leaf lifes-
(Fig. S6). pan can rapidly replace damaged leaves with well-functioning
The network analysis further highlights some level of coordi- leaves, but species with a long leaf lifespan cannot, so they suffer
nation between leaf traits and stem traits across conifer species for a long time from the legacy of a reduced or damaged leaf
(Fig. 3). There are clear associations between leaf photosynthetic canopy (Zweifel et al., 2020). To our knowledge, this is the first
capacity (Amass) and the hydraulic water supply to the leaf (DPA study that shows that species with a conservative leaf economics
and Ks), probably because the latter facilitates gas exchange. The strategy (long leaf lifespan) have such a lower drought recovery.
positive association between WD and LL indicates that plants This adds an important ecological dimension to leaf lifespan,
with a conservative strategy of resource use (e.g. shade- or which is known as a key trait for multiple functions of plant
drought tolerance) have both long-lived leaves and dense wood. strategies, such as increasing stress tolerance and conserving nutri-
The coupled relationship between leaf and stem is consistent with ent, carbon and nutrient cycling (Edwards et al., 2014; Yu & He,
previous studies that leaf traits and wood traits were more related 2017). Whether the observed legacy effects of leaf lifespan on
for both species in different temperate forests (Kawai & Okada, drought recovery is something particular for conifers, or also
2019) and species coexisting in temperate forests (Maherali et al., occurs across broadleaf species or other forests, remains to be
2006). tested.
Mechanisms underlying growth rate and drought resilience Does climatic origin of a species affect stem growth rate
and drought resilience?
Pit aperture and tracheids determine stem growth We
expected that the stem growth of conifer species would increase We expected that species from harsh, xeric or cold habitats would
with stem traits that increase water transport capacity, with leaf have a reduced inherent growth rate and high drought resistance,
traits that increase photosynthetic carbon gain and with cheap tis- because these species were expected to be characterized by a con-
sue construction costs. Although hydraulic conductivity did not servative strategy with trait values associated with slow growth,
affect species growth, the underlying water transport traits such such as small tracheids, small pits and low specific leaf area
as pit aperture and tracheid size did increase the stem growth of (Wright et al., 2004; Larter et al., 2017; Maharjan et al., 2021).
conifer species (Fig. 4a–c; Table 2). Both larger pit aperture and Surprisingly, we did not find that species from dry climates had a
hydraulic diameter reflect larger tracheid dimensions and lower reduced growth rate or a high drought resilience. Perhaps the cli-
construction costs. The important role of DPA is also consistent matic origins of these temperate and boreal species from the
with the central role it plays amongst traits from the eight differ- northern hemisphere (MAT ranging from 8.5 to 18.8°C and
ent clusters (Fig. 3). To our knowledge, this is the first study that MAP ranging from 1053 to 2913 mm) were too similar or too
highlights the importance of pit aperture for stem diameter humid to find a response.
growth. Instead, for our species pool we found that species from bright
climates (i.e. high solar radiation and potential evapotranspira-
Leaf lifespan reduces drought recovery Drought resilience con- tion) followed an acquisitive strategy, with high stomatal conduc-
sists of resistance and recovery. We expected that resistance is tance, fast leaf turnover rate (i.e. short leaf lifespan) and
explained by hydraulic stem and leaf traits, whereas drought photosynthetic rate (Table S5) and, hence, high growth rate and
recovery is explained by traits that increase carbon gain and drought resilience for these relatively humid species. Stem diame-
growth. Surprisingly, none of the putative drought tolerance ter growth was also positively related to pit aperture, but pit aper-
traits of stems (e.g. small pits, strong pit sealing and large cavita- ture was not related to climatic origin, probably because it is
tion resistance) and leaves (e.g. negative ΨTLP and Ψmin) could phylogenetically conserved (Song et al., 2022). The observed rela-
explain drought resistance. Hydraulic traits such as P50 may tionship between drought resilience and potential evapotranspira-
increase drought tolerance in extremely arid systems (Plaut et al., tion is probably because evapotranspiration is strongly positively
2012), but may be less important under the relatively mild mar- correlated with radiation (Table S2). Hence, for our study species
itime climatic conditions of our study site where drought avoid- high solar radiation rather than climatic drought affects their
ance, for example through deep roots, may become important drought resilience, perhaps because most of our species come
(Choat et al., 2018). originally from relatively humid climates.
Leaf toughness and leaf lifespan were the best predictors of
drought recovery: tree species with a longer leaf lifespan (and
Conclusions
tougher leaves) recovered more poorly after drought. This obser-
vation is in line with predictions from a theoretical model, show- This study shows that leaf and stem traits are coordinated in
ing that slower organ turnover rates can cause stronger legacy terms of carbon assimilation and hydraulic efficiency. Two main
Ó 2022 The Authors New Phytologist (2022)
New Phytologist Ó 2022 New Phytologist Foundation www.newphytologist.comNew
12 Full paper Phytologist
strategy spectra were identified, namely the hydraulics spectrum References
and LES. The hydraulics spectrum runs from a conservative strat-
Anderegg LD, Berner LT, Badgley G, Sethi ML, Law BE, HilleRisLambers J.
egy with high hydraulic and biomechanical safety to an acquisi- 2018. Within-species patterns challenge our understanding of the leaf
tive strategy with high hydraulic efficiency. The LES runs from a economics spectrum. Ecology Letters 21: 734–744.
conservative strategy with tough tissues and a long lifespan to an Anderegg WR, Klein T, Bartlett M, Sack L, Pellegrini AF, Choat B, Jansen S.
acquisitive strategy with high carbon assimilation. Pit aperture 2016. Meta-analysis reveals that hydraulic traits explain cross-species patterns
size is the central trait linking the hydraulics spectrum and LES. of drought-induced tree mortality across the globe. Proceedings of the National
Academy of Sciences, USA 113: 5024–5029.
As pits form the ‘hydraulic bottleneck’, a large pit size is associ- Bartlett MK, Scoffoni C, Sack L. 2012. The determinants of leaf turgor loss
ated with increased stem diameter growth. A long leaf lifespan point and prediction of drought tolerance of species and biomes: a global meta-
reduces drought recovery because of a reduced ability to replace analysis. Ecology Letters 15: 393–405.
drought-damaged tissues and track new climatic conditions with Barton K. 2020. Package ‘MUMIN’. Multi-model inference. R v.1.46.0. [WWW
new, acclimated leaves. These insights may be used to improve document] URL https://cran.r-project.org/web/packages/MuMIn/MuMIn.pdf
[accessed 1 March 2021].
our models and predictions of tree responses to an uncertain and Bellard C, Bertelsmeier C, Leadley P, Thuiller W, Courchamp F. 2012.
drier future. Impacts of climate change on the future of biodiversity. Ecology Letters
15: 365–377.
Bhaskar R, Ackerly D. 2006. Ecological relevance of minimum seasonal water
Acknowledgements potentials. Physiologia Plantarum 127: 353–359.
Brodribb TJ, Bienaime D, Marmottant P. 2016. Revealing catastrophic failure
This study was funded by the KNAW Fonds Ecologie under of leaf networks under stress. Proceedings of the National Academy of Sciences,
grant no. KNAWWF/807/19033, Oudemans Foundation from USA 113: 4865–4869.
Schovenhorst estate, LEB fonds from Wageningen University Brodribb T, Feild T. 2000. Stem hydraulic supply is linked to leaf photosynthetic
(2018-051C Song) and the China Scholarship Council (CSC, capacity: evidence from New Caledonian and Tasmanian rainforests. Plant,
no. 201706140106). We are very grateful to Jop de Klein and Cell & Environment 23: 1381–1388.
Brodribb TJ, Powers J, Cochard H, Choat B. 2020. Hanging by a thread?
Els van Ginkel for allowing fieldwork at Schovenhorst and for Forests and drought. Science 368: 261–266.
logistical support. We thank Surya Kumar Maharjan, Masha T. Brown JH, Gillooly JF, Allen AP, Savage VM, West GB. 2004. Toward a
van der Sande and Dylan Craven for providing analysis code. We metabolic theory of ecology. Ecology 85: 1771–1789.
are very grateful to Ute Sass-Klaassen for commenting on Chamberlain S, Ram K, Barve V, Mcglinn D, Chamberlain MS. 2017. Package
drought resilience calculations. We acknowledge Angelina ‘RGBIF’. Interface to the Global Biodiversity Information Facility ‘API’. R v.0.9.7.
[WWW document] URL https://cran.microsoft.com/snapshot/2017-04-05/
Horsting, Chenxuan Li, Dainius Masili unas, Ellen Wilderink, web/packages/rgbif/rgbif.pdf [accessed 10 May 2018].
Jing Li, Jose A. Medina-Vega, Leo Goudzwaard, Linar Akhmet- Chave J, Coomes D, Jansen S, Lewis SL, Swenson NG, Zanne AE. 2009.
zyanov, Manuel Rodriguez Carracedo, Matteo Dell’Oro, Na Towards a worldwide wood economics spectrum. Ecology Letters 12: 351–
Wang, Rodrigo Munoz Aviles, Sylvain Delzon, Weixuan Peng, 366.
Xiaohan Yin, Yanjie Xu, Shanshan Yang, Shenglai Yin, Zexin Choat B, Brodribb TJ, Brodersen CR, Duursma RA, Lopez R, Medlyn BE.
2018. Triggers of tree mortality under drought. Nature 558: 531–539.
Fan and Zulin Mei for assistance with fieldwork and lab work. Choat B, Jansen S, Brodribb TJ, Cochard H, Delzon S, Bhaskar R, Bucci SJ,
The authors have no conflicts of interest to declare. Feild TS, Gleason SM, Hacke UG et al. 2012. Global convergence in the
vulnerability of forests to drought. Nature 491: 752–755.
Cornelissen JHC, Sass-Klaassen U, Poorter L, van Geffen K, van Logtestijn
Author contributions RSP, van Hal J, Goudzwaard L, Sterck FJ, Klaassen RKWM, Freschet GT
et al. 2012. Controls on coarse wood decay in temperate tree species: birth of
YS, FS and LP designed the study, and BK, XZ, QL and YS con- the LOGLIFE experiment. Ambio 41: 231–245.
tributed to data collection. YS analysed the data, and LP, FS and Davies S, Bathgate S, Petr M, Gale A, Patenaude G, Perks M. 2020.
YS discussed and explained the results. YS wrote the first draft of Drought risk to timber production–A risk versus return comparison of
the manuscript, which was edited by all authors. commercial conifer species in Scotland. Forest Policy and Economics 117:
102189.
Delzon S, Douthe C, Sala A, Cochard H. 2010. Mechanism of water-stress
ORCID induced cavitation in conifers: bordered pit structure and function support
the hypothesis of seal capillary-seeding. Plant, Cell & Environment 33:
Bart Kruijt https://orcid.org/0000-0002-6186-1731 2101–2111.
Qi Liu https://orcid.org/0000-0003-3962-0867 DeSoto L, Cailleret M, Sterck F, Jansen S, Kramer K, Robert EMR, Aakala T,
Amoroso MM, Bigler C, Camarero JJ et al. 2020. Low growth resilience to
Lourens Poorter https://orcid.org/0000-0003-1391-4875 drought is related to future mortality risk in trees. Nature Communications 11:
Yanjun Song https://orcid.org/0000-0001-6495-7133 1–9.
Frank Sterck https://orcid.org/0000-0001-7559-6572 Dıaz S, Kattge J, Cornelissen JHC, Wright IJ, Lavorel S, Dray S, Reu B, Kleyer
Xiaqu Zhou https://orcid.org/0000-0002-2129-0209 M, Wirth C, Colin Prentice I et al. 2016. The global spectrum of plant form
and function. Nature 529: 167–171.
Dinno A. 2018. PARAN: Horn’s test of principal components/factors. R v.1.5.2.
Data availability [WWW document] URL https://cran.r-project.org/web/packages/paran/index.
html [accessed 20 December 2021].
The data and code that support this study are available upon rea- Domec JC, Lachenbruch B, Meinzer FC. 2006. Bordered pit structure and
sonable request from the coauthors. function determine spatial patterns of air-seeding thresholds in xylem of
New Phytologist (2022) Ó 2022 The Authors
www.newphytologist.com New Phytologist Ó 2022 New Phytologist FoundationYou can also read