Mechanisms and therapeutic implications of hypermutation in gliomas

Page created by Bryan Turner
 
CONTINUE READING
Mechanisms and therapeutic implications of hypermutation in gliomas
Article

Mechanisms and therapeutic implications of
hypermutation in gliomas

https://doi.org/10.1038/s41586-020-2209-9                 Mehdi Touat1,2,3,34 ✉, Yvonne Y. Li2,4,34, Adam N. Boynton2,5, Liam F. Spurr2,4,
                                                          J. Bryan Iorgulescu4,6, Craig L. Bohrson7,8, Isidro Cortes-Ciriano9, Cristina Birzu3,
Received: 22 July 2019
                                                          Jack E. Geduldig1, Kristine Pelton1, Mary Jane Lim-Fat4,10, Sangita Pal2,4, Ruben Ferrer-Luna2,4,11,
Accepted: 4 March 2020                                    Shakti H. Ramkissoon11,12, Frank Dubois2,4, Charlotte Bellamy1, Naomi Currimjee4,
                                                          Juliana Bonardi1, Kenin Qian5, Patricia Ho5, Seth Malinowski1, Leon Taquet1, Robert E. Jones1,
Published online: 15 April 2020
                                                          Aniket Shetty13, Kin-Hoe Chow13, Radwa Sharaf11, Dean Pavlick11, Lee A. Albacker11,
    Check for updates                                     Nadia Younan3, Capucine Baldini14, Maïté Verreault15, Marine Giry15, Erell Guillerm16,
                                                          Samy Ammari17,18, Frédéric Beuvon19, Karima Mokhtari20, Agusti Alentorn3, Caroline Dehais3,
                                                          Caroline Houillier3, Florence Laigle-Donadey3, Dimitri Psimaras3, Eudocia Q. Lee4,10,
                                                          Lakshmi Nayak4,10, J. Ricardo McFaline-Figueroa4,10, Alexandre Carpentier21, Philippe Cornu21,
                                                          Laurent Capelle21, Bertrand Mathon21, Jill S. Barnholtz-Sloan22, Arnab Chakravarti23,
                                                          Wenya Linda Bi24, E. Antonio Chiocca24, Katie Pricola Fehnel25, Sanda Alexandrescu26,
                                                          Susan N. Chi5,27, Daphne Haas-Kogan28, Tracy T. Batchelor4,10, Garrett M. Frampton11,
                                                          Brian M. Alexander11,28, Raymond Y. Huang29, Azra H. Ligon6, Florence Coulet16,
                                                          Jean-Yves Delattre3,30, Khê Hoang-Xuan3, David M. Meredith1,6, Sandro Santagata1,6,31,32,
                                                          Alex Duval33, Marc Sanson3,30, Andrew D. Cherniack2,4, Patrick Y. Wen4,10, David A. Reardon4,
                                                          Aurélien Marabelle14, Peter J. Park7, Ahmed Idbaih3, Rameen Beroukhim2,4,10,35 ✉,
                                                          Pratiti Bandopadhayay2,5,27,35 ✉, Franck Bielle20,35 ✉ & Keith L. Ligon1,2,6,13,26,35 ✉

                                                          A high tumour mutational burden (hypermutation) is observed in some gliomas1–5;
                                                          however, the mechanisms by which hypermutation develops and whether it predicts
                                                          the response to immunotherapy are poorly understood. Here we comprehensively
                                                          analyse the molecular determinants of mutational burden and signatures in 10,294
                                                          gliomas. We delineate two main pathways to hypermutation: a de novo pathway
                                                          associated with constitutional defects in DNA polymerase and mismatch repair
                                                          (MMR) genes, and a more common post-treatment pathway, associated with acquired
                                                          resistance driven by MMR defects in chemotherapy-sensitive gliomas that recur after
                                                          treatment with the chemotherapy drug temozolomide. Experimentally, the
                                                          mutational signature of post-treatment hypermutated gliomas was recapitulated by
                                                          temozolomide-induced damage in cells with MMR deficiency. MMR-deficient gliomas
                                                          were characterized by a lack of prominent T cell infiltrates, extensive intratumoral
                                                          heterogeneity, poor patient survival and a low rate of response to PD-1 blockade.
                                                          Moreover, although bulk analyses did not detect microsatellite instability in
                                                          MMR-deficient gliomas, single-cell whole-genome sequencing analysis of
                                                          post-treatment hypermutated glioma cells identified microsatellite mutations.
                                                          These results show that chemotherapy can drive the acquisition of hypermutated
                                                          populations without promoting a response to PD-1 blockade and supports the
                                                          diagnostic use of mutational burden and signatures in cancer.

Identifying genomic markers of response to immune checkpoint                       data from other cancers7–9, these initial observations were derived
blockade (for example, PD-1 blockade) may benefit cancer patients                  from unique disease contexts such as constitutional DNA mismatch-repair
by providing predictive biomarkers for patient stratification and                  (MMR) deficiency syndrome 6. Therefore, the extent to which
identifying resistance mechanisms for therapeutic targeting. Glio-                 glioma patients at large will benefit from this approach is unknown.
mas typically have a low tumour mutational burden (TMB) and a                      While large amounts of genomic data on gliomas exist2,4,5,10,11,12, our
highly immunosuppressive microenvironment—two features associ-                     understanding of the clinical landscape of hypermutation and the
ated with immunotherapy resistance. Nevertheless, recent work has                  mechanisms that underlie its development remain unclear. Hypermu-
suggested that a subset of patients with high-TMB (hypermutated)                   tation is rare in newly-diagnosed gliomas (de novo hypermutation),
gliomas might benefit from PD-1 blockade6. Although consistent with                but common in tumours that have recurred after the use of alkylating

A list of affiliations appears at the end of the paper.

                                                                                                                    Nature | Vol 580 | 23 April 2020 | 517
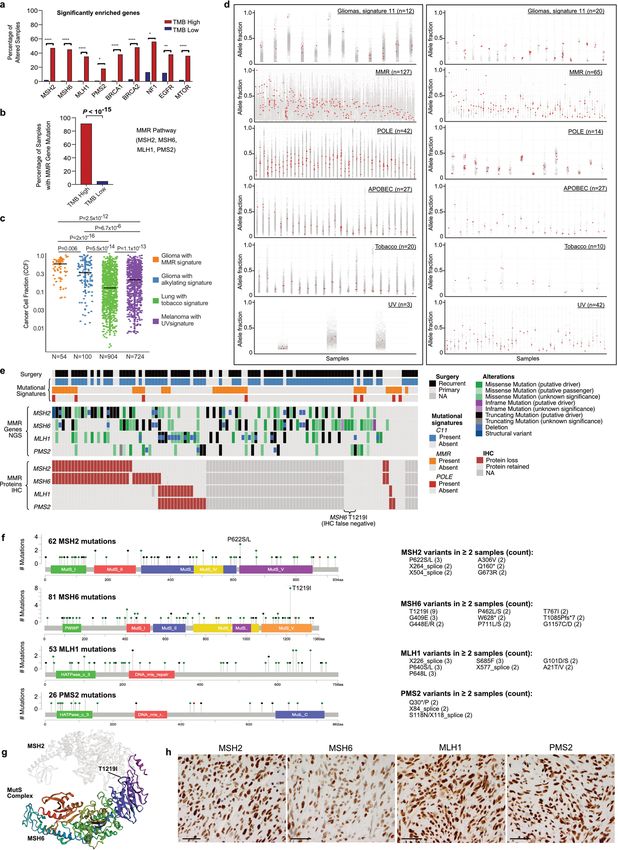
Mechanisms and therapeutic implications of hypermutation in gliomas
Article
agents (post-treatment hypermutation)4,5,10,11. Given that gliomas           only, P = 4.0 × 10⁻⁷; Extended Data Fig. 3f). Of note, the prevalence of
exhibit substantial inter-patient and intra-tumoral genomic varia-           hypermutation in post-temozolomide samples correlated with the
tion10,11,12, it remains to be determined whether molecular biomarkers       chemosensitivity of the primary, molecularly defined tumour type
(for example, IDH1 or IDH2 (hereafter IDH1/2) mutations) reliably pre-       (1p/19q co-deleted oligodendrogliomas (59.5%) > IDH1/2-mutant astro-
dict the development of hypermutation or response to immunotherapy.          cytomas (30.2%) > MGMT-methylated IDH1/2 wild-type glioblastomas
   An association between hypermutation and MMR mutations has                (23.1%) > MGMT-unmethylated IDH1/2 wild-type glioblastomas (5.6%);
been observed in gliomas1–4,13, but most of the reported MMR muta-           P = 3.8 × 10⁻⁷; Fig. 1b). We observed a similar pattern in the FMI validation
tions were not functionally characterized, and their role in causing         dataset (Extended Data Fig. 3g-i).
hypermutation is unclear. Other studies have suggested that alkylating          The systematic analysis of somatic mutation patterns by genome
agents such as temozolomide are the direct cause of hypermutation3.          sequencing has identified a variety of mutation signatures in human
This was supported by the discovery of a mutational signature (single        cancer which are driven by known and unknown DNA damage and repair
base substitution (SBS) signature 11) characterized by the accumulation      processes14. We examined the contributions of 30 previously reported
of G:C>A:T transitions at non-CpG sites in hypermutated gliomas after        signatures (COSMIC signatures v2) within our cohort to investigate
exposure to alkylating agents14. However, the fact that hypermutation is     the biological processes that cause hypermutation in gliomas. We first
undetectable in most gliomas that recur after temozolomide treatment         validated that mutational signatures can be predicted using large tar-
challenges this notion4,5. Furthermore, it remains unclear whether this      geted panel sequencing in hypermutated samples (Extended Data
mutational pattern enhances tumour immunogenicity and renders                Figs. 4, 5a–c). The majority of de novo hypermutated gliomas harboured
gliomas responsive to PD-1 blockade. Not all hypermutated cancers            mutational signatures associated with defects in the MMR pathway
respond to such treatments7–9; a more accurate characterization of the       (COSMIC signatures 6, 15, 26 and 14) or the DNA polymerase POLE
phenotypic and molecular features of hypermutated gliomas therefore          (10 and 14)14 (69% and 35% of samples, respectively; Extended Data
would help clinicians to manage such patients more effectively.              Fig. 5d, e), implying that constitutional deficiency in MMR or POLE was
                                                                             likely to be the underlying genetic cause of hypermutation. By contrast,
                                                                             98% of post-treatment hypermutated gliomas showed a mutational
Mutational burden and signatures in gliomas                                  signature that has been previously associated with temozolomide expo-
Previous studies included too few hypermutated gliomas to                    sure (signature 11). We also identified two distinct mutational signatures
characterize the landscape of hypermutation in gliomas1–5. We therefore      that were highly correlated with mutational signature 11 (Extended Data
created a cohort of sufficient scale (n = 10,294) and subtype diversity      Fig. 5b, c) including a previously undescribed signature (S2) associated
by leveraging large datasets generated from clinical sequencing panels       with 1p/19q co-deletion and lack of prior radiation therapy. Finally,
(DFCI-Profile, MSKCC-IMPACT and FMI)15–17. All samples from patients         half of the samples with a dominant signature 11 showed a co-existing
with a histopathological diagnosis of glioma were included and classi-       minor MMR- or POLE-deficiency signature component (Extended Data
fied into molecular subgroups according to histopathology, mutational        Fig. 5e), suggesting that defective DNA repair and mutagen exposure
status of IDH1/2, and whole-arm co-deletion of chromosomes 1p and            cooperate to drive hypermutation in recurrent gliomas.
19q (1p/19q co-deletion) (Extended Data Fig. 1, Supplementary Tables 1,
2). We quantified the TMB of all samples (median 2.6 mutations (mut.)
per Mb (range 0.0–781.3)), established thresholds for hypermutation          Molecular drivers of hypermutation
by examining the distribution of TMB (Extended Data Fig. 2)17, 18, and       Only a subset of temozolomide-treated samples (58 of 225, 25.8%)
identified 558 (5.4%) hypermutated gliomas (median TMB 50.8 mut.             showed evidence of hypermutation, suggesting that additional
per Mb (8.8–781.3)) for further analysis.                                    factors are required for its development. Although MMR defects
   Using samples with detailed clinical annotation (DFCI-Profile), we        have been consistently observed in hypermutated gliomas1–4,13, their
found that the prevalence of hypermutation varied between and within         co-occurrence with high TMB did not enable prior studies to deter-
subgroups (Fig. 1a, b, Extended Data Fig. 3a, b, Supplementary Table 3).     mine the degree to which MMR mutations represent passenger versus
Hypermutation was detected almost exclusively in diffuse gliomas             hypermutation-causing driver events. We systematically characterized
(99.1% of hypermutated samples) with high-grade histology (95.6%) and        mutations and copy number variants (CNVs; Supplementary Figs. 1, 2)
was more prevalent in recurrent tumours (16.6% versus 2.0% in newly          to identify hypermutation drivers using an unbiased approach that
diagnosed tumours; Fisher’s exact test, P < 10−15) (Fig. 1b). In samples     controlled for the increased incidence of passenger mutations associ-
of recurrent tumours, hypermutation was associated with markers              ated with hypermutation21. In the merged DFCI-Profile/MSKCC-IMPACT
of response to alkylating agents, including IDH1/2 mutation (hyper-          dataset, 36 genes were significantly enriched (q value < 0.01) in hyper-
mutation in 1.4% of newly diagnosed versus 25.4% of post-treatment           mutated tumours (Fig. 2a). Collectively, MMR mutations stood out
IDH1/2-mutant tumours, Fisher’s exact test, P = 2.0 × 10⁻¹³), 1p/19q         among the most enriched (91.2% versus 4.9% in non-hypermutated sam-
co-deletion (0.0% versus 33.8%, P = 7.3 × 10⁻¹¹), and MGMT promoter          ples, q < 1.6 × 10⁻¹⁵), and mutations in MSH6 showed the highest enrich-
methylation (2.4% versus 24.2%, P = 9.0 × 10⁻¹²). The effect of IDH1/2       ment (43.0% versus 1.2%, q = 3.3 × 10⁻⁷) (Extended Data Figs. 3j–l, 6a, b).
mutation was confirmed only in MGMT-methylated tumours (Extended             MMR-variant allele frequencies (VAFs) and cancer cell fractions (CCFs)
Data Fig. 3c). These findings suggest that selective pressure from ther-     in gliomas were most similar to those in MMR-deficient colorectal
apy may elicit progression towards hypermutation.                            (CRC) or endometrial cancers and were higher than in MMR-proficient
   The standard treatment for gliomas includes surgery, radiation and        hypermutated cancers (Extended Data Fig. 6c, d). Some MMR variants
chemotherapy with alkylating agents19,20. To assess the role of each         in post-treatment hypermutated samples matched the canonical sig-
of these in the development of hypermutation, we analysed associa-           nature 11 sequence context (Extended Data Fig. 5f), suggesting that
tions between TMB and detailed patterns of treatment in 356 recurrent        a subset of these variants are likely to have been caused by temozolo-
gliomas. Hypermutation was associated with prior treatment with              mide treatment.
temozolomide (Fisher’s exact test, P < 10−15) in a dose-dependent man-          As most MMR variants lacked functional annotation, we next inte-
ner (Fig. 1b, Extended Data Fig. 3d, e), but not with radiation (P = 0.88)   grated sequencing data with immunohistochemistry for protein
or nitrosoureas (P = 0.78). Among recurrent tumours from patients            loss (Extended Data Fig. 6e). Overall, results from both assays were
who had received only one adjuvant treatment modality, TMB was               concordant, consistent with MMR mutations leading to loss of func-
increased only in temozolomide-treated samples (median 16.32 (inter-         tion. In rare samples that lacked MMR variants, signature analysis and
quartile range (IQR) 6.95–70.32) versus 6.08 (3.80–7.97) with surgery        MMR immunohistochemistry revealed evidence for MMR deficiency,

518 | Nature | Vol 580 | 23 April 2020
Mechanisms and therapeutic implications of hypermutation in gliomas
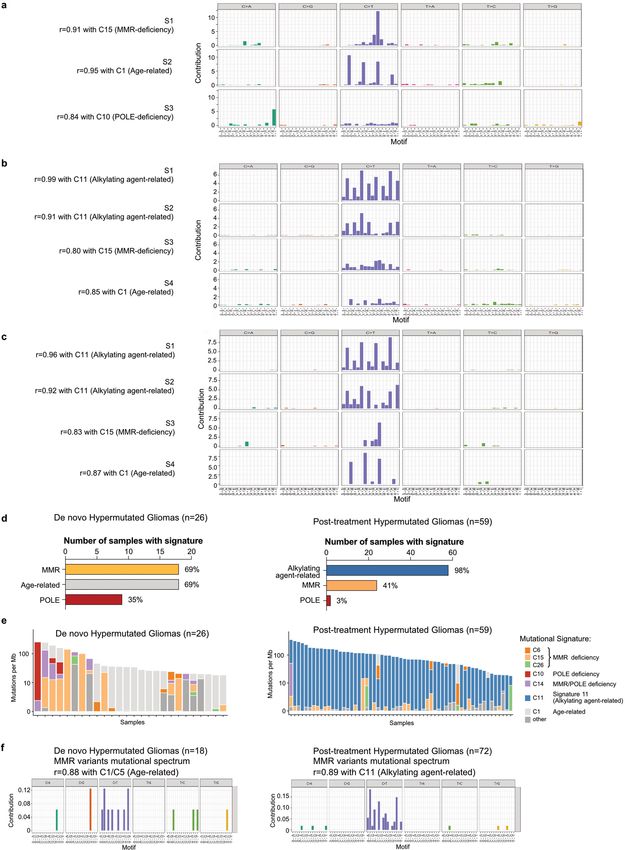
a                                                                                                                            b                                             Prevalence of hypermutation (%)
                                         Mutant IDH1/2                 Wild-type IDH1/2
                                                                                                                                                                         0          5         10            15     100

                              Oligodendrogliomas Astrocytomas   Glioblastomas              Other gliomas                       High-grade (n = 1,241)
                                   (n = 167)       (n = 281)       (n = 913)                 (n = 267)
                                                                                                             TMB                   Low-grade (n = 387)                                                  P = 3.0 × 10⁻⁷
                                                                                                              High
                              100                                                         Hypermut. cutoff                                                               0      5       10      15         20      100
                                                                                                              Normal
       Muts per Mb

                                                                                          17.0 per Mb
                                                                                                             IDH1/2 status          Primary (n = 1,272)
                               10                                                                             Mutant
                                                                                                                                   Recurrent (n = 356)                                                      P < 10–15
                                                                                                              Wild-type
                                0                                                                            CNV status                                                  0     20       40         60       80     100

                                                                                                                                    No. of TMZ cycles
                                                                                                              Absent
                               15                                                                                                                          18 (n = 33)
                                5
                                                                                                              Unmethylated
                                                                                                              NA                                                         0     20       40         60       80     100
                                0                                                                                                                            Primary
                                                                                                             Tumour grade                                                       P = 0.052
       Fraction of SNVs (%)

                              100                                                                             High                                          Post-TMZ

                               75                                                                             Low                                            Primary
                                                                                                             Age                                            Post-TMZ                           P = 2.0 × 10⁻¹⁵
                               50                                                                             0–13                                                       MGMT promoter methylation:
                                                                                                              14–39                                                       Unmethylated (n = 476)    Methylated (n = 462)
                               25
                                                                                                              40–older
                                0                                                                                                                                        0     20       40         60       80     100
                                                                                                             Surgery status
                                                                                                              Primary                                         Primary
          TMB                                                                                                                                               Post-TMZ                                       P < 10–15
                                                                                                              Recurrent
       IDH1/2
                                                                                                             Prior treatment                                  Primary
       1p/19q                                                                                                                                               Post-TMZ                         P = 1.2 × 10⁻⁹
                                                                                                              Yes
   7gain/10del                                                                                                                                                Primary
                                                                                                              No                                                                    P = 6.7 × 10⁻¹¹
       MGMT                                                                                                                                                 Post-TMZ
                                                                                                             Base change
        Grade                                                                                                                                                 Primary
                                                                                                             C>A                                                             P = 0.25
                                                                                                                                                            Post-TMZ
             Age                                                                                             C>G
                                                                                                             C>T                                                             Oligodendrogliomas, 1p/19q codel (n = 139)
 Surgery status                                                                                                                                                              Astrocytomas, mut. IDH1/2 (n = 248)
                                                                                                             T>A
  Prior alkylator                                                                                            T>C                                                             Glioblastomas, WT IDH1/2 (n = 894)
 Prior radiation                                                                                             T>G                                                             Other gliomas, WT IDH1/2 (n = 217)

Fig. 1 | TMB and mutational signature analysis reveals clinically distinct                   promoter methylation, histological grade, age at initial diagnosis, and prior
subgroups of hypermutated gliomas. a, Integrated analysis of the                             treatment. Red line denotes high TMB (≥17.0 mut. per Mb). b, Prevalence of
DFCI-Profile dataset (n = 1,628 gliomas) depicting TMB, indels at homopolymer                hypermutation in the DFCI-Profile dataset. Chi-squared test and two-sided
regions, and the single nucleotide variant (SNV) mutation spectrum in each                   Fisher’s exact test. NA, not available; TMZ, temozolomide; WT, wild-type; mut,
tumour according to molecular status of IDH1/2, 1p/19q co-deletion,                          mutant; codel, co-deleted.
chromosome 7 gain and/or chromosome 10 deletion (7gain/10del), MGMT

suggesting that these samples harboured underlying MMR defects that                          glioma models with temozolomide or the nitrosourea lomustine
could not be identified by sequencing (for example, promoter meth-                           (CCNU), a chloroethylating alkylating agent that generates DNA
ylation). We identified several MMR mutational hotspots (Extended                            interstrand crosslinks and double-strand breaks (Fig. 2c, Extended Data
Data Fig. 6f, Supplementary Table 4), including a recurrent MSH6                             Fig. 8g–i). All MMR-deficient models were resistant to temozolomide
mutation (p.T1219I, in 7.4% of hypermutated tumours) that has                                and sensitive to CCNU, consistent with the lack of hypermutation in
been previously identified in Lynch syndrome and shown to exert a                            samples from nitrosourea-treated patients24 (Extended Data Fig. 3f).
dominant-negative effect without affecting protein expression22,23
(Extended Data Fig. 6g, h).
   Immunohistochemistry on an independent cohort of 213 recurrent                            Mismatch repair deficiency and signature 11
post-alkylator gliomas further validated these findings (Supplementary                       Our analyses indicated that MMR deficiency together with temozo-
Table 2). MMR protein expression was lost in 22 post-treatment sam-                          lomide exposure might cause signature 11, as opposed to it being
ples, and this loss was associated with IDH1/2 mutations (20% mutant                         a ‘pure’ temozolomide signature. To test this idea, we exposed iso-
versus 2% wild-type; Fisher’s exact test, P = 8.0 × 10⁻⁶) (Extended Data                     genic models of MMR deficiency to temozolomide (Extended Data
Fig. 7a, b). Sequencing of samples with MMR protein loss confirmed                           Fig. 9a, b). After treatment with temozolomide, MMR-deficient PDCLs
hypermutation, with MMR mutations in 18 of 19 (94.7%) of these sam-                          developed hypermutation with signature 11, whereas MMR-proficient
ples. Subclonal loss of MMR proteins (that is, protein retained in more                      controls (expressing sgGFP) did not (Fig. 2d). We then chronically
than 20% of tumour cells) was more common in post-treatment than                             treated temozolomide-sensitive glioblastoma xenografts (PDXs) with
de novo hypermutated gliomas (12 of 46 (26.1%) versus 0 of 16 (0.0%),                        temozolomide until resistance was acquired (Fig. 2e, Extended Data
P = 0.03) (Extended Data Fig. 7c–f).                                                         Fig. 9c, d). These tumours developed hypermutation with signature
   We next assessed the relationship between MMR deficiency and                              11 (Fig. 2f, Extended Data Fig. 9e) and shared four unique variants;
acquired chemotherapy resistance. Because hypermutation and MMR                              the dominant-negative MSH6 hotspot mutation (p.T1219I) and three
defects were almost exclusively seen after temozolomide treatment,                           non-coding variants (Fig. 2g), consistent with the theory that the MSH6
we hypothesized that nitrosoureas and temozolomide might not show                            mutation drives both hypermutation and acquired temozolomide
complete cross-resistance. Analysis of temozolomide sensitivity in                           resistance (Extended Data Fig. 9f).
30 cell lines derived from patients with glioma (patient-derived cell                           Collectively, these findings show that temozolomide exerts a previ-
lines, PDCLs), including four derived from MMR-deficient gliomas                             ously underappreciated selective pressure in favour of MMR-deficient
(Extended Data Fig. 8a–c), showed that all native MMR-deficient PDCLs                        cells, which are resistant to temozolomide. Exposing MMR-deficient
had striking temozolomide resistance compared to MMR-proficient                              cells to temozolomide induces hypermutation with signature 11 by
PDCLs (6.46- and 1.35-fold increase in median area under the curve                           causing DNA damage in the absence of functional MMR. Therefore,
(AUC) versus MMR-proficient–MGMT-deficient and MMR-proficient–                               hypermutation with signature 11 represents a potential biomarker for
MGMT-proficient PDCLs, respectively) (Fig. 2b, Extended Data Fig. 8d–                        MMR deficiency and temozolomide resistance in gliomas (Extended
f). We next treated native and engineered isogenic MMR-knockout                              Data Fig. 9g).

                                                                                                                                                            Nature | Vol 580 | 23 April 2020 | 519
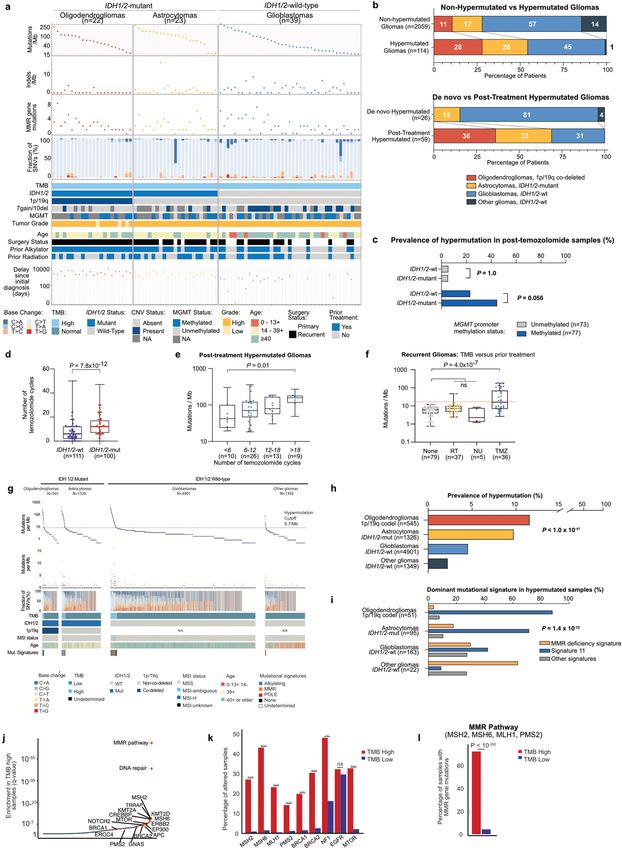
Mechanisms and therapeutic implications of hypermutation in gliomas
Article
       a                                                                                                                b                                                                                                    c
                                                                                                                                                            Patient-derived cell lines                                                       BT145 (TMZ-sensitive) MMR suppression
                                                                                                                                                                   (spheroids)
                                        10–15                                                                                                                                                                                                                                                             BT145 sgGFP
                                                                         MMR pathway                                                                                                                                         100                                 100

                                                                                                                      Viability (luminescence,
                                                                                                                                                 100                                                                                                                                                      BT145 sgMSH2
                                                                                                                                                                                                                                                                                                          BT145 sgMSH6
       Enrichment in TMBhigh

                                                                                                                           % of control)
                                                                                                                                                                                                                                                                                                          BT145 sgMLH1
         samples (q value)

                                        10–10                                                                                                                                                                                                                                                             BT145 sgPMS2
                                                                                                                                                  50                                                                          50                                    50
                                                                           MSH6
                                                                    BRCA1     DNA repair
                                                                     MTOR     BRCA2
                                        10–5                      CREBBP       MLH1
                                                                 NOTCH2       MSH2                                                                 0                                                                             0                                  0
                                                                    ERBB2    GNAS                                                                   10–10           10        100                                                 10–10          10    100    1,000 10–10           10     100    1,000
                                                             PMS2  EP300
                                                                        APC ERCC4                                                                             Temozolomide (μM)                                                             Temozolomide (μM)                       CCNU (μM)
                                            1
                                                                                                                                                 Non-hypermutated/MMR-proficient
                                                Mutations enriched in TMBhigh tumours                                                            (n = 26)
                                                     (increasing rank by q value)                                                                Hypermutated/MMR-deficient
                                                                                                                                                 (n = 4)

                                                                                            e                                                                                                    f                                                              g            BT145 PDX post-TMZ clonal evolution
            d                                                                                                                         Adult HGG PDX (BT145),
                                                                                                                                                                                                                                                                                    Resistant 2
                                                                                                                                      temozolomide-sensitive                                                                          Adult HGG PDX
                                                  Pediatric HGG PDCL                                                                                                                                                                     (BT145)
                                                       (DIPG13)                                                                                                                                                                      Chronic treatment                                             Resistant 1
                                                                                        Tumour volume (mm3)

                                                   Chronic treatment                                          1,000                                                                                                                                                          274 mutations
        No. of signature 11 mutations

                                                                                                                                                                                             No. of signature 11 mutations
                                                                                                                                                                                                                                                                              MLH1(A21T)
          (alkylating agent-related)

                                                                                                                                                                                                                                          cle
                                                                                                                                                                                               (alkylating agent-related)
                                                                                                                                                                                                                                                                             TMZ signature
                                                                                                                                                                                                                                                                                                       62 mutations

                                                                                                                                                                                                                                          hi

                                                                                                                                                                                                                                                 Z
                                                   Vehicle     TMZ

                                                                                                                                                                                                                                                TM
                                                                                                                                                                                                                                       Ve
                                                                                                               100                                                                                                                                                           MSH6(T1219I)             MSH6(G864E)
                                         200                                                                                                                                                                                 200                                                                      MSH6(G1134E)
                                                                                                                                                                                                                                                                         +3 noncoding variants
                                                                                                                                                                                                                                                                          (NF1, RAF1, RAC1)           TMZ signature
                                         100                                                                    10                                                                                                           100
                                                                                                                                                                                                                                                                                                          Vehicle
                                                                                                                  0              50                  100     150        200      250
                                           0                                                                                                                                                                                     0                                                                    TERT promoter
                                                                                                                                                    Time (days)
                                                                                                                                                                                                                                                                                                      mutation
                                         M 2 –/–
                                          on /–

                                         M 2 –/–

                                                                     –
                                             6 –/
                                         C H6 –

                                                                                                                                                                                                                                   st l
                                           SH l

                                           SH l

                                                                                                                                                                                                                                          1
                                                                                                                                                                                                                                         t2
                                                                                                                                                                                                                                        tro
                                         M tro

                                         M tro

                                                                                                                                                                                                                              Re ant
                                           SH

                                                                                                                                                                                                                                                                                                      PTEN mutation

                                                                                                                                                                                                                                      an
                                                                                                                                                                                                                                    on
                                          on

                                           S

                                                                                                                                                                                                                                   st
                                                                                                                                                 Temozolomide

                                                                                                                                                                                                                                 C
                                         C

                                                                                                                                                                                                                                                                                                      Chr 7 gain

                                                                                                                                                                                                                                       si

                                                                                                                                                                                                                                si
                                                                                                                                                                                                                                     Re
                                                                                                                                                 Vehicle                                                                                                                                              Chr 10 loss
                                                                                                                                                 New treatment cycle                                                             MSH6(T1219I)                                                         Chr 13 loss

Fig. 2 | MMR deficiency drives hypermutation and chemotherapy                                                                                                                            the vehicle-treated samples (too few variants). e, Tumour volume (n = 8 mice per
resistance in gliomas. a, Mutated genes and pathways enriched in                                                                                                                         group) during treatment with vehicle (blue) or temozolomide (red) in BT145
hypermutated gliomas in the merged DFCI-Profile/MSKCC-IMPACT dataset                                                                                                                     patient-derived xenografts (PDXs). f, Number of signature 11 variants found after
(n = 2,173) using a permutation test to control for random mutation rate in the                                                                                                          chronic temozolomide exposure in BT145 PDXs. Mutational signatures could not
setting of hypermutability. b, Response to temozolomide across a panel (n = 30)                                                                                                          be called in the vehicle-treated tumours (too few variants). g, Schematic
of native spheroid glioma PDCLs (blue, MMR-proficient; red, MMR-deficient).                                                                                                              representation of BT145 PDXs clonal evolution under temozolomide exposure.
Dose–response curves were calculated using mean surviving fractions from                                                                                                                 Two independent secondary resistant tumours (Resistant 1 and 2) and one
three independent assays. c, Response to temozolomide and CCNU in the                                                                                                                    vehicle-treated tumour are represented. Resistant tumours had four private
glioblastoma PDCL BT145 following knockout of MSH2, MSH6, MLH1 or PMS2 by                                                                                                                variants that were not detected in the vehicle-treated tumour: an MSH6(T1219I)
CRISPR–Cas9. Dose–response curves were calculated using mean surviving                                                                                                                   mutation (VAF 0.27 and 0.37 for resistant 1 and 2, respectively), and three
fractions from three independent assays (mean ± s.e.m.). d, Number of signature                                                                                                          non-coding variants of NF1 (VAF 1.0 and 0.99), RAC1 (VAF 0.86 and 0.86) and RAF1
11 variants after chronic temozolomide treatment of the PDCL DIPG13 with MSH2                                                                                                            (0.44 and 0.56). HGG, high-grade glioma; Chr, chromosome.
or MSH6 knockout by CRISPR–Cas9. Mutational signatures could not be called in

                                                                                                                                                                                         MMR deficiency and T-cell infiltration in gliomas (n = 43) and CRCs
Characteristics of MMR-deficient gliomas                                                                                                                                                 (n = 19). As expected, MMR-deficient CRCs exhibited significantly more
MMR deficiency recently emerged as an indicator of response to PD-1                                                                                                                      infiltrating T-cells than their MMR-proficient counterparts (Fig. 3b).
blockade in patients with cancer8,25, leading to the first tissue-agnostic                                                                                                               By contrast, both MMR-deficient and MMR-proficient glioma samples
cancer-drug approval by the US Food and Drug Administration for use                                                                                                                      lacked significant T-cell infiltrates (Fig. 3c).
of the PD-1 blocker pembrolizumab in patients with MMR-deficient                                                                                                                            We next assessed whether the neoantigen burden was lower in
cancers. However, in CRCs and some other cancers, MMR inactivation                                                                                                                       MMR-deficient gliomas than in other hypermutated cancers using
occurs early in tumour progression, whereas in post-treatment gliomas                                                                                                                    samples from the GENIE and TCGA datasets (n = 1,748 and 699 hypermu-
it arises late. Gliomas might therefore differ from other cancers on                                                                                                                     tated cancers, respectively). As neoantigen prediction was not feasible
which the approval was based and these differences might influence                                                                                                                       using panel sequencing data, we used the nonsynonymous mutational
immune recognition of tumours and the response to immunotherapy.                                                                                                                         burden as a surrogate measure. This showed that both de novo and
   To test this hypothesis, we first assessed the outcome of hypermu-                                                                                                                    post-treatment MMR-deficient gliomas had an increase in their nonsyn-
tated gliomas. In CRC, MMR deficiency is associated with improved                                                                                                                        onymous mutational burden, when compared to non-hypermutated
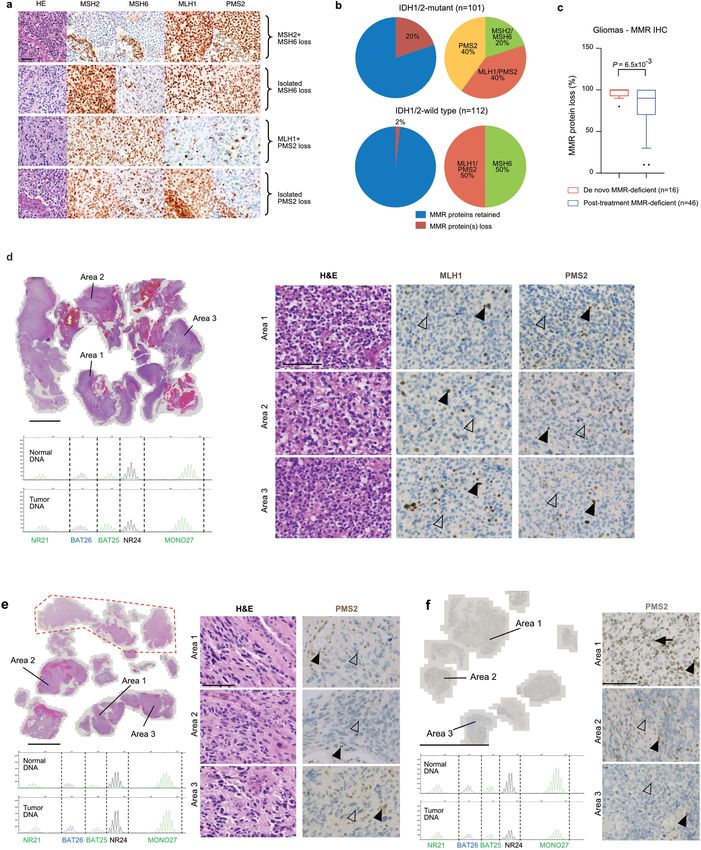
outcomes. By contrast, among patients with recurrent glioma, we                                                                                                                          gliomas, and the glioma nonsynonymous mutational burden was simi-
observed worse survival in both hypermutated high-grade 1p/19q                                                                                                                           lar to other hypermutated cancers (Fig. 3d, Extended Data Fig. 11a, b,
co-deleted oligodendrogliomas (median overall survival (OS)                                                                                                                              Supplementary Table 6). This finding suggested that the total number
96.5 months (95% confidence interval (CI) 20.8–NA (not applicable))                                                                                                                      of neoantigens is unlikely to explain the differences in immune response
versus 137.2 months (95% CI 41.8–NA) in non-hypermutated tumours,                                                                                                                        between gliomas and other hypermutated cancers.
P = 0.0009, two-sided log-rank test) and IDH1/2-mutant astrocytomas                                                                                                                         Recent data suggest that, among mutations associated with MMR
(median OS 15.7 months (95% CI 12.9–18.3) versus 21.5 months (95% CI                                                                                                                     deficiency, small insertions and deletions (indels) at homopolymers
19.2–29.8), P = 0.0015) (Fig. 3a, Extended Data Fig. 10a–c). We observed                                                                                                                 (microsatellites)—which accumulate in MMR-deficient cells and can
a similar trend in IDH1/2 wild-type glioblastomas (P = 0.0809). The find-                                                                                                                cause frameshift mutations—are crucial for producing ‘high-quality’
ing of poor survival in recurrent hypermutated gliomas remained sig-                                                                                                                     neoantigens that are recognized by immune cells26,28. Unexpectedly,
nificant in multivariable analysis (hazard ratio 2.16 (95% CI 1.38–3.38),                                                                                                                although the high TMB was associated with an increased homopolymer
P = 0.0008; Supplementary Table 5).                                                                                                                                                      indel burden in MMR-deficient CRCs, this association was not found in
   The current hypothesis behind the response of MMR-deficient CRCs                                                                                                                      MMR-deficient gliomas (de novo hypermutated gliomas showed a mod-
to PD-1 blockade is based on their increased neoantigen burden and                                                                                                                       est increase; Fig. 3d, Extended Data Fig. 11c). This was validated using
immune infiltration. We therefore assessed the association between                                                                                                                       testing for microsatellite instability (MSI), a clinical biomarker for MMR

520 | Nature | Vol 580 | 23 April 2020
Mechanisms and therapeutic implications of hypermutation in gliomas
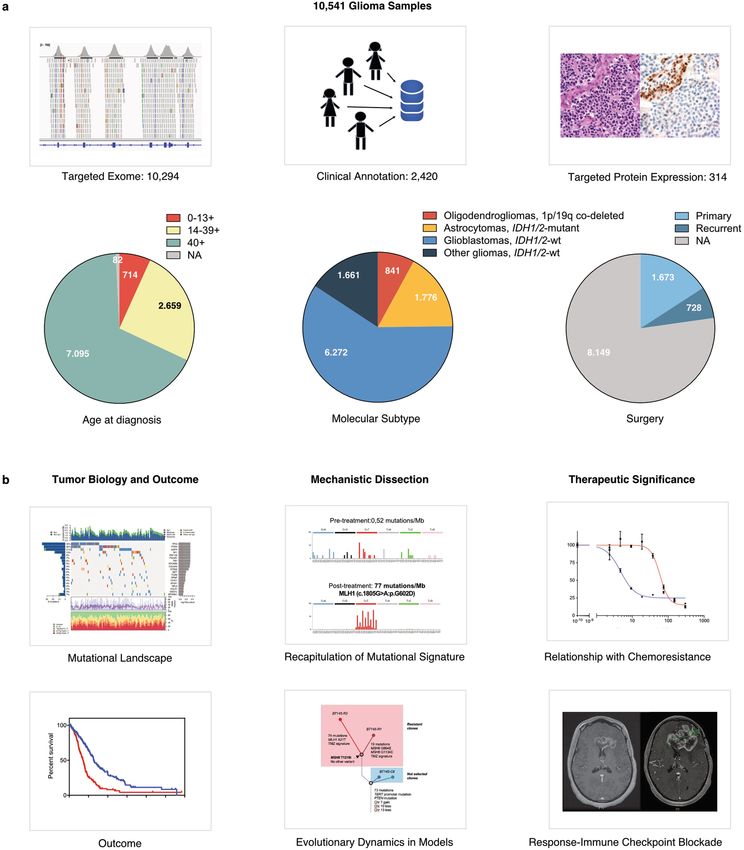
a                                                                                                 b                              CRCs (n = 19)                                                                                                                                                                               d                                               GENIE pan-cancer (n = 44,389)

                                                                                                                                                                                                                                                     CD3+ cells per mm2 (tumour-infiltrating)
                                                Recurrent high-grade gliomas                                               MMR-proficient            MMR-deficient                                                                                                                                                                                                               Gliomas highest
                                     Survival from recurrence according to TMB status                                                                                                                                                                                                           1×   105
100                                                                                                                                                                                                                                                                                                                                                                                          P = 2.6 × 10⁻¹⁴

                                                                                                        CD3, 100×
                                                                                                                                                                                                                                                                                                                   P = 0.018                                                                 P = 2.2 × 10⁻⁵
                                                                                                                                                                                                                                                                                                1 × 10⁴                                                              600                     P = 0.0058
        80                                                                                                                                                                                                                                                                                                                                                                               P = 0.85
                                                                                                                                                                                                                                                                                                                                                                                     P = 1.0

                                                                                                                                                                                                                                                                                                                                   Mutations per Mb
                                                                             P = 0.0009                                                                                                                                                                                                         1 × 10³
                                                                                                                                                                                                                                                                                                                                                                     400
        60
                                                                                                                                                                                                                                                                                                1 × 10²
                                                                                                                                                                                                                                                                                                                                                                     200

                                                                                                        CD3, 200×
        40
                                                                                                                                                                                                                                                                                                          1

                                                                                                                                                                                                                                                                                                     M n = ent
                                                                             P = 0.0015

                                                                                                                                                                                                                                                                                                            10 t
                                                                                                                                                                                                                                                                                                          = en
                                                                                                                                                                                                                                                                                                               )
                                                                                                                                                                                                                                                                                                         de )
                                                                                                                                                                                                                                                                                                      R- 9
                                                                                                                                                                                                                                                                                                         ( ci

                                                                                                                                                                                                                                                                                                       (n fici
        20                                                                                                                                                                                                                                                                                                                                                                  0

                                                                                                                                                                                                                                                                                                          ofi
                                                                                                                                                                                                                                                                                                        pr
                                                                                                                                                                                                                                                                                                      R-
                                                                        P = 0.0809

                                                                                                                                                                                                                                                                                                    M

                                                                                                                                                                                                                                                                                                               M
                                                                                                                                                                                                                                                                                                                                                                                                                                      Other MMR-deficient highest

                                                                                                                                                                                                                                                                                                M
                      0
                                                                                                        c                             Gliomas (n = 43)

                                                                                                                                                                                                                          CD3+ cells per mm2 (max. infiltrated area)
                                 0                12              24              36               48                      MMR-proficient              MMR-deficient                                                                                                                                                  P = 0.78
                                                                                                                                                                                                                                                                                                                                                                                                   P = 0.0033

                                                                                                                                                                                                                                                                                                                                                Homopolymer indels per Mb
                                                          Months to death                                                                                                                                                                                                                                                                                                   60              P = 9.4 × 10–37
                                                                                                                                                                                                                                                                           1 × 10⁵                                 P = 0.80
                                                                                                                                                                                                                                                                                                                                                                                         P = 1.5 × 10⁻¹⁷
                                                                              Median PFS (95% CI),

                                                                                                        CD3, 20×
                               No. at risk:                                                                                                                                                                                                                                                                                                                                            P = 6.1 × 10⁻⁷
                                                                                     months                                                                                                                                                                                1 × 10⁴                                                                                          40    P = 1.4 × 10⁻⁷
                               Oligo. codel, TMBlow                            137.2 (41.8–NA)
                                            25        13                11        6           5
                               Oligo. codel, TMBhigh                           96.5 (20.8–NA)                                                                                                                                                                              1×                       103
                                             24       17                12        8           7                                                                                                                                                                                                                                                                             20
                               Astro. mut. IDH1/2,TMBlow                       21.5 (19.2–29.8)
                                                                                                                                                                                                                                                                           1 × 10²
                                             72       41                16         10          8
                               Astro. mut. IDH1/2, TMBhigh                      15.7 (12.9–18.3)
                                                                                                        CD3, 200×

                                                                                                                                                                                                                                                                                                                                                                            0
                                             24       12                 3          3          3                                                                                                                                                                                                     1
                                                                                                                                                                                                                                                                                                                                                                                                           t              ,         ,           ,
                               GBM WT IDH1/2, TMBlow                            13.3 (11.0–15.4)                                                                                                                                                                                                                                                                                  vo 4)                  en 6)          er t      er gh       er low

                                                                                                                                                                                                                                                                                                                         = t,
                                                                                                                                                                                                                                                                                                                                                                                                                     nc ien 5) nc hi 3) nc B 1)

                                                                                                                                                                                                                                                                                                            de R = 1 nt

                                                                                                                                                                                                                                                                                                            ea R = t,
                                                                                                                                                                                                                                                                                                                                                                               no 2

                                                                                                                                                                                                                                                                                                                            )
                                                                                                                                                                                                                                                                                                                                                                                                      m 7

                                                                                                                                                                                                                                                                                                                       n n
                                                                                                                                                                                                                                                                                                                          18
                                                                                                                                                                                                                                                                                                         -tr M (n n
                                                                                                                                                                                                                                                                                                                                                                                                    at n =

                                                                                                                                                                                                                                                                                                              tm -d 7)
                                                                                                                                                                                                                                                                                                             M (n ficie

                                                                                                                                                                                                                                                                                                                    t ( cie
                                                                                                                                                                                                                                                                                                                                                                                                                   ca fic 53 -ca MB ,11 -ca TM ,64

                                                                                                                                                                                                                                                                                                               no -de 8)
                                                                                                                                                                                                                                                                                                                                                                            e n=

                                                                                                                                                                                                                                                                                                       st M vo ficie
                                            162       56                15          5          3                                                                                                                                                                                                                                                                                                  e              -
                                                                                                                                                                                                                                                                                                                                                                          d     (               r      (

                                                                                                                                                                                                                                                                                                                 en efi
                                                                                                                                                                                                                                                                                                                                                                        ,                    -t                n d = e        n T    1  n      42

                                                                                                                                                                                                                                                                                                                       o
                               GBM WT IDH1/2, TMBhigh                           9.4 (6.1–17.8)
                                                                                                                                                                                                                                                                                                                                                                     as                   st                 Pa R- (n Pa er (n = Pa

                                                                                                                                                                                                                                                                                                                    pr
                                                                                                                                                                                                                                                                                                                                                                                                                                             =

                                                                                                                                                                                                                                                                                                                 R-
                                             26       9                  1          0          0
                                                                                                                                                                                                                                                                                                                                                               lio
                                                                                                                                                                                                                                                                                                                                                                   m                   po                      M               th         (n

                                                                                                                                                                                                                                                                                                               M
                                                                                                                                                                                                                                                                                                M
                                                                                                                                                                                                                                                                                                                                                                                     ,                       M               o
                                                                                                                                                                                                                                                                                                                                                                                  as

                                                                                                                                                                                                                                                                                            M
                                                                                                                                                                                                                                                                                                                                                             G
                                                                                                                                                                                                                                                                                                                                                                                m
                                                                                                                                                                                                                                                                                                                                                                            lio
                                                                                                                                                                                                                                                                                                                                                                          G

                                                                                                                                                                                                                                                                                                    po
      e                                    Pan-cancer exomes (n = 799)                     f                                  scWGS workflow                               g                                                                                                                        Pre/post-treatment hypermutated                                                  h                                                    Pre/post-treatment hypermutated

                                                                                                                                                                                                                                                                                                                                                                                        Rate of microsatellite mutations per genome
                                                                                                                                                                            Estimated C>T (NCC/NCT contexts) per genome
                                                       P = 7.1 × 10⁻⁴                                                                                                                                                                                                                                    glioma single-cell SNVs                                                                                                               glioma single-cell MSI
                                                                                                                    Sample preparation                 Sequencing
                               1.2             P = 2.6 × 10⁻⁷                                                                                                                                                                                                                                                                                                                                                                         4 × 10⁴     Primary, non-hypermut. (n = 4)
                                                                                                                                                                                                                            2 × 10⁵                                                                           Primary (n = 35)
                                                                                                   Frozen                                                                                                                                                                                                                                                                                                                                         Recurrent, non-hypermut. (n = 1)
Average cancer cell fraction

                                         P = 4.4 × 10⁻⁶                                            tumour                                                                                                                                                                                                     Recurrent, non-hypermutated (n = 15)
                                                                                                                                                                                                                                                                                                                                                                                                                                                  Recurrent, hypermut. (n = 3)
                                                                                                                                                                                                                                                                                                              Recurrent, hypermutated (n = 13)
                                                                                                                                            WGA+ QC   WGS~1–10×                                                                                                                                                                                                                                                                       3 × 10⁴
                                                                                                                                                                                                                      1.5 × 10⁵
                               0.8                                                                                           Cell
                                                                                                                    FACS    debris       Single                 Single
                                                                                                  Single                                 nuclei                nucl. seq
                                                                                               cells/nuclei
                                                                                                                            Intact                                                                                          1 × 10⁵                                                                                                                                                                                                   2 × 10⁴
                                                                                                                            nuclei
                               0.4                                                                                                       Pool of                  Bulk
                                                                                                                                         nuclei                tumour seq
                                                                                                                                                                                                                            5 × 10⁴                                                                                                                                                                                                   1 × 10⁴
                                                                                                                                               Standard bulk
                                                                                                                                      Matching     WGS          Germline
                                0                                                                                                      blood                    DNA seq                                                                                                                         0                                                                                                                                          0
                                       Gliomas,       MMR        Other HM      Non-HM                                                                                                                                                                                                                          Single cells,              Single cells,                                                                                          Single cells,   Single cells,
                                     post-treatment (n = 276)    (n = 408)     (n = 100)                                                                                                                                                                                                                      primary tumour            recurrent tumour                                                                                        primary tumour    recurrent
                                        (n = 15)                                                                                                                                                                                                                                                                                                                                                                                                                   tumour

Fig. 3 | Hypermutated and MMR-deficient gliomas harbour unique                                                                                                  (bottom) in hypermutated gliomas compared with other hypermutated
phenotypic and molecular characteristics including poor outcome and                                                                                             cancers from the GENIE dataset. Tukey’s boxplots are shown. Two-sided
lack of MSI in bulk sequencing. a, Survival of patients with recurrent                                                                                          Wilcoxon rank-sum test with Bonferroni correction. e, Pan-cancer analysis of
high-grade glioma from the time of sample collection according to                                                                                               cancer cell fractions in hypermutated gliomas (post-treatment) compared with
histomolecular group and TMB status (n = 333 recurrent samples; 238                                                                                             other hypermutated cancers from the TCGA and ref. 4 exome datasets (n = 798).
from DFCI-Profile, 95 from MSKCC-IMPACT). Two-sided log-rank test.                                                                                              One hundred non-hypermutated samples from the TCGA were randomly
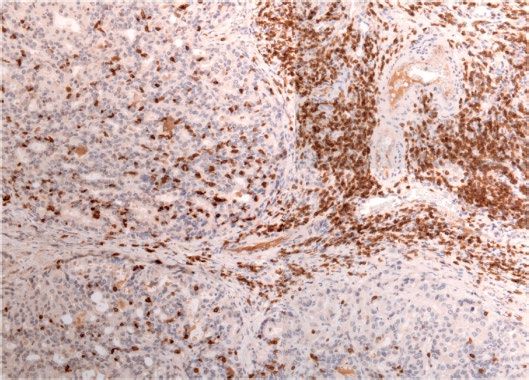
b, Quantification of tumour-infiltrating CD3-positive T-cells in CRC samples                                                                                    selected as controls. Boxes, quartiles; centre lines, median ratio for each
(n = 19). Left, representative low- and high-magnification images of CD3                                                                                        group; whiskers, absolute range excluding outliers. Two-sided Wilcoxon
immunolabelling (brown; intraepithelial lymphocytes, black arrowheads;                                                                                          rank-sum test with Bonferroni correction. f, Workflow for scWGS and bulk
stromal lymphocytes, black arrows) and nuclear counterstaining (blue).                                                                                          tumour DNA sequencing. g, Single-cell sequencing estimate of the number of
Dashed lines, border between tumour and stroma. Only intraepithelial                                                                                            G:C>A:T transitions at NCC and NCT trinucleotide contexts in 63 cells from a
lymphocytes were quantified. Scale bars; 100 µm (100×), 50 µm (200×).                                                                                           glioblastoma patient with post-temozolomide hypermutation using 1× scWGS
Right: boxes, quartiles; centre lines, median ratio for each group; whiskers,                                                                                   sequencing. Error bars show 95% CI. The absolute computed purity was 0.66
absolute range. Two-sided Wilcoxon rank-sum test. c, Quantification of                                                                                          for the primary tumour sample and 0.47 for the recurrent tumour sample in the
tumour-infiltrating CD3-positive T-cells in gliomas according to their MMR                                                                                      bulk sequencing. h, Single-cell sequencing estimate of microsatellite mutation
status (n = 43). For each group, three areas with the maximal CD3 infiltration                                                                                  rate in eight cells from a patient with glioblastoma with post-temozolomide
were selected for quantification (representative images, left). Scale bars:                                                                                     hypermutation. Eight cells were analysed for the presence of MSI using
500 µm (20×), 50 µm (200×). Right: boxes, quartiles; centre lines, median ratio                                                                                 10× scWGS sequencing. WGA, whole genome amplification; QC, quality
for each group; whiskers, absolute range. Kruskal–Wallis test and Dunn’s                                                                                        control; nucl, nuclei; seq, sequencing.
multiple comparison test. d, TMB (top) and homopolymer indel burden

deficiency. Whereas MSI was identified in all MMR-deficient CRCs, all                                                                                           mutation, and compared these to 35 non-hypermutated cells from
tested gliomas with MMR protein loss (n = 15) were microsatellite-stable                                                                                        the matched pre-treatment sample (Fig. 3f, Extended Data Fig. 11i–k).
(MSS) (Extended Data Figs. 7d–f, 11d).                                                                                                                          In the post-temozolomide sample, 13 of 28 cells (46.4%) were hyper-
  We hypothesized that, in hypermutated gliomas, more of the                                                                                                    mutated with signature 11 (Fig. 3g, Extended Data Fig. 11l). Strikingly,
homopolymer indels are subclonal and below the detection limits                                                                                                 whereas this tumour harboured only a minor increase in its homopoly-
of bulk sequencing, relative to other MMR-deficient cancers. Indeed,                                                                                            mer indel burden at the bulk level (0.49 versus 0.0 per Mb), the scWGS
analysis of CCFs indicated that hypermutated gliomas contained a                                                                                                analysis showed a ninefold increase in microsatellite mutations in all
greater burden of subclonal variants than did other hypermutated                                                                                                hypermutated cells (Fig. 3h). This suggested that glioma cells with
cancers (Fig. 3e, Extended Data Fig. 11e–h). We therefore performed                                                                                             an MSH6(T1219I) variant harbour a subtle MSI phenotype that is not
single-cell whole-genome DNA sequencing (scWGS) of 28 cells from a                                                                                              revealed by standard bulk sequencing or clinical MSI assays (Extended
hypermutated, post-temozolomide glioblastoma with an MSH6(T1219I)                                                                                               Data Fig. 11m).

                                                                                                                                                                                                                                                                                                                                       Nature | Vol 580 | 23 April 2020 | 521
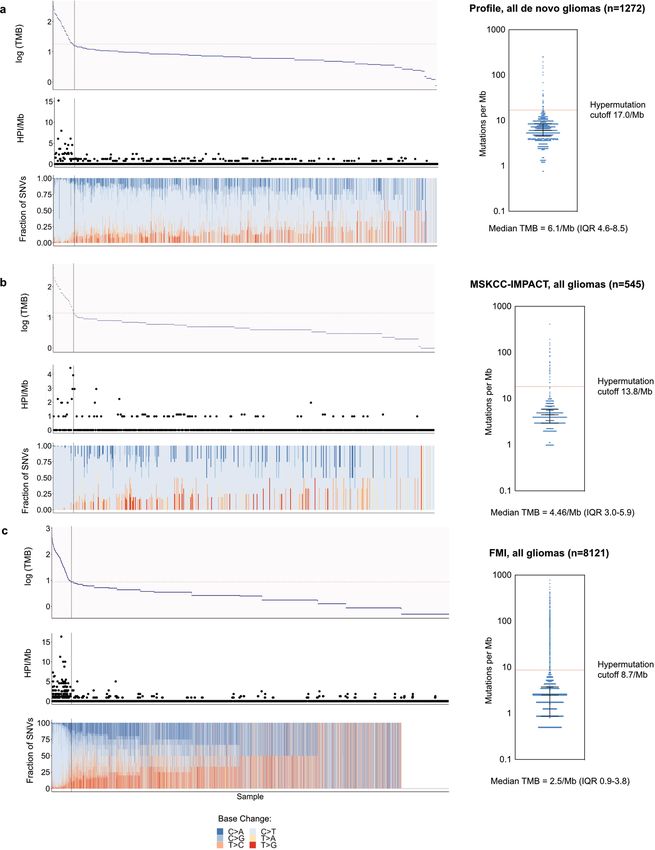
Mechanisms and therapeutic implications of hypermutation in gliomas
Article
               a                                             500             Best response                         c

               response from baseline (%)
                                                                                                                                                                  Diagnosis and treatment                            Relapse

                 RANO best radiological
                                                             200                                                         Colorectal cancer
                                                                                                  PD1 blockade
                                                                                                  PD1 blockade +
                                                                                                  bevacizumab          Normal      MMR-deficient            MMR-deficient
                                                             100                                                        cell          cell                  CRC, TMBhigh       x                                                 High tumour mutational burden
                                                                                                                                                                                                                                 High mutational burden per cell
                                                                                                                                                                                        x
                                                               0                                         +25%                                                                                                                          Clonal neoantigens
                                                                                                                                                                                   x
                                                                                                                                    Accumulation of clonal mutations                                                                Immunogenic responses
                                                                                                         –50%
                                                       –100
                                                                                                                                                                             Subclonal mutations
               b                                             100
                                                                             Overall survival
                                  Survival probability (%)

                                                                                                                                                                                        TMZ pressure
                                                                                                                          Glioma
                                                              80                                                                                                                                                         Post-treatment MMR-deficient
                                                                                       P = 0.17
                                                                                                                       Normal      MMR-proficient           MMR-proficient
                                                                                                                                                                                       Cx                                         glioma,TMBhigh
                                                              60
                                                                                                                        cell          cell                  glioma, TMBlow                                       x
                                                                                                                                                                                                                 x
                                                                                                                                                                                                         x
                                                              40                    TMBlow
                                                                                                                                                                         x
                                                                                                                                                                                       A x       x           x
                                                                                                                                                                                                     x
                                                                                                                                                                                                             x
                                                                                                                                                                                                                     x          High tumour mutational burden
                                                              20       TMBhigh                                                                                                                   x
                                                                                                                                                                                                                     x         Moderate mutational burden per cell
                                                                                                                                          Low mutational burden                        Bx    x    x x
                                                                                                                                                                                                                                    Few clonal neoantigens
                                                               0                                                                                                                                 x
                                                                                                                                                                                                                                  No immunogenic responses
                                                                   0    6     12   18 24        30   36                                                                                      Subclonal
                                                                             Months to death                                                                                                 mutations
                                                             No. at risk          Median OS (95% CI), months
                                                             TMBhigh                   8.07 (2.79–15.08)                                                                      Selection of TMZ-
                                                                 11      6     3    0     0      0    0                                                                       resistant clones:
                                                                                                                                                                              A, B: MMR-deficient
                                                             TMBlow                    9.96 (7.56–15.08)                                                                      C: MMR-proficient
                                                                 10      8     4    2     2      1    1                    Time

Fig. 4 | Treatment of hypermutated gliomas with PD-1 blockade. a, b, Best                                                                             strong immune infiltrates are seen at diagnosis. Treatment with anti-PD-1 results
radiological response (a, measured as the best change in the sum of the products                                                                      in expansion of T cells that recognize these clonal neoantigens and substantial
of perpendicular diameters of target lesions), and overall survival (b) of 11                                                                         antitumour responses. In gliomas (bottom), few mutations are acquired early
patients with hypermutated and MMR-deficient gliomas who were treated with                                                                            during tumorigenesis in the majority of tumours. Temozolomide drives the
PD-1 blockade. A cohort of patients with non-hypermutated gliomas who were                                                                            expansion of cells with MMR deficiency and late accumulation of random
treated with PD-1 blockade is depicted as control (n = 10, best matches according                                                                     temozolomide-induced mutations. Ineffective antitumour responses may result
to diagnosis, primary versus recurrent status, and prior treatments). Two-sided                                                                       from poor neoantigen quality (high burden of missense mutations versus
log-rank test. c, Proposed model explaining differential response to PD-1                                                                             frameshift-producing indels) and high subclonality associated with an
blockade in MMR-deficient CRCs and gliomas. In CRCs (top), MMR deficiency is                                                                          immunosuppressive microenvironment. In some tumours, MMR-proficient
acquired early in pre-cancerous cells, creating mutations and indels at                                                                               subclones that have acquired therapy resistance through other pathways can
homopolymer regions. Over time, clonal neoantigens of both types emerge and                                                                           co-exist with MMR-deficient subclones, giving rise to a mixed phenotype.

PD-1 blockade in MMR-deficient gliomas                                                                                                                response to immunotherapy (Fig. 4c) and may explain the lack of both
As hypermutation in gliomas that acquire MMR deficiency tends to be                                                                                   recognition of MMR-deficient glioma cells by the host immune system
subclonal and does not generate optimal antitumour T-cell responses,                                                                                  and response to PD-1 blockade, compared to other MMR-deficient
we hypothesized that these tumours might not have high response                                                                                       cancers8,25. A key difference is that MMR-deficient gliomas lack detect-
rates to PD-1 blockade. We performed a retrospective institutional                                                                                    able MSI by standard assays, similar to data from patients with consti-
review of patients treated with PD-1 pathway blockade for which the                                                                                   tutional MMR deficiency syndromes30. Our scWGS analyses suggest
TMB at treatment initiation was available (n = 210). This identified 11                                                                               that this discordance might be due to intratumour heterogeneity and
patients with MMR-deficient glioma (5 de novo, 6 post-treatment) who                                                                                  a lack of sufficient evolutionary time to select clonal MSI populations.
were treated with PD-1 blockade for a median of 42 days (range 13–145;                                                                                Mechanistically, selective pressure exerted by temozolomide drives
Supplementary Table 7). Nine (81.8%) had disease progression as their                                                                                 the late evolution of MMR-deficient subclones, which further accumu-
best response (Fig. 4a), and the median progression-free survival (PFS)                                                                               late temozolomide-induced mutations in individual cells. In line with
and OS were 1.38 months (95% CI 0.95–2.69) and 8.7 months (95% CI                                                                                     previous data, therapy-induced single nucleotide variant mutations
2.79–15.08), which were not significantly different from the data for                                                                                 might not elicit effective antitumour responses, possibly because of
matched patients with non-hypermutated glioma (PFS 1.87 months                                                                                        the quality (missense mutations versus frameshift-producing indels) or
(95% CI 1.28–2.92), OS 9.96 months (95% CI 7.56–15.08); Fig. 4b, Extended                                                                             subclonal nature of their associated neoantigens8,27–29. However, future
Data Fig. 10d).                                                                                                                                       evaluation of longer treatment exposure or combinatorial strategies is
  Because our prior analyses indicated that patients with hypermu-                                                                                    warranted to determine whether checkpoint blockade can be effective
tated gliomas might have reduced survival, we used a second set of                                                                                    in this or other selected populations (for example, individuals with
historical controls to compare the outcome of hypermutated glio-                                                                                      newly diagnosed MMR- or POLE-deficient gliomas)6.
mas treated with PD-1 blockade versus other systemic agents (Supple-                                                                                     We have presented evidence that recurrent defects in the MMR path-
mentary Table 7). Unexpectedly, we observed a longer median OS for                                                                                    way drive hypermutation and acquired temozolomide resistance in
patients treated with other systemic agents when compared to those                                                                                    chemotherapy-sensitive gliomas. Although it is difficult to determine
treated with PD-1 blockade (16.10 months (95% CI 3.98–22.21) versus                                                                                   the origin of MMR deficiency by sequence context alone in individual
8.07 (95% CI 2.79–15.08.21); P = 0.02, two-sided log-rank test; Extended                                                                              post-treatment samples, our data suggests that some MMR variants
Data Fig. 10e, f, Supplementary Table 8). In one patient with hypermu-                                                                                are likely to be caused by temozolomide. However, as acquired MMR
tated glioma that showed rapid imaging changes, histopathologic                                                                                       deficiency occurs in the most temozolomide-sensitive tumours, it is
analysis of samples taken before and after treatment with PD-1 blockade                                                                               not clear whether the acquired MMR deficiency outweighs the positive
showed highly proliferative tumour in both samples, with no significant                                                                               effects of temozolomide in gliomas. Our finding that MMR-deficient
evidence of pathologic response or increase in immune infiltrates after                                                                               cells retain sensitivity to CCNU supports the hypothesis that hyper-
PD-1 blockade (Extended Data Fig. 10g).                                                                                                               mutation reduces cellular fitness and tolerance to DNA-damaging
                                                                                                                                                      agents other than temozolomide. These alternatives are of interest in
                                                                                                                                                      light of recent evidence showing that the addition of CCNU to chemo-
DISCUSSION                                                                                                                                            radiation improves the outcome of patients with MGMT-methylated
Collectively, these results support a model in which differences in                                                                                   glioblastomas31. Future studies are warranted to address the possi-
the mutation landscape and antigen clonality of hypermutated gli-                                                                                     bility that upfront temozolomide with CCNU may attenuate the pro-
omas relative to other hypermutated cancers markedly affect the                                                                                       cess of post-treatment hypermutation. Furthermore, mechanisms of

522 | Nature | Vol 580 | 23 April 2020
Mechanisms and therapeutic implications of hypermutation in gliomas
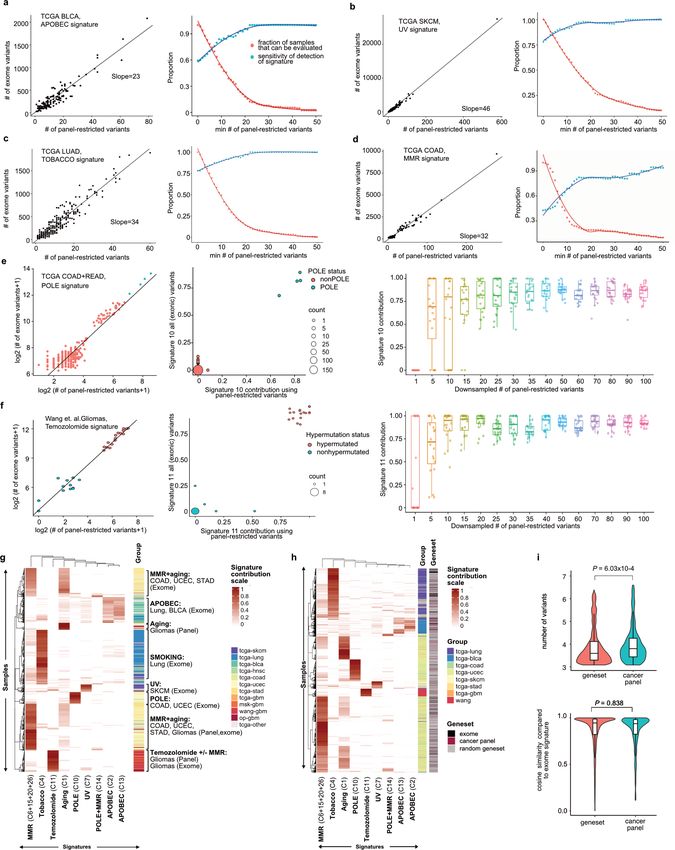
resistance to temozolomide that are not associated with hypermutation                               25.   Marabelle, A. et al. Efficacy of pembrolizumab in patients with noncolorectal high
                                                                                                          microsatellite instability/mismatch repair-deficient cancer: results from the phase II
will need to be addressed.                                                                                KEYNOTE-158 study. J. Clin. Oncol. 38, 1–10 (2020).
   Finally, our data indicate that the absence of an immune response in                             26.   Germano, G. et al. Inactivation of DNA repair triggers neoantigen generation and impairs
gliomas is likely to result from several aspects of immunosuppression                                     tumour growth. Nature 552, 116–120 (2017).
                                                                                                    27.   Mandal, R. et al. Genetic diversity of tumors with mismatch repair deficiency influences
in the brain that require further characterization. Approaches that                                       anti-PD-1 immunotherapy response. Science 364, 485–491 (2019).
increase infiltration by cytotoxic lymphocytes into the glioma micro-                               28.   Rosenthal, R. et al. Neoantigen-directed immune escape in lung cancer
environment will probably be required to improve immunotherapy                                            evolution. Nature 567, 479–485 (2019).
                                                                                                    29.   Gejman, R. S. et al. Rejection of immunogenic tumor clones is limited by clonal fraction.
response. Our data also suggest a change in practice whereby repeated                                     eLife 7, e41090 (2018).
biopsies and sequencing to identify progression and hypermutation                                   30.   Gylling, A. H. et al. Differential cancer predisposition in Lynch syndrome: insights from
could inform prognosis and guide therapeutic management.                                                  molecular analysis of brain and urinary tract tumors. Carcinogenesis 29, 1351–1359
                                                                                                          (2008).
                                                                                                    31.   Herrlinger, U. et al. Lomustine-temozolomide combination therapy versus standard
                                                                                                          temozolomide therapy in patients with newly diagnosed glioblastoma with methylated
Online content                                                                                            MGMT promoter (CeTeG/NOA-09): a randomised, open-label, phase 3 trial. Lancet 393,
                                                                                                          678–688 (2019).
Any methods, additional references, Nature Research reporting sum-
maries, source data, extended data, supplementary information,                                      Publisher’s note Springer Nature remains neutral with regard to jurisdictional claims in
acknowledgements, peer review information; details of author con-                                   published maps and institutional affiliations.

tributions and competing interests; and statements of data and code                                 © The Author(s), under exclusive licence to Springer Nature Limited 2020
availability are available at https://doi.org/10.1038/s41586-020-2209-9.
                                                                                                    Department of Oncologic Pathology, Dana-Farber Cancer Institute, Harvard Medical School,
                                                                                                    1

                                                                                                    Boston, MA, USA. 2Broad Institute of Harvard and MIT, Cambridge, MA, USA. 3Sorbonne
1.  Hunter, C. et al. A hypermutation phenotype and somatic MSH6 mutations in recurrent
                                                                                                    Université, Inserm, CNRS, UMR S 1127, Institut du Cerveau et de la Moelle épinière, ICM, AP-HP,
    human malignant gliomas after alkylator chemotherapy. Cancer Res. 66, 3987–3991
    (2006).                                                                                         Hôpitaux Universitaires La Pitié Salpêtrière - Charles Foix, Service de Neurologie 2-Mazarin,
2.  Cancer Genome Atlas Research Network. Comprehensive genomic characterization                    Paris, France. 4Department of Medical Oncology, Dana-Farber Cancer Institute, Harvard
    defines human glioblastoma genes and core pathways. Nature 455, 1061–1068 (2008).               Medical School, Boston, MA, USA. 5Dana-Farber/Boston Children’s Cancer and Blood
3.  Johnson, B. E. et al. Mutational analysis reveals the origin and therapy-driven evolution of    Disorders Center, Boston, MA, USA. 6Department of Pathology, Brigham & Women’s Hospital,
    recurrent glioma. Science 343, 189–193 (2014).                                                  Boston, Harvard Medical School, MA, USA. 7Department of Biomedical Informatics, Harvard
4. Wang, J. et al. Clonal evolution of glioblastoma under therapy. Nat. Genet. 48, 768–776          Medical School, Boston, MA, USA. 8Bioinformatics and Integrative Genomics PhD Program,
    (2016).
                                                                                                    Harvard Medical School, Boston, MA, USA. 9European Molecular Biology Laboratory,
5.  Barthel, F. P. et al. Longitudinal molecular trajectories of diffuse glioma in adults. Nature
                                                                                                    European Bioinformatics Institute, Wellcome Genome Campus, Hinxton, UK. 10Department of
    576, 112–120 (2019).
6.  Bouffet, E. et al. Immune checkpoint inhibition for hypermutant glioblastoma multiforme         Neurology, Brigham and Women’s Hospital, Harvard Medical School, Boston, MA, USA.
    resulting from germline biallelic mismatch repair deficiency. J. Clin. Oncol. 34, 2206–2211
                                                                                                    11
                                                                                                      Foundation Medicine Inc., Cambridge, MA, USA. 12Wake Forest Comprehensive Cancer
    (2016).                                                                                         Center and Department of Pathology, Wake Forest School of Medicine, Winston-Salem, NC,
7.  Rizvi, N. A. et al. Mutational landscape determines sensitivity to PD-1 blockade in             USA. 13Center for Patient Derived Models, Dana-Farber Cancer Institute, Boston, MA, USA.
    non-small cell lung cancer. Science 348, 124–128 (2015).                                        14
                                                                                                       Drug Development Department (DITEP), INSERM U1015, Université Paris Saclay, Gustave
8.  Le, D. T. et al. PD-1 blockade in tumors with mismatch-repair deficiency. N. Engl. J. Med.      Roussy, Villejuif, France. 15Sorbonne Université, Inserm, CNRS, UMR S 1127, Institut du Cerveau
    372, 2509–2520 (2015).                                                                          et de la Moelle épinière, ICM, Paris, France. 16Unité fonctionnelle d’Oncogénétique et
9.  McGranahan, N. et al. Clonal neoantigens elicit T cell immunoreactivity and sensitivity to
                                                                                                    Angiogénétique Moléculaire, Département de génétique, Hôpitaux Universitaires La Pitié
    immune checkpoint blockade. Science 351, 1463–1469 (2016).
                                                                                                    Salpêtrière - Charles Foix, Paris, France. 17Department of Diagnostic Radiology, Gustave
10. Brennan, C. W. et al. The somatic genomic landscape of glioblastoma. Cell 155, 462–477
    (2013).                                                                                         Roussy, Villejuif, France. 18IR4M (UMR8081), Université Paris-Sud, Centre National de la
11. Brat, D. J. et al. Comprehensive, integrative genomic analysis of diffuse lower-grade           Recherche Scientifique, Orsay, France. 19AP-HP, Université Paris Descartes, Hôpital Cochin,
    gliomas. N. Engl. J. Med. 372, 2481–2498 (2015).                                                Service d’Anatomie et Cytologie Pathologiques, Paris, France. 20Sorbonne Université, Inserm,
12. Louis, D. N. et al. World Health Organization Histological Classification of Tumours of the     CNRS, UMR S 1127, Institut du Cerveau et de la Moelle épinière, ICM, AP-HP, Hôpitaux
    Central Nervous System (ed. 2) (International Agency for Research on Cancer, 2016).             Universitaires La Pitié Salpêtrière - Charles Foix, Service de Neuropathologie Laboratoire
13. Cahill, D. P. et al. Loss of the mismatch repair protein MSH6 in human glioblastomas is         Escourolle, Paris, France. 21Sorbonne Université, Inserm, CNRS, UMR S 1127, Institut du
    associated with tumor progression during temozolomide treatment. Clin. Cancer Res. 13,
                                                                                                    Cerveau et de la Moelle épinière, ICM, AP-HP, Hôpitaux Universitaires La Pitié Salpêtrière -
    2038–2045 (2007).
                                                                                                    Charles Foix, Service de Neurochirurgie, Paris, France. 22Department of Population and
14. Alexandrov, L. B. et al. Signatures of mutational processes in human cancer. Nature 500,
    415–421 (2013).                                                                                 Quantitative Health Sciences, Case Western Reserve University School of Medicine,
15. Frampton, G. M. et al. Development and validation of a clinical cancer genomic profiling        Cleveland, OH, USA. 23Department of Radiation Oncology, Arthur G. James Hospital/Ohio
    test based on massively parallel DNA sequencing. Nat. Biotechnol. 31, 1023–1031 (2013).         State Comprehensive Cancer Center, Columbus, OH, USA. 24Department of Neurosurgery,
16. Sholl, L. M. et al. Institutional implementation of clinical tumor profiling on an unselected   Brigham & Women’s Hospital, Harvard Medical School, Boston, MA, USA. 25Department of
    cancer population. JCI Insight 1, e87062 (2016).                                                Neurosurgery, Boston Children’s Hospital, Harvard Medical School, Boston, MA, USA.
17. Zehir, A. et al. Mutational landscape of metastatic cancer revealed from prospective            26
                                                                                                       Department of Pathology, Boston Children’s Hospital, Harvard Medical School, Boston, MA,
    clinical sequencing of 10,000 patients. Nat. Med. 23, 703–713 (2017).
                                                                                                    USA. 27Department of Pediatrics, Harvard Medical School, Boston, MA, USA. 28Department of
18. Campbell, B. B. et al. Comprehensive analysis of hypermutation in human cancer. Cell
                                                                                                    Radiation Oncology, Brigham and Women’s Hospital, Dana-Farber Cancer Institute, Boston
    171, 1042–1056.e10 (2017).
19. Stupp, R. et al. Radiotherapy plus concomitant and adjuvant temozolomide for                    Children’s Hospital, Harvard Medical School, Boston, MA, USA. 29Department of Radiology,
    glioblastoma. N. Engl. J. Med. 352, 987–996 (2005).                                             Brigham and Women’s Hospital, Dana-Farber Cancer Institute, Harvard Medical School,
20. van den Bent, M. J. et al. Adjuvant procarbazine, lomustine, and vincristine chemotherapy       Boston, MA, USA. 30Onconeurotek Tumor Bank, Institut du Cerveau et de la Moelle épinière,
    in newly diagnosed anaplastic oligodendroglioma: long-term follow-up of EORTC brain             ICM, Paris, France. 31Ludwig Center at Harvard Medical School, Harvard Medical School,
    tumor group study 26951. J. Clin. Oncol. 31, 344–350 (2013).                                    Boston, MA, USA. 32Laboratory of Systems Pharmacology, Harvard Medical School, Boston,
21. Kim, J. et al. Somatic ERCC2 mutations are associated with a distinct genomic signature         MA, USA. 33Sorbonne Université, Inserm, UMR 938, Centre de Recherche Saint Antoine,
    in urothelial tumors. Nat. Genet. 48, 600–606 (2016).
                                                                                                    Equipe Instabilité des Microsatellites et Cancer, Equipe labellisée par la Ligue Nationale
22. Berends, M. J. et al. Molecular and clinical characteristics of MSH6 variants: an analysis of
                                                                                                    contre le Cancer, Paris, France. 34These authors contributed equally: Mehdi Touat, Yvonne Y.
    25 index carriers of a germline variant. Am. J. Hum. Genet. 70, 26–37 (2002).
23. Yang, G. et al. Dominant effects of an Msh6 missense mutation on DNA repair and cancer          Li. 35These authors jointly supervised this work: Rameen Beroukhim, Pratiti Bandopadhayay,
    susceptibility. Cancer Cell 6, 139–150 (2004).                                                  Franck Bielle, Keith L. Ligon. ✉e-mail: mehdi.touat@gmail.com; rameen_beroukhim@dfci.
24. Ollier, E. et al. Analysis of temozolomide resistance in low-grade gliomas using a              harvard.edu; pratiti_bandopadhayay@dfci.harvard.edu; franck.bielle@aphp.fr; keith_ligon@
    mechanistic mathematical model. Fundam. Clin. Pharmacol. 31, 347–358 (2017).                    dfci.harvard.edu

                                                                                                                                              Nature | Vol 580 | 23 April 2020 | 523
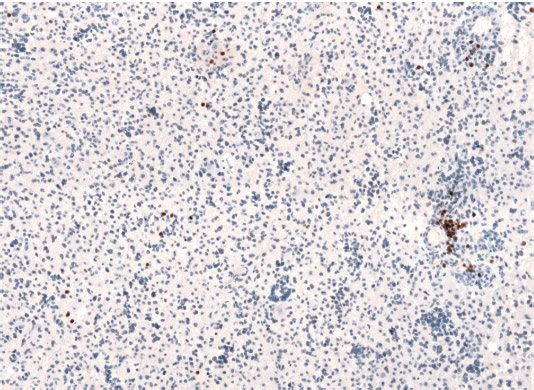
Mechanisms and therapeutic implications of hypermutation in gliomas
Article
Methods                                                                      In brief, between 50 and 200 ng tumour DNA was prepared as previously
                                                                             described16,37, hybridized to custom RNA bait sets (Agilent SureSelect
Datasets                                                                     TM, San Diego, CA) and sequenced using Illumina HiSeq 2500 with
For the DFCI-Profile dataset, clinical data and tumour variant calls         2 × 100 paired-end reads. Sequence reads were aligned to reference
identified through targeted next-generation sequencing (NGS) panels          sequence b37 edition from the Human Genome Reference Consortium
of 1,628 gliomas sequenced between June 2013 and November 2018 as            using bwa, and further processed using Picard (version 1.90, http://
part of a large institutional prospective profiling program (DFCI-Profile)   broadinstitute.github.io/picard/) to remove duplicates and Genome
were included16 (Extended Data Fig. 1). The distinction between pho-         Analysis Toolkit (GATK, version 1.6-5-g557da77) to perform localized
ton and proton radiotherapy was not systematically captured; the             realignment around indel sites38. Single-nucleotide variants were called
vast majority of patients underwent photon radiotherapy. For the             using MuTect v1.1.439, insertions and deletions were called using GATK
MSKCC-IMPACT and FMI datasets, clinical data and tumour variant              Indelocator, and variants were annotated using Oncotator40. Copy
calls from a total of 545 and 8,121 samples, respectively, that could be     number variants and structural variants were called using the internally
assigned to a molecular subgroup (see below) were included15,17,32,33. For   developed algorithms RobustCNV41 and BreaKmer42 followed by manual
pan-cancer analyses in targeted panel sets, clinical data and tumour         review. To filter out potential germline variants, the standard pipeline
variant calls from the GENIE project (a repository of genomic data           removes SNPs present at >0.1% in Exome Variant Server, NHLBI GO
obtained during routine clinical care at international institutions) were    Exome Sequencing Project (ESP), Seattle, WA (http://evs.gs.washington.
downloaded from Synapse (public data, release v6.1)34. For pan-cancer        edu/EVS/, accessed May 30, 2013), present in dbSNP, or present in an
analyses in whole-exome sequencing sets, clinical data and tumour vari-      in-house panel of normal tissue, but rescues those also present in the
ant calls from 17 hypermutated glioblastomas4 and from the pan-cancer        COSMIC database43. For this study, variants were further filtered by
TCGA dataset were downloaded from the NCI Genomic Data Com-                  removing variants present at >0.1% in the gnomAD v.2.1.1 database
mons35. In addition, 247 gliomas collected at one site between 2009          or annotated as benign or likely benign in the ClinVar database44,45.
and 2017 were analysed for protein expression of four MMR proteins           Arm-level copy number changes were generated using an in-house
(MSH2, MSH6, MLH1, and PMS2) using immunohistochemistry. Writ-               algorithm specific for panel copy number segment files followed by
ten informed consent or IRB waiver of consent was obtained from all          manual expert review. We set a copy number segment mean log2 ratio
participants. Patients of the FMI dataset were not consented for release     threshold at which we could accurately call arm amplification and dele-
of raw sequencing data. The study, including the consent procedure,          tion based on the average observed noise in copy number segments.
was approved by the institutional ethics committees (10-417/11-104/17-       Chromosome arms were classified as amplified or deleted if more than
000; Western Institutional Review Board (WIRB), Puyallup, WA).               70% of the arm was altered. A sample was considered co-deleted if more
                                                                             than 70% of both 1p and 19q were deleted.
Tumour genotyping and diagnosis                                                 Sequencing data from MSKCC-IMPACT were generated at the Memo-
For the majority of samples, genomic testing was ordered by the pathol-      rial Sloan Kettering Cancer Center using a custom targeted panel cap-
ogist or treating physician as part of routine clinical care to identify     ture to examine the exons of 341 (IMPACT341) or 398 (IMPACT410)
relevant genomic alterations that could potentially inform diagnosis         cancer-associated genes as previously described17. The FMI dataset
and treatment decisions. Patients who underwent DFCI-Profile testing         comprised specimens sequenced as a part of clinical care using a
signed a clinical consent form, permitting the return of results from        targeted next-generation sequencing assay as previously described
clinical sequencing. In total, 1,628 gliomas were sequenced as part of       (FoundationOne or FoundationOne CDx, Cambridge, MA)15,33. Germline
a cohort of 21,992 tumours prospectively profiled between June 2013          variants without clinical significance were further filtered by applying
and November 2018. Research tumour diagnoses were reviewed and               an algorithm to determine somatic or germline status46. Results were
annotated according to histopathology, mutational status of IDH1 and         analysed for genomic alterations, TMB, MSI and mutational signa-
IDH2 genes, and whole-arm co-deletion of chromosomes 1p and 19q              tures. TMB was assessed by counting all mutations and then excluding
(1p/19q co-deletion), according to WHO 2016 criteria12. All samples          germline and known driver mutations33,43,47. The remaining count was
were assigned to one of four main molecular subgroups: IDH1/2-mutant         divided by the total covered exonic regions15,33. MSI status was deter-
and 1p/19q co-deleted oligodendrogliomas (high- and low-grade),              mined as previously described48. A log-ratio profile for each sample was
IDH1/2-mutant astrocytomas (high- and low-grade), IDH1/2 wild-type           obtained by normalizing the sequence coverage at all exons and ∼3,500
glioblastomas (high-grade only), and IDH1/2 wild-type gliomas of other       genome-wide SNPs against a process-matched normal control. This pro-
histologies (high- and low-grade), the latter including grade I pilocytic    file was corrected for GC-bias, segmented and interpreted using allele
astrocytomas, glioneuronal tumours and other unclassifiable gliomas.         frequencies of sequenced SNPs to estimate tumour purity and copy
For simplification, IDH1/2 wild-type grade III anaplastic astrocytomas       number at each segment. Loss of heterozygosity (LOH) was called if
and grade IV diffuse intrinsic pontine gliomas were assigned to the          local copy number was 1, or if local copy number was 2 with an estimated
group of IDH1/2 wild-type glioblastomas in all analyses. Samples for         tumour minor allele frequency of 0%. To assess 1p/19q co-deletion, we
which the clinical diagnosis of glioma could not be confirmed (other         calculated the percentage of each chromosome arm that was monoal-
histology or possible non-tumour sample) and five samples with miss-         lelic (under LOH)46. A sample was considered 1p/19q co-deleted if both
ing minimal clinical annotation were excluded from all analyses. For         1p and 19q were >50% monoallelic.
the MSKCC-IMPACT and FMI datasets, patients also signed a consent               For the DFCI-Profile and FMI datasets, the appropriate cutoffs for
form, and samples were classified using the same procedure. MGMT             hypermutation (17.0 and 8.7 mut/Mb, respectively) were determined by
promoter methylation status was determined as part of routine clini-         examining the distribution of TMB in all samples and further confirmed
cal care using chemical (bisulfite) modification of unmethylated, but        using segmented linear regression analysis (Extended Data Fig. 2). For
not methylated, cytosines to uracil and subsequent PCR using primers         the MSKCC-IMPACT datasets, a threshold previously validated in this
specific for either methylated or the modified unmethylated DNA in the       dataset was used17. In all analyses, the homopolymer indel burden was
CpG island of the MGMT gene (GenBank accession number AL355531               calculated by computing the number of single base insertions or dele-
nt46931-47011).                                                              tions in homopolymer regions of at least 4 bases in length and dividing
   Targeted panel next-generation sequencing (DFCI-Profile) was per-         the count by the total exonic coverage as previously established49.
formed using the previously validated OncoPanel assay at the Center          Somatic variants were annotated as previously described15–17,36,37. In
for Cancer Genome Discovery (Dana-Farber Cancer Institute) for               addition, for the DFCI-Profile and MSKCC-IMPACT datasets, variants in
277 (POPv1), 302 (POPv2), or 447 (POPv3) cancer-associated genes16,36.       a selected list of glioma- and DNA-repair associated genes (IDH1, IDH2,
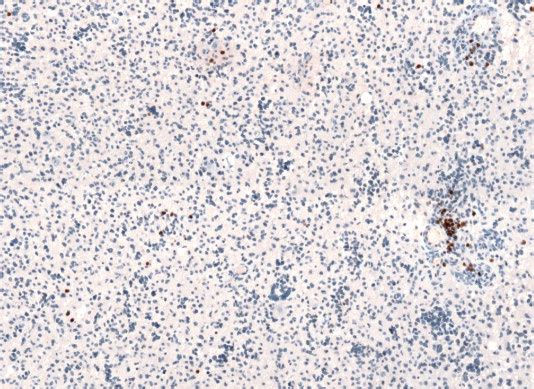
Mechanisms and therapeutic implications of hypermutation in gliomas Mechanisms and therapeutic implications of hypermutation in gliomas
You can also read