METLIFECARE FY14 RESULTS PRESENTATION - 25 AUGUST 2014 GREENWOOD PARK. TAURANGA - HOTCOPPER
←
→
Page content transcription
If your browser does not render page correctly, please read the page content below
Metlifecare FY14
                           Results
                           Presentation

                           25 August 2014
Greenwood Park. Tauranga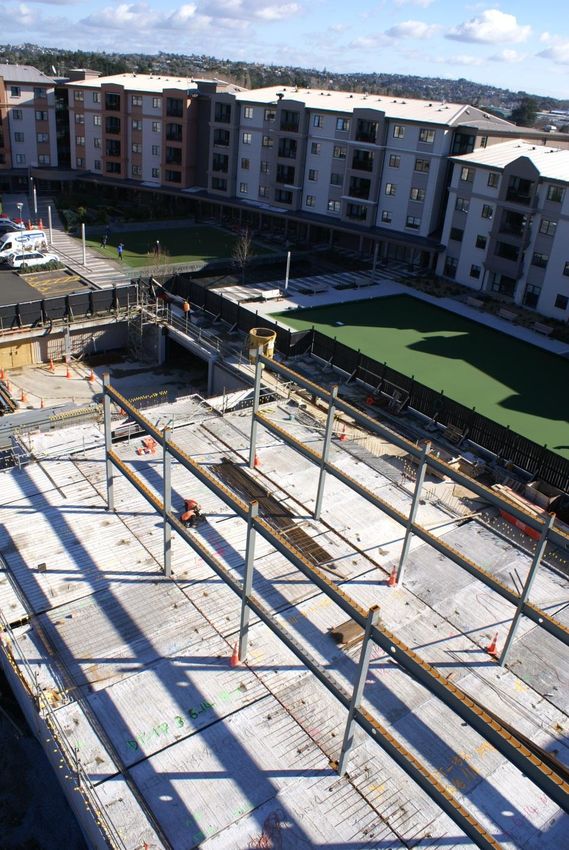
Contents
#1   FY14 Results Highlights           3

#2   FY14 Financial Performance        5

#3   FY14 Operating Metrics           11

#4   Development & Growth             17

#5   Business & Market                21

     Appendix: Portfolio
     Summary                          24

                                  2
1 14 Results Highlights
Net profit after tax $68.8m up 18.0% after removing non-recurring items1 (refer page 6)
FY14 final dividend declared of 2.5 cents per share payable 17 October 2014
Underlying profit $46.0m2 up 37.2% after removing non recurring items (refer page 7)
Financial
Extended the maturity of our core debt facility from 30 September 2015 to 31 October 2017
Extended the maturity of our development debt facility from 30 September 2016 to 31 October
2018
On track to deliver targeted sustainable development rate of 200+ units per annum by 2015
The Orchards stage 1 and 2 under construction with completion anticipated in June 2015
(96 units and 36 care beds and total value in excess of $40m)
Obtained resource consent for Greenwich Gardens, site preparation complete and tendering
Development stages 1 & 2 in progress (310 units and 61 care beds and total value in excess of $160m)
The Poynton stage 3 complete (55 units) with stage 4 underway (62 units) due to be
Activity
completed June 2015
Development pipeline of 1,058 units and beds including 160 currently under construction
Settled 61 new units with development margin of 21.3%3
Completed 64 new units during the period
CBRE property revaluations resulted in a fair value increase of $65.7m across the portfolio –
Revaluations 11.6% increase on the pcp
CBRE average valuation price per unit increased by 5.16% over the year
1 Non recurring items include the acquisition of Vision Senior Living and Private Life Care Holdings and the disposal of the Oakwood’s village which occurred in the prior period and not in the current period. It is a non-GAAP financial measure and is not
prepared in accordance with NZ IFRS. Metlifecare believes it assists readers understand the operating performance of the business on a comparable basis. Details of the items are shown on page 6 of this presentation.
2 Underlying profit removes the impact of unrealised gains on investment properties and excludes one-off gains and deferred taxation. It is a non-GAAP financial measure and is not prepared in accordance with NZ IFRS. Underlying profit is an
industry-wide measure and Metlifecare believes it assists readers understand the operating performance of the business. Underlying profit is reconciled to reported profit on page 7 of this presentation.
3 Development margin is the margin obtained on selling an occupation right agreement following the development of the unit. The calculation includes construction costs, non
recoverable GST, land apportionment, capitalised interest to the date of completion and infrastructure costs but excludes construction costs associated with amenities. Margins are
calculated based on when a stage is completed. Margins presented above are on the basis of the settled units during the period.
3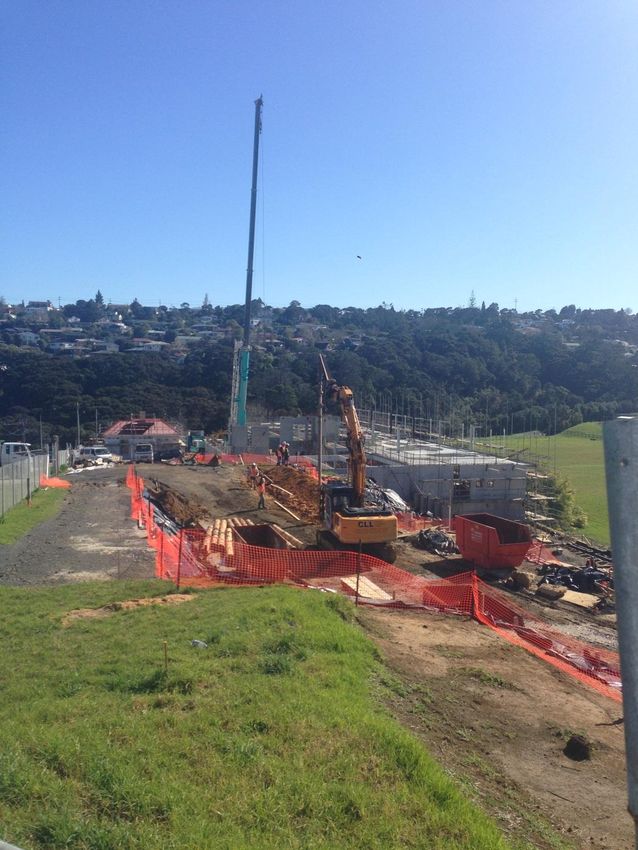
1 14 Results Highlights
Occupancy of resales stock 96%
57 completed new sales stock items available as at 30 June 2014, including 18 under
contract
Total settlements of 4581 units vs. 5371 units in the pcp
Operating Resales settlements 3971 units vs. 4241 units pcp
Activities New sales settlements 61 units vs. 113 units pcp
Deferred Management Fee (DMF) and Resale Gain per unit increased to $55k and $69k
respectively
Embedded value2 per unit increased to $130k
Operating cash flow of $59.5m down on the pcp as a result of lower new sales activity
(driven by lower levels of opening stock)
Completed Share Purchase Plan (SPP) fully subscribed in July 2013
Completed ASX listing in October 2013
RVG sold 100% of its shareholding to Infratil and NZ Superannuation Fund in November
Capital & 2013
Governance 3 new directors appointed to the Board in December 2013
Activity Peter Brown resigned from the Board and as Chairman effective 31 August 2014
Kim Ellis appointed to the Board on 25 August 2014 and as Chairman effective 1 September
2014
1Total settlement figures above include resales settlements for Metlifecare Palmerston North which under changes to NZ IFRS 11 in relation to joint venture accounting are excluded
when calculating average settlement values in the operational section. In FY14 resales settlements for Metlifecare Palmerston North were FY14 ILUs 5 and SAs 13 (FY13 ILUs 10 and
SAs 11).
2 Embedded value is calculated by taking the sum of the CBRE unit prices of units across our portfolio, deducting the resident refundable loan liability as per the balance sheet and
company-owned stock items. The embedded value is a combination of Resale Gains and Management Fee receivable. The value of the Membership Fee receivable is as per note 18 of
the Interim Financial Statements and the balance is Resale Gains. The per unit calculations have been adjusted for the Palmerston North joint venture accounting changes. Embedded
value assists readers to understand the potential future cash flows from Resale Gains & Management Fee Receivables for the business.
4
2.
                                               FY14
                                               Financial
                                               Performance

    The Poynton, Stage 4 under construction,
5
              Takapuna, Auckland
2 FY14 - Financial Performance
FY14 Total revenue 2.1% ahead of FY14 FY131
Profit & Loss
the pcp. ($m) ($m)
Total expenses below FY13 however Total revenue 94.8 92.8
excluding merger costs of $3.7m and
the impact of the sale of Oakwoods Fair value movement of investment property 65.7 58.9
village in Nelson $3.1m results in total Gain on acquisition - 63.6
expenses being 0.7% lower than
Joint Venture profit 0.5 0.6
FY13.
Fair Value movement for the period Total expenses (80.9) (88.3)
was $65.7m which was 11.6% ahead Finance costs (1.7) (8.6)
of the pcp.
Net profit before tax 78.4 119.0
Interest costs significantly below the
pcp as a result of the changes to the Tax benefit / (expense) (9.6) 1.3
capital structure in FY13.
Net profit after tax 68.8 120.3
FY14 final dividend declared of 2.5
One off gain on acquisition - (63.6)
cents per share payable on 17
October 2014 taking the full year Acquisition & integration costs - 3.7
dividend to 3.75 cents per share. Oakwood’s - (2.1)
Net profit excluding non-recurring Net profit excluding non recurring items2 68.8 58.3
items2 up 18.0%.
1 FY13 has been restated as a result of the introduction of NZ IFRS 11 in relation to joint venture accounting. The result is that the revenue and expenses for Metlifecare Palmerston North are excluded from the FY13 comparatives. We are
required to account for the share of profit as one line. This has not changed the net profit, however revenue and expenses as previously disclosed have changed. Further detail is provided in notes 15 and 16 of the Financial Statements.
2 Non recurring items include items associated with the acquisition of Vision Senior Living and Private Life Care Holdings and the disposal of the Oakwood’s village which occurred in the prior period and not in the current period. It is a non-GAAP
financial measure and is not prepared in accordance with NZ IFRS. Metlifecare believes it assists readers to understand the operating performance of the business on a comparable basis.
6
2 FY14 - Financial Performance
Underlying profit up FY14 FY132
37.2% on pcp. Underlying Profit1
($m) ($m)
61 new sales
settlements during the Net profit excluding non recurring items 68.8 58.3
period with realised
development margins of Fair Value movement of investment property (65.7) (58.9)
21.3%. Realised gain on resales 26.0 27.3
Resales gains slightly
lower than FY13 as a Realised development margin3 7.3 8.1
result of lower volumes
(397 vs. 424). Deferred tax benefit / (expense) 9.6 (1.3)
Deferred tax has Underlying profit 46.0 33.5
increased as a result of
an increase in the future
value of DMF income.
1 Underlying profit removes the impact of unrealised gains on investment properties and excludes one-off gains and deferred taxation. It is a non-GAAP financial measure and is not prepared in accordance with NZ IFRS. Underlying profit is an
industry-wide measure and Metlifecare believe it assists readers to understand the operating performance of the business.
2 FY13 has been restated as a result of the introduction of NZ IFRS 11 in relation to joint venture accounting. The result is that the revenue and expenses for Metlifecare Palmerston North are excluded from the FY13 comparatives. We are
required to account for the share of profit as one line. This has not changed the net profit, however revenue and expenses as previously disclosed have changed. Further detail is provided in notes 15 and 16 of the Financial Statements.
3 Realised development margin is the margin obtained on selling an occupation right agreement following the development of the unit. The calculation includes construction costs,
non recoverable GST, land apportionment, capitalised interest to the date of completion and infrastructure costs but excludes construction costs associated with amenities. Margins
are calculated based on when a stage is completed. Margins presented above are on the basis of the settled units during the period.
72 FY14 - Financial Performance
The table below splits operating cash flows between new sales, resales, operations and interest (refer page 26 for additional
detail).
FY14 FY131
Operating Cash Flow ($m) ($m)
Operating cash flow – new sales & resales split
New sales revenue 34.4 48.9
Realised resale gains 26.0 27.3
Net ORA revenue 60.4 76.2
Net operations performance 0.9 (2.7)
Interest paid (1.8) (9.2)
Acquisition & integration costs - (4.1)
Net operating cash flow 59.5 60.2
Operating cash flows were marginally behind FY13 predominantly as a result of lower new sales volumes.
New sales cash flows down as a result of lower levels of new sales stock relative to FY13 (the Vision and PLC merger resulted in
large levels of new sales stock which were sold in FY13).
Net operations performance has improved on the pcp as a result of the benefits of the merger and increasing DMF cash.
Interest paid has reduced significantly as a result of lower debt levels and improved funding terms.
1FY13 has been restated as a result of the introduction of NZ IFRS 11 in relation to joint venture accounting. The result is that the cash flows for Metlifecare Palmerston North are
excluded from the FY13 comparatives. We are required to account for the share of profit as one line. Further detail is provided in notes 15 and 16 of the Financial Statements.
82
FY14 – Financial Performance
FY14 FY131
Balance Sheet ($m) ($m)
Cash & other assets 20.6 21.2
Total assets have grown by
6.1%. Property plant & equipment 28.1 27.0
Equity has increased by Investment properties 1,961.0 1,845.1
10.3% as a result of the profit Total assets 2,009.7 1,893.3
for the period and the Share
Purchase Plan funds. Payables & other liabilities 18.2 16.8
NTA per share increased by Bank loans 42.5 55.5
8.4% on the pcp.
Deferred membership fees 77.9 72.7
Embedded value1 per unit has
increased 10.2% relative to Refundable occupation right agreements 1,011.5 972.4
the pcp.
Deferred tax liability 67.8 58.1
All core and development
Total liabilities 1,217.9 1,175.5
debt relates specifically to
development projects or land. Total equity 791.8 717.8
NTA ($ per share) 3.75 3.46
Embedded value ($m)2 484.8 435.5
Embedded value per Unit ($’000) 130 118
1FY13 has been restated as a result of the introduction of NZ IFRS 11 in relation to joint venture accounting. The result is that the assets and liabilities for Metlifecare Palmerston North are excluded from the FY13 comparatives. Further detail is
provided in notes 15 and 16 of the Financial Statements.
2 Embedded value is calculated by taking the sum of the CBRE unit prices of units across our portfolio, deducting the resident refundable loan liability as per the balance sheet and
company-owned stock items. The embedded value is a combination of Resale Gains and Management Fee receivable. The value of the Membership Fee receivable is as per note 18 of
the Interim Financial Statements and the balance is Resale Gains. The per unit calculations have been adjusted for the Palmerston North joint venture accounting changes. Metlifecare
believes that embedded value figures assist readers to understand the future cash flows from Resale Gains & Management Fee Receivables for the business.
92
FY14 – Financial Performance
FY14 FY131
Investment Properties ($m) ($m)
Development land 38.0 41.2
Investment properties under development 18.5 10.8
Completed investment properties 817.5 752.0
Total valuation 874.0 804.0
Plus: Refundable occupation right agreement
1,245.4 1,181.4
amounts
Plus: Residents’ share of capital gains 29.5 29.8
Plus: Deferred Membership Fee 77.9 72.7
Less: Membership fee receivables (258.2) (234.6)
Less: Occupation right agreement receivables (7.6) (8.2)
Total investment properties 1,961.0 1,845.1
The value of total investment properties has increased by 6.3% on FY13.
CBRE completed the full year valuations. Discount rates and property price growth
assumptions have remained largely unchanged:
— Discount rates range between 12.3% – 16.5%
— Property price growth assumptions range between 1.8% – 3.4%
— CBRE average list price per unit has increased by 5.2% for the full year period
1FY13 has been restated as a result of the introduction of NZ IFRS 11 in relation to joint venture accounting. The result is that the revenue and expenses for Metlifecare Palmerston
North are excluded from the FY13 comparatives. We are required to account for the share of profit as one line. This has not changed the net profit, however revenue and expenses
as previously disclosed have changed. Further detail is provided in notes 15 and 16 of the Financial Statements.
103.
FY14
Operating
Metrics
Greenwood Park. Tauranga
113 FY14 - Operating Metrics
Full Year Resales & New Sales Activity1
600
500 113
61
400
300 46 36
29
200 40 424 397
301 267 294
100 200
-
FY09 FY10 FY11 FY12 FY13 FY14
Resales New Sales
Settlement volumes are lower than FY13 as a result of lower levels of available stock to sell.
New sales stock available at the start of FY14 was lower than FY13 due to the merger, therefore new sales settlements
volumes are down.
Resales volumes are down on FY13. This is a result of the lower levels of available stock relative to the pcp particularly in
the Auckland villages.
Occupancy consistent with the pcp at 96%.
1Total settlement figures include resales settlements for Metlifecare Palmerston North which under changes to NZ IFRS 11 in relation to joint venture accounting are excluded when calculating average settlement values in the
operational section. In FY14 resales settlements for Metlifecare Palmerston North were FY14 ILUs 5 and SAs 13 (FY13 ILUs 10 and SAs 11).
The operating metrics section includes non-GAAP financial measures for new sales, resales and occupancy which assists the reader with understanding the volumes of units
settled during the period and the impact that new sales and resales during the period has had on occupancy as at the end of the period. FY14 and FY13 include Vision
Senior Living and Private Life Care Holdings however prior period do not.
123 FY14 - Operating Metrics
FY141 FY131
Settlements
($m) ($m)
New sales cash 34.4 48.9
Resales cash 140.3 147.3
Total settlements cash 174.7 196.2
Realised gain on resales (net of repurchases) 26.0 27.3
DMF realised 20.9 22.7
New sales cash down as stock is rebuilt through increased construction activity.
Resales cash down as a result of lower volumes.
Net resales cash slightly lower than the pcp however slightly higher on a per unit basis ($69k vs. $68k).
Realised DMF cash lower as a result of the lower settlement volumes and the per unit value also slightly lower ($55k vs.
$56k).
This is the result of the mix of units settled during the year with 27% relating to serviced apartments (FY13 - 21%).
Greater levels of serviced apartment settlements drive lower DMF and Resale gains because they are of lower value.
1Settlement cash flow figures above exclude resales settlements for Metlifecare Palmerston North as a result of changes to NZ IFRS 11 in relation to joint venture accounting. In FY14 resales settlements for
Metlifecare Palmerston North were FY14 ILUs 5 and SAs 13 (FY13 ILUs 10 and SAs 11).
The operating metrics section includes non-GAAP financial measures for new sales, resales and occupancy which assists the reader with understanding the volumes of units
settled during the period and the impact that new sales and resales during the period have had on occupancy as at the end of the period. FY14 and FY13 include Vision
Senior Living and Private Life Care Holdings however prior period does not.
133 FY14 - Operating Metrics
DMF & Resales Gain 1
140
120
100 56 55
42
44
80 32 38
60
40 73
63 60 66 68 69
20
-
FY09 FY10 FY11 FY12 FY13 FY14
Resales Gain DMF
DMF and resales gain has remained flat relative to the pcp however this has been impacted by the split of ILU
and SA resales settlements.
DMF will increase in line with the portfolio and list price growth and as we swap legacy DMF contracts to the
standard 30% membership fee over 3 years.
1 DMF and Resale gains figures above for FY13 and FY14 exclude resales settlements for Metlifecare Palmerston North which as a result of changes to NZ IFRS 11 in relation to joint venture accounting. In FY14
resales settlements for Metlifecare Palmerston North were FY14 ILUs 5 and SAs 13 (FY13 ILUs 10 and SAs 11).
The operating metrics section includes non-GAAP financial measures for new sales, resales and occupancy which assists the reader with understanding the volumes of units
settled during the period and the impact that new sales and resales during the period has had on occupancy as at the end of the period. FY14 and FY13 include Vision
Senior Living and Private Life Care Holdings however prior period do not.
143 FY14 - Operating Metrics
Resales Occupancy - Excluding
Contracted Stock
98%
96%
94%
92%
90% 96% 96%
88% 93%
90% 91%
86% 88%
84%
FY09 FY10 FY11 FY12 FY13 FY14
Occupancy has improved historically and now remained stable at 96% relative to the pcp.
Including stock that is currently under contract, total occupancy increases to 97% which is consistent with the pcp.
There were 57 completed new sales stock items available as at 30 June 2014, including 18 currently under contract.
The operating metrics section includes non-GAAP financial measures for new sales, resales and occupancy which assists the reader with understanding the volumes of units
settled during the period and the impact that new sales and resales during the period has had on occupancy as at the end of the period. FY14 and FY13 include Vision
Senior Living and Private Life Care Holdings however prior period do not.
153 FY14 - Operating Metrics
Embedded Value
140
120
100 61
53 54
80 53 60
60
40 69
54 60 53 64
20
0
FY11 FY12 FY12 - FY13 FY14
Merged
Management Fee Receivable Resale Gain
Embedded value1 per unit has increased by 10.2% relative to the pcp.
We have seen an increase in DMF and resale gain per unit as a result of the pricing increases and moving legacy contracts
to the standard 30% membership fee over 3 year contract.
The sum of the list prices for Embedded Value is based on the CBRE valuation list prices.
1 Embedded value is calculated by taking the sum of the CBRE unit prices of units across our portfolio, deducting the resident refundable loan liability as per the balance sheet and company-owned stock items. The embedded value is a combination of
Resale Gains and Management Fee receivable. The value of the Membership Fee receivable is as per note 18 of the Interim Financial Statements and the balance is Resale Gains. The per unit calculations have been adjusted for the Palmerston North
joint venture accounting changes. Metlifecare believes that embedded value figures assist readers to understand the future cash flows from Resale Gains & Management Fee Receivables for the business.
The operating metrics section includes non-GAAP financial measures for new sales, resales and occupancy which assists the reader with understanding the volumes of units
settled during the period and the impact that new sales and resales during the period has had on occupancy as at the end of the period. FY14 and FY13 include Vision
Senior Living and Private Life Care Holdings however prior period do not.
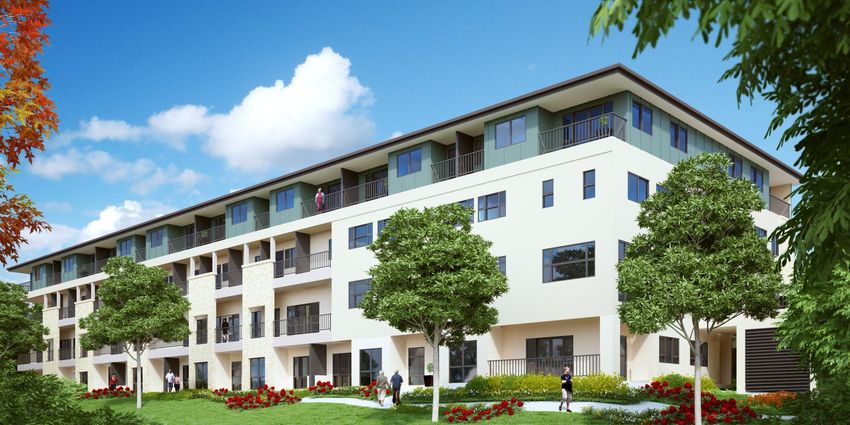
16Artist Impression Only
The Orchards – Glenfield, Auckland
4.Development & Growth
174 Development & Growth
Development Pipeline
TOTAL PIPELINE 797 261
Greenwich Gardens 310 61
The Orchards 96 36
Somervale 5 30
Oakridge Villas 63
Units
Papamoa Beach
118 36 Care Beds
Village
The Poynton 62
Greenwood Park 34 60
Crestwood 44
Coastal Villas 23
The Avenues 42 38
0 200 400 600 800 1000 1200
On track to deliver targeted sustainable development rate of 200+ units and care beds per annum by FY15.
Brownfield and greenfield development pipeline of 1,058 units and care beds including 147 currently under construction
Units 797
Care beds 261
184 Development & Growth
We are progressing the following development activities:
The Orchards (Glenfield)
Obtained resource and progressing building consents to build 96 units and a 36-bed care facility
Started construction on stage 1 & 2 including 54 apartments, the community facility and the 36-bed care facility
Greenwich Gardens (Unsworth Heights, North Shore Auckland)
Obtained resource and progressing building consents for 310 units and a 61-bed care facility
Completed the detailed design on stage 1 and stage 2 being 27 villas
Bulk earthworks completed June 2014
27 Stage 1 & 2 villas, construction due to commence in August 2014
The Poynton (Takapuna)
Stage 4 – 62 units due to complete in June 2015
Coastal Villas (Paraparaumu) – construction of 7 new villas and 8 apartments will commence in Q1 FY15
The Avenues (Tauranga) - Resource consent applications submitted.
Crestwood (New Lynn) and Somervale (Mt Maunganui) - Resource Consent applications for new developments will be
submitted early FY15
Greenwood Park (Tauranga) and Pakuranga Village (East Auckland) - Master plans continue.
194 Development & Growth
Metlifecare will continue to focus on the premium Auckland, Hamilton and Bay of Plenty regions.
Metlifecare Comparison Metlifecare Comparison
Exposure by Value Exposure by Units Location
1% 1%
17% 18%
BOP BOP
Lower Nth Island 10% Lower Nth Island
Waikato Waikato
16%
Auckland Auckland
5%
Northland 60% Northland
67%
5%
205.
Business &
Market
The Orchards, Stages 1 and 2 under construction,
21 Glenfield, Auckland5
Business & Market
Our Business
Leaders in providing innovative and sustainable solutions for the lifestyle and
care needs of older people.
Development of retirement and aged care facilities designed to meet the
unique needs of each community in which we are located.
Five revenue streams:
Village operations
Village services
Care services
New sales and resales
Development margins
Our Goals
To maintain a leadership position in the industry and…..
— to maintain a sustainable build rate of 200 units per year from FY 2015 onwards through both
greenfield and brownfield development;
— to increase the Company’s exposure to rest home and hospital care services;
— to optimise cash flows; and
— to continuously enhance the effectiveness and efficiency of the existing villages.
225 Business & Market
Market Opportunity - Compelling Demographic story
Over 20,000 pa growth in + 65 age group in New Zealand
Over 12,000 pa growth in + 75 age group in New Zealand
Life expectancy will increase – males from 78 to 85 years and females from 82 to 89 years
Over 5% of all people 65 and over live in retirement villages1
Over 10% of all people 75 and over live in retirement villages1
Population Aged 65 Years and Older
1,600
1,400
1,200
Population ‘000
1,000
800
600
400
200
0
2011 2016 2021 2026 2031 2036 2041 2046 2051 2056 2061
Source: Statistics New Zealand
1 Retirement Villages Association
23Appendices
Dannemora Gardens, Auckland
24Portfolio Summary
Metlifecare Portfolio as at 30 June 2014
Care Care Future Future Overall
Villages ILUs ILAs SAs Total Total Total
Beds Suites Units Hospital Total
The Avenues 90 90 42 38 80 170
Bayswater 159 56 17 232 6 6 238
Coastal Villas 133 8 49 190 30 30 23 23 243
Crestwood 121 14 135 41 41 44 44 220
Dannemora Gardens 201 201 201
Forest Lake Gardens 142 56 198 198
The Orchards - Glenfield 96 36 132 132
Greenwood Park 145 80 15 240 34 60 94 334
Hibiscus Coast Village 150 71 48 269 269
Hillsborough Heights Village 176 42 218 218
Highlands 129 70 199 41 41 240
Kapiti Village 225 0 225 225
Longford Park Village 144 4 45 193 193
Oakridge Villas 48 48 63 63 111
Pakuranga Village 69 18 87 60 60 147
Palmerston North Village 49 50 99 38 38 137
Papamoa Beach Village 50 50 118 36 154 204
Pinesong 100 232 27 359 10 10 369
Powley 46 34 80 45 45 125
Poynton 180 15 195 5 5 62 62 262
7 Saint Vincent 81 12 93 2 2 95
Somervale 83 11 94 40 40 5 30 35 169
Greenwich Gardens - Unsworth Heights 310 61 371 371
Wairarapa Village 56 25 81 41 41 122
Waitakere Gardens 324 324 324
Total 2,025 1,383 492 3,900 336 23 359 797 261 1,058 5,317
25Reconciliation of Operating Cash Flow
Operating Cash Flow FY14 ($m) FY13 ($m)
Resident receipts 75.7 78.4
ORA new sales & resales 174.7 196.2
Payments to suppliers (73.6) (79.2)
ORA repurchases (114.3) (120.0)
GST (1.2) (2.0)
Interest received 0.1 0.1
Interest paid (1.8) (9.2)
Acquisition & integration costs - (4.1)
Net operating cash per cash
flow 59.5 60.2
Operating cash flow with new sales
& resales split
New sales revenue 34.4 48.9
Net resales revenue 26.0 27.3
Net ORA revenue 60.4 76.2
Net operating performance 0.9 (2.7)
Interest paid (1.8) (9.2)
Acquisition & integration costs - (4.1)
Net operating cash per cash
flow 59.5 60.2
26Disclaimer
• The information in this presentation is an overview and does not contain all information necessary to make an investment
decision. It is intended to constitute a summary of certain information relating to the performance of Metlifecare Limited
(“Metlifecare”) for the year ended 30 June 2014.
• The information in this presentation does not purport to be a complete description of Metlifecare. In making an investment
decision, investors must rely on their own examination of Metlifecare, including the merits and risks involved. Investors
should consult with their own legal, tax, business and/or financial advisors in connection with any acquisition of securities.
• The information contained in this presentation has been prepared in good faith by Metlifecare. No representation or
warranty, expressed or implied, is made as to the accuracy, adequacy or reliability of any statements, estimates or
opinions or other information contained in this presentation, any of which may change without notice. To the maximum
extent permitted by law, Metlifecare, its directors, officers, employees and agents disclaim all liability and responsibility
(including without limitation any liability arising from fault or negligence on the part of Metlifecare, its directors, officers,
employees and agents) for any direct or indirect loss or damage which may be suffered by any recipient through use of or
reliance on anything contained in, or omitted from, this presentation.
• This presentation is not a prospectus, investment statement or disclosure document, or an offer of shares for subscription,
or sale, in any jurisdiction.
• This presentation includes non-GAAP financial measures in various sections. This information has been included on the
basis that management and the Board believe that this information assists readers with key drivers of the performance of
Metlifecare which are not otherwise disclosed as part of the financial statements.
27Glossary of Terms
– New Sales: The first time sale of an ORA (new stock)
– Resales: The sale of an ORA where a sale has previously been completed
– ORA: Occupation Right Agreement
– LTO: License to Occupy
– Gross Settlement Value: Total purchase price paid
– Net Settlement Value: Total purchase price paid less existing repayment obligation
– ILU: Independent Living Unit
– SA: Serviced Apartment
– Relicensing: Resales of ORAs
– PCP: Prior Comparable Period
28You can also read