Millennials and socialism: Australian youth are lurching to the left - Tom Switzer Charles Jacobs
←
→
Page content transcription
If your browser does not render page correctly, please read the page content below

EMBARGOED UNTIL 11.59PM, WEDNESDAY 20 JUNE 2018

                                           No. 7 • June 2018

Millennials and socialism:
  Australian youth are
   lurching to the left
             Tom Switzer
            Charles Jacobs
EMBARGOED UNTIL 11.59PM, WEDNESDAY 20 JUNE 2018
EMBARGOED UNTIL 11.59PM, WEDNESDAY 20 JUNE 2018

      Millennials and socialism:
     Australian youth are lurching
               to the left

                  Tom Switzer
                Charles Jacobs

                  POLICY Paper 7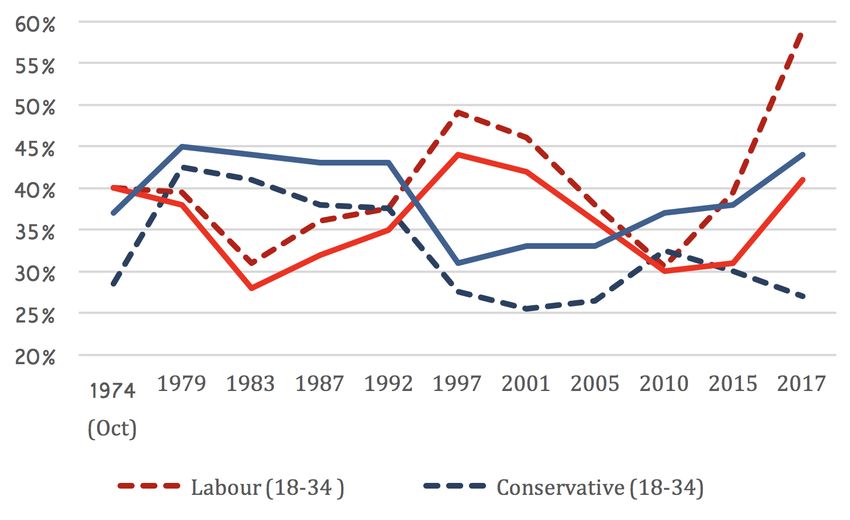
EMBARGOED UNTIL 11.59PM, WEDNESDAY 20 JUNE 2018

Contents
Millennials and socialism..........................................................................................1

Attitudes towards socialism......................................................................................2

       Favourability towards Socialism........................................................................2

       Views on capitalism and government intervention...............................................2

       A flow-on effect..............................................................................................3

International comparisons.......................................................................................5

Youth shifting to the left..........................................................................................7

A matter of ignorance.............................................................................................9

Conclusion .......................................................................................................... 11

Endnotes............................................................................................................. 11
EMBARGOED UNTIL 11.59PM, WEDNESDAY 20 JUNE 2018
Millennials and socialism
The fall of the Berlin Wall on 9 November 1989 was Consequently, an ever-growing group of voters have
a prescient moment in global history. Although the never truly seen the effects of socialism. Millennials
Soviet Union would not officially collapse for another those born between 1980 and 1996 mostly came to
two years, the images of Berliners tearing down this their political awareness after socialism’s long reign of
physical and ideological barrier were emblematic of terror. The oldest were aged just nine when the Berlin
the Europe’s failed experiment with socialism. The iron wall fell.
curtain that had enveloped most of the continent’s
By the late 90s, when Millennials began to vote,
east had not brought equality and a classless society.
prosperity was on the rise. Australia was eight years
Nor had it brought the promised productivity and
into our record-breaking 27-year streak of economic
efficiency that would so its supporters claimed
growth.2 The United States was experiencing a similar
see socialism replace capitalism as the primary means
economic boom. Meanwhile, Europeans were bolstered
of global economic order.
by the newfound optimism of the post-Soviet era.
Rather, socialism had left a warren of poverty,
During the past decade, Millennials have acquired a
oppression and failed states in its wake. A stark
greater influence in society. Since 2014, the entire
warning to all those who lived through it to never
generation has been able to vote. In 2016 they made
repeat the mistakes of an ideology that, despite its
up over 30% of the Australian electorate.3 The oldest
romanticised ideals, led to as many deaths as both
Millennials are turning 38 in 2018, and are quickly
world wars combined.1
moving into more influential positions in politics,
While the lessons of this socialist disaster are business and the media. By 2020 they will make up
entrenched in the minds of a generation, the memory 35% of the world’s workforce.4
of the Soviet Union is beginning to fade. Meanwhile,
This being the case, it is important to understand
our understanding of the communist regime in China
how Millennials think, and what values drive them.
remains limited. There is less awareness of many of
As part of this process, the Centre for Independent
Asia’s 20th century conflicts, and the role socialism
Studies commissioned polling agency YouGov Galaxy
has played in them. As a result of our economic links
to sample the opinions of 1003 Australian Millennials
with China, we are also less likely to condemn their
on their views of socialism and its place in society. The
ideology as we once would have denounced the Soviet
following paper outlines our findings, looks at similar
Union.
analyses in other Western countries, and identifies
some clear overarching political trends that are
evolving as Millennials become increasingly influential.
1
EMBARGOED UNTIL 11.59PM, WEDNESDAY 20 JUNE 2018

    Attitudes towards socialism
    The polling undertaken highlights Australian                             underpinnings. Indeed, 30% of both TAFE qualified
    Millennials’ views of socialism and how these shape                      respondents and those without a tertiary qualification
    their attitudes towards the economy, capitalism and                      reported that they didn’t know what their view on
    the role of government in society. A full, tabulated                     socialism was.
    breakdown of responses to each question by all
                                                                             These findings are problematic for two reasons.
    variables is available in Appendix A.
                                                                             Firstly, it is a damning indictment on our school
                                                                             system that nearly a third of non-university educated
    Favourability towards Socialism                                          students have limited to no understanding of socialism
                                                                             as an ideology. In most constituencies, history is a
    Question 1 assessed asked Australian Millennials to
                                                                             non-compulsory subject in later years of high school
    respond based on their ‘Overall view of socialism’.
                                                                             and thus students are not educated on the failed
    Participants were asked to rate their views based on
                                                                             implementations of socialism throughout the 20th
    three major categories:
                                                                             century.
    •	Favourable view of socialism (Sub categories:
                                                                             Secondly, the fact that more university-educated
       Mostly favourable; Somewhat favourable)
                                                                             respondents demonstrated an awareness of socialism
    •	Unfavourable view of socialism (Sub categories:                       should lead to a higher proportion understanding its
       Mostly unfavourable; Somewhat unfavourable)                           practical failings. However, Millennial graduates viewed
                                                                             socialism more favourably than any other group.
    • Don’t know
                                                                             This raises questions about the lens through which
    A breakdown of results by major variables can be seen                    socialism is being portrayed in universities. In recent
    in Figure 1 below.                                                       years, critics have suggested that universities are
                                                                             lurching further to the left.5 Although more evidence-
    The most notable finding here was that, overall,
                                                                             based research is needed, the poll’s findings indicate
    58% of Australian Millennials polled view socialism
                                                                             that the trends are indeed endurable, and hint at this
    favourably. Less than a fifth (18%) view the ideology
                                                                             being an issue.
    unfavourably. Interestingly, this figure was common
    across the range of variables measured in the survey,
    with little significant difference between comparable                    Views on capitalism and government
    groups.                                                                  intervention
    The largest variation was university-educated                            It is important not to assume that Millennials’
    Millennials (63% favourable view of socialism)                           favourable views on socialism directly correlate with
    and those with TAFE/Technical qualifications (52%                        the belief that the ideology is ultimately the best
    favourable). Given that Millennials are far more                         approach for managing Australia. While someone
    likely to be exposed to socialism at university, this                    may find the overarching values and principles of an
    could in part be due to TAFE/Technical qualified                         ideology endearing, they may not necessarily believe
    Millennials’ lack of awareness of the ideology and its                   it to be the most rational and effective approach.

    Figure 1: Australian Millennials - Overall view of socialism

      Source: CIS/YouGov Galaxy Poll. Full breakdown available in Appendix A, Table 1.

2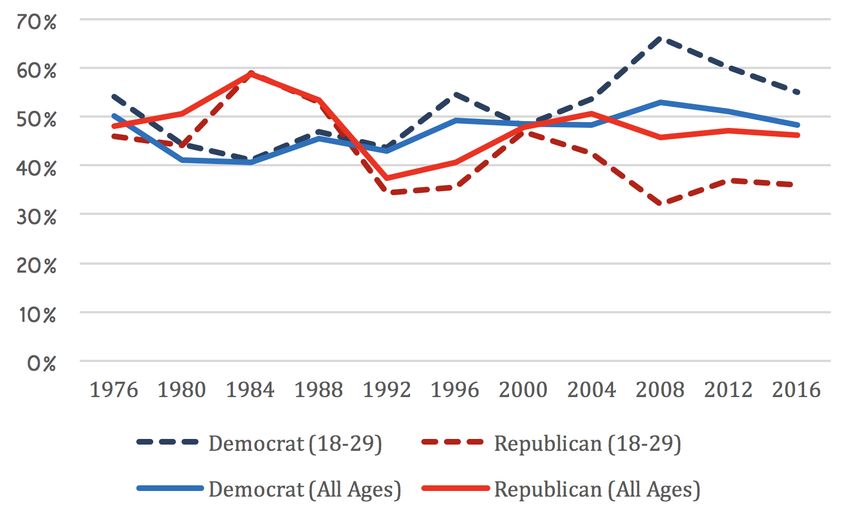
EMBARGOED UNTIL 11.59PM, WEDNESDAY 20 JUNE 2018

To understand how their views fit comparatively,                          and jobs in regional areas contributes to this
Australian Millennials were asked whether ‘Capitalism                     difference. Centralisation and the offshoring of most
has failed and government should exercise more                            manufacturing has disproportionately impacted
control of the economy’. They were given three                            the regions compared to major cities.6 Once again,
possible answers: Agree; Disagree; Don’t know. A                          university-educated Millennials were much more
breakdown of results by major variables can be seen                       likely to express a firm opinion on the question, with
in Figure 2 below.                                                        33% disagreeing that capitalism had failed and 57%
                                                                          agreeing. Only 11% said they didn’t know.
What is immediately striking is the similarity between
Figure 1 and Figure 2. Overall, 59% of Australian
Millennials believe that capitalism has failed and that                   A flow-on effect
the government must play a greater role in regulating                     Dissatisfaction with capitalism, taken together with
the economy. Once again, the trend is fairly consistent                   benign attitudes towards socialism, has meant that
across comparable groups. The biggest divergence is                       many Millennials hold pessimistic views about the
between urban and regional Millennials. Nearly two-                       current economic outlook. Respondents were asked
thirds (64%) of respondents in regional areas believed                    whether ‘Ordinary workers are worse off today
that capitalism has failed.                                               than they were 40 years ago’. They were given
                                                                          three possible answers: Agree; Disagree; Don’t know.
Conversely, 56% percent of urban Millennials held
                                                                          A breakdown of results by major variables can be seen
this opinion. It is likely that the loss of industries                    in Figure 3 below.

Figure 2: Australian Millennials - Capitalism has failed and the government should exercise more economic control

Source: CIS/YouGov Galaxy Poll. Full breakdown available in Appendix A, Table 4.

Figure 3: Australian Millennials - Workers are worse off now than 40 years ago

Source: CIS/YouGov Galaxy Poll. Full breakdown available in Appendix A, Table 2

                                                                                                                                   3
EMBARGOED UNTIL 11.59PM, WEDNESDAY 20 JUNE 2018
Here the trend again remains consistent, with nearly more than any other state polled. This is despite the
two-thirds of each grouping agreeing that workers are fact that, for nine consecutive quarters, the NSW
worse off. Those with no tertiary qualification were economy has been the best performing of any state
the most likely to agree, with 67% believing workers in Australia.7 In Western Australia, 53% of Millennials
were worse off. The largest group disagreeing with believed that workers were worse off, with 43%
the statement were those with a university degree. disagreeing with this statement. A full breakdown of
The difference between these two groups may be state responses for each question can be found in
a reflection of the growing ‘brain economy’, with Appendix A.
graduate qualifications increasingly viewed more
In reality, all workers, and indeed all Australians, are
favourably by employers.
substantially better off than 40 years ago. Disposable
Notably, 69% of respondents from New South Wales personal income and Australian consumer spending
agreed that the situation for workers had declined; both hit all-time highs in the fourth quarter of 2017.8
Figure 4: Australian Millennials - Allowing for inflation, Australia spends less on education
and health than we did 10 years ago
Source: CIS/YouGov Galaxy Poll. Full breakdown available in Appendix A, Table 3
Figure 5: Australia - Views on government spending poll (all ages)
Source: Parliament of Australia & ABC (See Endnotes for full details)
4EMBARGOED UNTIL 11.59PM, WEDNESDAY 20 JUNE 2018
The minimum wage has been on the rise, and in groups feeling ‘left out’ by the system. Urban and
the fourth quarter of 2017 weekly income reached university educated respondents were the least likely
an historical high of $1192 this was $254 (2017 to disagree.
dollars) more than in the fourth quarter of 1977.
Statistically, these assumptions are simply wrong.
Moreover, from the mid-1980s to about 2012, Government expenditure has grown by 30% in
Australia experienced the biggest national income real terms in the past decade. In 2007/08, total
boom since the gold rushes; and the economy is government funding for healthcare was $87 billion
presently in its 27th consecutive year of economic (2016/17 dollars).9 It had increased to more than
growth, surpassing the Netherlands for the gold medal $115 billion in real terms by 2015-16.10 Education
of the longest expansion in the modern era. spending has also increased substantially.11
And yet, Millennials believe the government should However, the above sentiments have contributed
be taking a more direct approach. As Figure 2 shows, to a massive rise in voter support for increased
59% of poll respondents believe the government government spending. Since Millennials were first able
should exercise more control over the economy. to vote in 1998, the percentage of voters favouring
Additionally, Millennials are frustrated with a perceived more spending on social services has increased
lack of government spending on social services. Poll dramatically (See Figure 5). While other factors may
respondents were asked whether, ‘After allowing for also be responsible for this trend, there is significant
inflation, Australia spends less on education and correlation between the growing number of Millennials
health than we did ten years ago.’ They were in the overall voter base and the desire to see the
given three possible answers: Agree; Disagree; Don’t government do more.
know. A breakdown of results by major variables can
In 2004, opinion reached a turning point, with more
be seen in Figure 4 below.
voters (38%) favouring spending on social services
While the results were less resounding than for other than a decrease in tax (35%) for the first time since
questions, a majority of respondents in every major polling began in 1984. In the following years, this
variable agreed with this statement. Overall, 56% has continued to grow. In 2016, Millennials made up
of Australian Millennials believed that less is spent nearly a third of the electorate (31%), with 55% of
on these major social services, while 30% did not. voters favouring an increase in government spending
Those from regional areas (61%) and those with no suggesting that they are having a major influence
tertiary qualifications (60%) were the most likely to on opinions.
be of this opinion. This may be a symptom of these
International comparisons
A comparison with other Western countries shows candidate Bernie Sanders’ description of himself as
that, similarly to Australia, Millennials prefer socialism a “democratic socialist.” Of Americans aged 18-29,
to capitalism. In 2016, YouGov undertook polls similar 19% said this statement would make them more likely
to our Australian study in both the United Kingdom to vote for him, with 11% saying it made them less
and United States. The results showed a clear likely. This was the inverse of the overall population,
differential between attitudes to these two ideologies. 12% saying this statement made voting for him more
Notably, however, the trends are not as extreme as likely, and 18% saying it made this less likely.
those identified in the CIS/YouGov Galaxy Australia
In the United Kingdom, socialism was significantly
poll.
more popular across all age groups. The 2016 YouGov
In the United States, 43% of respondents aged 18- Poll found that British people over 60 were the
29 viewed socialism favourably, with 26% viewing only age group to view the ideology unfavourably.
it unfavourably. Capitalism was viewed with more Among those aged 18-24, 38% of respondents
disdain. More than a third of American youth (36%) viewed socialism favourably, with 20% viewing it
viewed capitalism unfavourably. A little more than unfavourably. Capitalism was significantly more
30% viewed it favourably. This was significantly unpopular. Only 25% of the youth age bracket viewed
different to the overall American population, who it favourably, whilst 40% viewed it unfavourably.
viewed capitalism much more favourably and viewed Meanwhile, 39% of all Brits polled viewed capitalism
socialism with significant scepticism. unfavourably.
Falling in 2016, the YouGov poll was also able In similar circumstances to the United States, the
to gauge the reaction to Democratic primary United Kingdom has also witnessed the rise of a major
5EMBARGOED UNTIL 11.59PM, WEDNESDAY 20 JUNE 2018
political figure who identifies as socialist. Speaking Although Corbyn’s agenda is unthinkable to supporters
at the 2017 Labour Party Conference in Brighton, of the free market, his message has appealed to
leader Jeremy Corbyn argued that the Thatcher younger voters, many of whom feel left out in a
era “neoliberal” economic model was broken, and country that is seen as increasingly unequal.13 A 2015
promised to transform “the system” of wealth re- YouGov poll of Labour selectorate members revealed
distribution in Great Britain.12 He is promising to that 64% of respondents aged 18-24, and 67% of
nationalise many of Britain’s key industries, including those aged 25-39 the ‘Millennial’ generation
water, electricity, gas and railways. Meanwhile, preferred Jeremy Corbyn as Labour leader.14 Only 51%
Labour’s treasury spokesman John McDonnell has of Labour members in the 60+ bracket favoured him.
unashamedly quoted from Mao’s ‘Little Red Book’ in
parliament.
Figure 6: United States - Overall view of socialism and capitalism
Source: 2016 YouGov Poll US attitudes to socialism and capitalism (See Endnotes for full details)
Figure 7: United Kingdom - View of socialism and capitalism
Source: 2016 YouGov Poll UK attitudes to socialism and capitalism (See Endnotes for full details)
6EMBARGOED UNTIL 11.59PM, WEDNESDAY 20 JUNE 2018
Youth shifting to the left
Many will be familiar with the old adage: “If you’re When Barrack Obama was elected in 2008, 66% of
not a socialist at the age of 20 you have no heart. If young people voted for him. This was compared to
you’re not a conservative at the age of 40, you have 53% of the overall electorate. In 2016, despite Donald
no brain.”15 However, election data shows that this Trump’ shock victory, the Republican youth vote
is usually not the case. Typically, the youth vote has actually declined compared to 2012. A strong majority
matched the trend of the electorate. When the overall (55%) of voters aged 18-29 supported Hillary Clinton
vote has favoured parties of the right, youth have 7% more than the 48% of voters who supported
followed. When it has followed the left, younger votes her overall.
similarly have matched it.
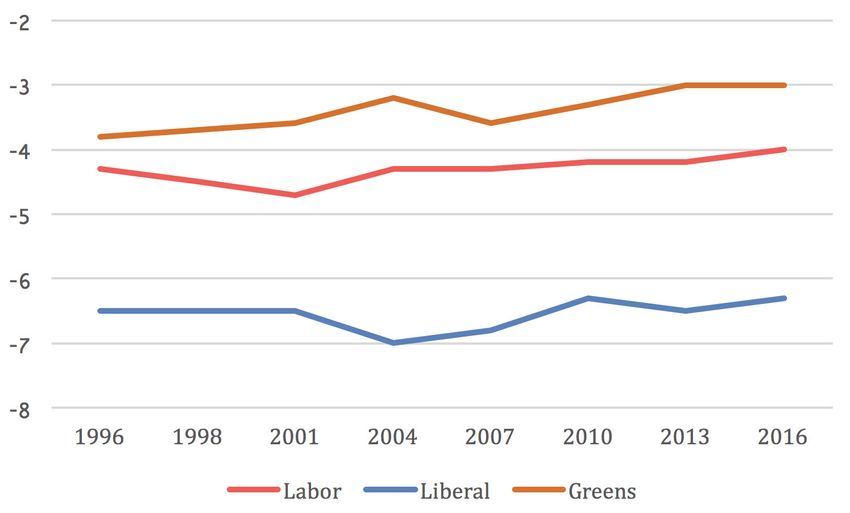
In the United Kingdom, young voters have also
However, analysis of data from several countries tended to mirror the overall nation (See Figure 9).
highlights a clear trend that has begun to develop as However, a similar divergence to parties on the
Millennials make up an increasingly larger percentage left has evolved since Millennials started becoming
of the voter base. What these findings demonstrate is politically active.
that Millennials’ favourable attitude towards socialism
This is most notable in the explosion of young people
forms part of a wider shift to the left in the youth
voting for the Labour Party in the 2015 and 2017
demographic.
general elections. By this stage, Millennials were
In the United States, younger voters reflected wider making up almost the entire 18-34 age bracket. In
election results from the 1970s to the turn of the 2015, 40% of this age bracket voted Labour and only
century (See Figure 8). When Ronald Reagan stormed 30% voted Conservative. This was despite Labour
to victory over Walter Mondale in 1984 with 59% recording its worst election result since 1987 and
of the vote, 59% of those aged 18-29 also voted the Conservatives winning 38% of the overall vote
for the conservative Republican. When Bill Clinton (Labour 31%), as well as claiming their first outright
defeated Bob Dole in 1996, young voters swung in the majority parliament since 1992.16
Democrat’s favour.
In 2017, Millennial voters moved towards Labour in
However, since the 2000 Presidential election the even more overwhelming numbers as part of what
first where Millennials could participate there has many described as a ‘youthquake’.17 According to
been a significant divergence. Youth have begun the Ipsos MORI poll, 59% of young voters supported
to back the Democrats at a rate disproportionately Labour and just 27% backed the Conservatives. This
higher than the rest of the electorate. When George was despite the Conservatives growing their share of
W. Bush’s overall vote share climbed in 2004, it fell the overall vote from 38% (2015) to 44%.
among young voters.
Figure 8 – United States presidential election polls
Source: Roper Center for Public Opinion Research: How groups voted polls, 1976-2016 collated (18-24 and 25-29 brackets merged)
7EMBARGOED UNTIL 11.59PM, WEDNESDAY 20 JUNE 2018
Figure 9 - United Kingdom general election polls
Source: Ipsos MORI: How Britain voted polls, 1974-2017 collated (18-24 & 25-34 brackets merged and averaged)
Figure 10: Australian Election Study - Voter’s left-right position (all ages)
Source: Australian Election Study - Trends in Australian Political Opinion, pp. 64
(Score scale inverted from a 0 to 10 rating to a 0 to -10 rating for graphical purposes)
In fact, while the Conservatives have increased their two decades. It asks voters to place themselves on
overall vote significantly since 1997, their share of a scale from the far left to far right. In 1996, two
the youth vote has declined in three of the last five years before Millennials were first able to vote, the
elections since the turn of the century. These are the Australian electorate was well to the right on the scale
only three occasions since polling began in the 1970s (See Figure 10).
where the Conservative youth vote hasn’t declined
or increased in correlation with the remainder of the However, since then voter polarity has moved
electorate. regularly to the left. In the 2016 federal election,
voter polarity tipped onto the left-wing side of the
In Australia, Millennials also appear to be leaning
more towards the left. Over the past decade, as scale for the first time since the measurement began.
Millennials have come to make up a more critical mass Comparing the evolution of this phenomenon over the
of voters, the polarity of the electorate has moved past two decades with Millennials’ combined voting
consistently to the left. The Australian Election Study power gives a telling insight into the nation’s general
has mapped out the attitudes of voters over the past shift to the left.
8EMBARGOED UNTIL 11.59PM, WEDNESDAY 20 JUNE 2018
Figure 11; Australian Election Study - Voters rating of party polarity
Source: Australian Election Study: Trends in Australian Political Opinion, pp. 65. (Score scale inverted from a 0 to 10 rating to a 0 to -10 rating for
graphical purposes. 0 = Far Left, -5 = Centre, -10 = Far Right)
As the number of Millennial voters has grown, voter who see the ideology in a positive light will likely
polarity has moved to the left at a remarkably similar continue to influence this evolution in voter polarity.
rate. When voter polarity first moved onto the left-
Australia’s political parties also appear moving further
wing side of the scale in 2016 it was the first Federal
towards the left. According to voter’s perceptions in
election where the entire Millennial generation was
the Australian Election Study,18 Labor has moved 7%
able to vote. By this stage, the group consisted of
more to the left than when the study began (See
31% of all voters.
Figure 11). Voters surveyed believe that the Greens
True, not all Australian Millennials are favourable have also moved to the left by 21%. The Liberal
towards socialism. However, the significant portion Party was even perceived to have moved 3% to the
left since 1996, shifting by more than 10% since its
highest ‘right-wing’ score in 2004.
A matter of ignorance
There is strong evidence to suggest Millennials are half (51%) didn’t know who Chinese communist
contributing to a leftwards shift across the western revolutionary Mao Zedong was. Only 21% were
world. A major part of this move is likely being familiar with him. Not only was Mao perhaps the most
driven by generally favourable attitudes towards important leader in Asia in the past century, he was
socialism and unfavourable opinions of capitalism. also responsible for between 37-45 million deaths
For the older generations who lived through the during the famine associated with his ‘Great Leap
Cold War, these attitudes may seem hard to fathom. Forward’ and ‘Cultural Revolution’.19
However, Millennials were largely unaffected by the
Similarly, 42% of Australian Millennials weren’t aware
global impacts of several decades of communist/
at all of Vladimir Lenin, the Bolshevik revolutionary,
socialist oppression. Consequentially, many may be
father of modern communism and inaugural premier
understandably unaware of its legacy.
of the Soviet Union. While more people (34%) were
Indeed, our CIS/YouGov Galaxy polling reveals that familiar with World War II Soviet leader Joseph Stalin
most Australian Millennials have a poor awareness a man responsible for the deaths of up to 43 million
of some of socialism’s most infamous historical people approximately two-thirds either didn’t know
figures (See Figure 12). Of those polled, more than him or were not familiar with his bloody history.20
9EMBARGOED UNTIL 11.59PM, WEDNESDAY 20 JUNE 2018
Figure 12: Familiarity with major historical figures
Source: CIS/YouGov Galaxy Poll. Full breakdown available in Appendix A, Table 5
Adolf Hitler, the fascist leader of Nazi Germany, serves British author and commentator James Bartholomew
as an interesting point of contrast. Nearly three- argues that society has a duty to educate the younger
quarters (73%) of Australian Millennials were familiar generations on the brutal legacy of socialism. Much
with the dictator and father figure of the Holocaust. like the Holocaust memorials that can be found in
Just 5% didn’t know who he was. Hitler was a product Sydney and London, he suggests: “We should create
of the same era as many of history’s most notorious a permanent reminder of what communism did to
socialist leaders. However, his story has been told far humanity and could potentially do again.”21 School
more widely. Hitler’s iconic moustache, swastika and history curriculums should ensure that youth are
Nazi salute are some of the most recognisable images aware of socialisms deadly impact on our Asian
in the world. The horrors of places like Auschwitz neighbours.
are forever engrained in our minds as example of Meanwhile, greater education on the practical failings
humanity at its cruellest. By contrast, how many of the ideology as an economic system could also
would be familiar with the hundreds of Soviet gulags serve as a reminder that economic prosperity is
the slave labour camps into which up to 50 million best obtained through the power of the free market.
people were incarcerated and which operated for All economies that have enjoyed growth and have
decades? broadened prosperity have done so through free trade
and free markets. Regulation and high taxation are
the enemy of prosperity, and prosperity is the only
means of providing the public services that socialists
are so fond of claiming they prize.
Table 1: 20th Century mass murderers
Dictator Ideology Country Years Deaths Caused
Joseph Stalin Socialist/Communist USSR 1929-53 42.7 million
Mao Zedong Socialist/Communist China 1923-76 37.8 million
Vladimir Lenin Socialist/Communist USSR 1917-24 4 million
Pol Pot Socialist/Communist Cambodia 1968-87 2.4 million
Josip Broz Tito Socialist/Communist Yugoslavia 1941-87 1.2 million
Socialist/Communist Total - - 1900-1990 88.1 million
Adolf Hitler Fascist Germany 1933-45 20.9 million
Chiang Kai-shek Militarist/Fascist China 1921-48 10.2 million
Tojo Hideki Militarist/Fascist Japan 1941-45 4 million
Fascist & Militarist/Fascist total - - 1900-1990 35.1 million
Source: Rummel ‘Death by Government’ pp. 8. Note: Estimated figures vary significantly across sources
10EMBARGOED UNTIL 11.59PM, WEDNESDAY 20 JUNE 2018
Conclusion
The findings of the CIS/YouGov Galaxy opinion poll Such trends are also evident internationally, and are
give a telling insight into the attitudes of Australian part of a clear shift in the polarity of young voters.
Millennials. While a strong majority expressing a Historically, the youth vote has generally correlated
favourable opinion towards socialism hardly means with the overall sentiment of the electorate. However,
the country is on the verge of a class revolution, the as Millennials have come to consist of the majority
trend may have a significant effect as Millennials move of the youth contingent, younger voters have moved
significantly towards the political left.
into positions of power in coming years.
To address the growing sympathy towards
Importantly, beliefs about government spending
socialism, it is essential to educate Millennials
and the nature of capitalism could have major policy
and future generations on the 20th century’s failed
implications. As has been demonstrated, the influence
experimentation with the ideology. For a variety of
of Millennials has grown in direct correlation with reasons, youth are far less aware of socialism’s role in
the electorate’s increased favourability for more some of the greatest catastrophes in human history
intervention in the economy, and support for a rise in and have begun to view it benignly. This is no minor
the nation’s social services bill. Issues such as house problem: one day such people may exercise a vote to
prices and low wage growth will only increase the calls impose such appalling doctrines, and their collateral
for change. damage, on our society.
1112
Appendix A
Table 1 - Overall view of socialism
Gender Birth Year Education State Area
Total Male Female 1980-85 1986-90 1991-96 No Tafe or University NSW VIC QLD SA WA Urban Regional
Tertiary Technical
Subtotal unfavourable 18.00% 21.00% 16.00% 22.00% 17.00% 15.00% 14.00% 18.00% 21.00% 19.00% 18.00% 19.00% 22.00% 15.00% 18.00% 19.00%
Mostly unfavourable 6.00% 7.00% 5.00% 7.00% 6.00% 5.00% 4.00% 6.00% 7.00% 6.00% 6.00% 8.00% 9.00% 4.00% 6.00% 6.00%
Somewhat unfavourable 12.00% 13.00% 11.00% 16.00% 11.00% 10.00% 10.00% 12.00% 14.00% 13.00% 12.00% 12.00% 13.00% 12.00% 12.00% 13.00%
Subtotal favourable 58.00% 62.00% 54.00% 51.00% 58.00% 64.00% 56.00% 52.00% 63.00% 63.00% 54.00% 58.00% 56.00% 56.00% 60.00% 54.00%
Somewhat favourable 41.00% 42.00% 41.00% 38.00% 40.00% 46.00% 41.00% 40.00% 43.00% 47.00% 35.00% 48.00% 40.00% 38.00% 42.00% 41.00%
Mostly favourable 16.00% 20.00% 13.00% 13.00% 18.00% 18.00% 15.00% 12.00% 20.00% 16.00% 18.00% 12.00% 16.00% 18.00% 18.00% 13.00%
Don’t Know 24.00% 30.00% 30.00% 27.00% 25.00% 21.00% 30.00% 30.00% 17.00% 18.00% 29.00% 23.00% 22.00% 28.00% 22.00% 27.00%
Table 2 - Ordinary workers in Australia are worse off now than they were forty years ago
Gender Birth Year Education State Area
Total Male Female 1980-85 1986-90 1991-96 No Tafe or University NSW VIC QLD SA WA Urban Regional
Tertiary Technical
Agree 62.00% 59.00% 64.00% 61.00% 60.00% 64.00% 67.00% 60.00% 61.00% 69.00% 60.00% 56.00% 67.00% 53.00% 62.00% 63.00%
Disagree 32.00% 34.00% 29.00% 32.00% 33.00% 30.00% 26.00% 33.00% 34.00% 27.00% 30.00% 35.00% 29.00% 43.00% 32.00% 30.00%
Don’t Know 6.00% 7.00% 6.00% 6.00% 7.00% 6.00% 7.00% 8.00% 5.00% 4.00% 10.00% 9.00% 4.00% 4.00% 6.00% 7.00%
Table 3 - Allowing for inflation, Australia spends less on education and health than we did ten years ago
Gender Birth Year Education State Area
Total Male Female 1980-85 1986-90 1991-96 No Tafe or University NSW VIC QLD SA WA Urban Regional
Tertiary Technical
Agree 56.00% 57.00% 55.00% 57.00% 59.00% 53.00% 60.00% 56.00% 55.00% 59.00% 53.00% 56.00% 59.00% 53.00% 55.00% 61.00%
Disagree 30.00% 30.00% 29.00% 26.00% 27.00% 36.00% 26.00% 26.00% 34.00% 28.00% 31.00% 31.00% 24.00% 36.00% 32.00% 25.00%
Don’t Know 14.00% 12.00% 15.00% 17.00% 14.00% 11.00% 14.00% 18.00% 11.00% 12.00% 17.00% 13.00% 17.00% 11.00% 13.00% 15.00%
Table 4 - Capitalism has failed and government should exercise more control of the economy
Gender Birth Year Education State Area
Total Male Female 1980-85 1986-90 1991-96 No Tafe or University NSW VIC QLD SA WA Urban Regional
Tertiary Technical
Agree 59.00% 60.00% 57.00% 57.00% 61.00% 59.00% 63.00% 59.00% 57.00% 62.00% 54.00% 58.00% 65.00% 53.00% 56.00% 64.00%
EMBARGOED UNTIL 11.59PM, WEDNESDAY 20 JUNE 2018
Disagree 25.00% 28.00% 23.00% 25.00% 23.00% 28.00% 18.00% 20.00% 33.00% 25.00% 27.00% 28.00% 21.00% 29.00% 26.00% 19.00%
Don’t Know 16.00% 12.00% 20.00% 18.00% 16.00% 14.00% 19.00% 22.00% 11.00% 14.00% 19.00% 15.00% 15.00% 18.00% 16.00% 17.00%Table 5 - Level of familiarity with people
Mao Zedong Joseph Stalin Adolf Hitler Vladimir Lenin
I’m familiar with them 21.00% 34.00% 73.00% 26.00%
I know them but not familiar 28.00% 34.00% 21.00% 32.00%
I don’t know them 51.00% 32.00% 5.00% 42.00%
Table 6 - Level of familiarity with people - Mao Zedong
Gender Birth Year Education State Area
Total Male Female 1980-85 1986-90 1991-96 No Tafe or University NSW VIC QLD SA WA Urban Regional
Tertiary Technical
I’m familiar with them 21.00% 28.00% 14.00% 21.00% 21.00% 22.00% 13.00% 13.00% 30.00% 25.00% 24.00% 18.00% 13.00% 16.00% 25.00% 14.00%
I know them but not familiar 28.00% 31.00% 25.00% 28.00% 28.00% 28.00% 20.00% 26.00% 34.00% 30.00% 33.00% 28.00% 31.00% 35.00% 30.00% 23.00%
I don’t know them 51.00% 41.00% 60.00% 51.00% 51.00% 49.00% 67.00% 61.00% 36.00% 45.00% 54.00% 54.00% 56.00% 48.00% 45.00% 63.00%
Table 7 - Level of familiarity with people - Joseph Stalin
Gender Birth Year Education State Area
Total Male Female 1980-85 1986-90 1991-96 No Tafe or University NSW VIC QLD SA WA Urban Regional
Tertiary Technical
I’m familiar with them 34.00% 42.00% 27.00% 36.00% 32.00% 36.00% 27.00% 29.00% 42.00% 33.00% 33.00% 38.00% 34.00% 40.00% 37.00% 29.00%
I know them but not familiar 34.00% 34.00% 33.00% 33.00% 34.00% 34.00% 28.00% 33.00% 37.00% 35.00% 33.00% 30.00% 38.00% 36.00% 36.00% 27.00%
I don’t know them 32.00% 25.00% 39.00% 32.00% 35.00% 30.00% 45.00% 38.00% 21.00% 32.00% 34.00% 32.00% 28.00% 24.00% 27.00% 44.00%
Table 8 - Level of familiarity with people - Adolf Hitler
Gender Birth Year Education State Area
Total Male Female 1980-85 1986-90 1991-96 No Tafe or University NSW VIC QLD SA WA Urban Regional
Tertiary Technical
I’m familiar with them 73.00% 73.00% 73.00% 72.00% 73.00% 75.00% 69.00% 78.00% 73.00% 70.00% 71.00% 75.00% 75.00% 82.00% 72.00% 75.00%
I know them but not familiar 21.00% 21.00% 22.00% 23.00% 21.00% 20.00% 22.00% 18.00% 23.00% 26.00% 21.00% 19.00% 21.00% 14.00% 22.00% 20.00%
I don’t know them 5.00% 6.00% 5.00% 5.00% 6.00% 5.00% 8.00% 4.00% 4.00% 4.00% 8.00% 6.00% 4.00% 4.00% 6.00% 4.00%
Table 9 - Level of familiarity with people - Vladimir Lenin
Gender Birth Year Education State Area
Total Male Female 1980-85 1986-90 1991-96 No Tafe or University NSW VIC QLD SA WA Urban Regional
Tertiary Technical
EMBARGOED UNTIL 11.59PM, WEDNESDAY 20 JUNE 2018
I’m familiar with them 26.00% 32.00% 20.00% 31.00% 22.00% 25.00% 17.00% 22.00% 34.00% 29.00% 26.00% 23.00% 25.00% 28.00% 29.00% 19.00%
I know them but not familiar 32.00% 32.00% 32.00% 34.00% 31.00% 31.00% 29.00% 30.00% 35.00% 32.00% 31.00% 33.00% 38.00% 34.00% 34.00% 28.00%
I don’t know them 42.00% 36.00% 48.00% 35.00% 47.00% 44.00% 54.00% 48.00% 32.00% 39.00% 43.00% 45.00% 37.00% 39.00% 37.00% 53.00%
13EMBARGOED UNTIL 11.59PM, WEDNESDAY 20 JUNE 2018
Endnotes
1 Pipes, Richard. Communism: A History. Random sep/27/jeremy-corbyn-promises-rent-controls-
House Publishing Group, 2001, pp. 158 and-clampdown-on-gentrification (Accessed 1 June
2018)
2 Tang, Edmund. Australia Has Experienced the
Longest Economic Growth among the major 13 Roberts, Carys, and Mathew Lawrence. Wealth in
developed world. Austrade, 29 March 2017. the Twenty-First Century: Inequalities and Drivers.
https://www.austrade.gov.au/News/Economic- Institution for Public Policy Research, October
analysis/australia-has-experienced-the-longest- 2017, pp. 9
economic-growth-among-major-developed-world
14 Sayers, Freddie. ‘Berners’ and ‘Corbynistas’:
(Accessed 31 May 2018)
New Coalitions of the Left. YouGov, February
3 2016 ABS Census Data 15, 2016. Available at: https://yougov.co.uk/
news/2016/02/15/berners-and-corybnistas-new-
4 Manpower Group. Millennial Careers: 2020 Vision.
coalitions-left/ (Accessed 1 June 2018)
Manpower Group, 2016, pp. 3
15 Graham, Matthew Moore and Sarah. Champagne
5 Carl, Noah. Why Do Academics Lean Left?. Adam
Socialists ‘Not as Left Wing as They Think They
Smith Institute, 2017, pp. 1
Are. The Telegraph, 14 July 2010. Available at:
6 Hugo, Graeme. What Is Happening in Rural https://www.telegraph.co.uk/news/newstopics/
and Regional Populations?. The Regional howaboutthat/7887888/Champagne-socialists-not-
Institute, 2012. http://www.regional.org.au/au/ as-left-wing-as-they-think-they-are.html (Accessed
countrytowns/keynote/hugo.htm#P1974_43191 31 May 2018)
(Accessed 31 May 2018)
16 Parker, George. Conservatives Secure Stunning
7 Angus, Chris. NSW Economic Update Summer Victory. Financial Times, 7 May 2015. Available at:
2018. NSW Parliamentary Research Service, https://www.ft.com/content/7ec06b42-f4f1-11e4-
January 2018, pp. 2 & CommSec. State of abb5-00144feab7de (Accessed 31 May 2018)
the States - Overview of NSW April 2018.
17 Rudgard, Olivia, and Ashley Kirk. Youthquake Is
Commonwealth Bank, 2018, Available at:
2017’s Word of the Year after Jeremy Corbyn’s
https://www.commsec.com.au/content/dam/EN/
Election Campaign. The Telegraph, 15 December
Campaigns_Native/stateofstates/April2018/NSW_
2017. Available at: https://www.telegraph.co.uk/
State_of_the_States_April2018.pdf (Accessed 1
news/2017/12/15/youthquake-2017s-word-year-
June 2018), pp. 1
jeremy-corbyns-election-campaign/ (Accessed 1
8 Trading Economics. Australia Disposable Personal June 2018)
Income | 1959-2018. Available at: https://
18 School of Politics and International Relations, and
tradingeconomics.com/australia/disposable-
ANU College of Arts & Social Sciences. Trends
personal-income (Accessed 5 June 2018)
in Australian Political Opinon: Results from the
9 Australian Institute of Health and Welfare. Australian Election Study 1987-2016. Australian
Health Expenditure Australia 2007-08. Australian National University, 2018, pp. 65
Government, 2009, pp. 21
19 Dikötter, Frank. Mao’s Great Famine: The History
10 Australian Institute of Health and Welfare. of China’s Most Devastating Catastrophe, 1958-62.
Health Expenditure Australia 2015-16. Australian Bloomsbury Publishing, 2010, pp. 333
Government, 2017, pp. vii
20 Rummel, R. J. Death by Government: Genocide
11 Productivity Commission. National Education and Mass Murder Since 1900. Routledge, 2018,
Evidence Base (Draft Report). Australian pp. 8
Government, 2016, pp. 23
21 Bartholomew, James. Britain Needs a Museum
12 Asthana, Anushka, Jessica Elgot, and Rowena of Communist Terror. The Spectator, 5 March
Mason. Jeremy Corbyn: Neoliberalism Is Broken 2016. Available at: https://www.spectator.
and We Are Now the Centre Ground. The co.uk/2016/03/britain-needs-a-museum-of-
Guardian, September 27, 2017, Available at: communist-terror/ (Accessed 30 May 2018)
http://www.theguardian.com/politics/2017/
14EMBARGOED UNTIL 11.59PM, WEDNESDAY 20 JUNE 2018
Opinion Polling on Australian Expenditure
Parliament of Australia. Twenty Years of Opinion Polling. Available at: https://www.aph.gov.au/About_Parliament/
Parliamentary_Departments/Parliamentary_Library/pubs/rp/rp0304/04rp13 (Accessed 30 May 2018)
ABC. Spending Public Money: How Do Your Views Stack Up?. ABC News, 24 October 2016. Available at: http://
www.abc.net.au/news/2016-10-24/australian-public-expenditure-anu-poll/7959486 (Accessed 30 May 2018)
YouGov United States Survey
Jordan, William. Democrats More Divided on Socialism. YouGov, 28 January 2016. Available at: https://today.
yougov.com/topics/politics/articles-reports/2016/01/28/democrats-remain-divided-socialism (Accessed 30 May
2018)
YouGov United Kingdom Survey
Dahlgreen, Will. British People Keener on Socialism than Capitalism. YouGov, February 23, 2016. Available at:
https://yougov.co.uk/news/2016/02/23/british-people-view-socialism-more-favourably-capi/. (Accessed 31 May
2018)
15About the Authors
Tom Switzer
Tom Switzer is the Executive Director at the CIS. He is a former senior fellow at the
University of Sydney’s United States Studies Centre (2009-17), a former editor of
the Spectator Australia (2009-14), senior federal Liberal leader adviser/speech writer
(2008), opinion editor of The Australian, (2001-08), editorial writer at the Australian
Financial Review (1998-01) and assistant editor at the American Enterprise Institute in
Washington, DC (1995-98). He has written for the likes of the Wall Street Journal, New
York Times, Washington Post, The Spectator and Financial Times. He has also appeared
on CNN, CNBC, Bloomberg, Al Jazeera, Sky News, SBS, Seven, Nine, Ten and ABC radio
and television. He hosts Between the Lines on ABC’s Radio National.
Charles Jacobs
Charles Jacobs is a Policy Analyst at the CIS. His research on the Commonwealth
Indigenous Procurement Policy has seen him consulted by the NSW State Government
and Canadian Defence Force on the development of their own minority set-aside
policies. He has also written on the topic for likes of the Australian Financial Review,
ABC Online and Spectator Flat White and commented on policy issues for stations such
as ABC Radio, National Indigenous Radio Service and Radio National. Charles also
works as a Statistician for Fox Sports Australia.
POLICY Paper 7 (PP7) • ISSN: 2209-2447 • ISBN: 978-1-925744-23-1
Published June 2018 by The Centre for Independent Studies Limited. Views expressed are
those of the authors and do not necessarily reflect the views of the Centre’s staff, advisors,
directors or officers.
© The Centre for Independent Studies (ABN 15 001 495 012)
This publication is available from The Centre for Independent Studies. Visit www.cis.org.au.
Level 1, 131 Macquarie St, Sydney NSW 2000 • phone: +61 2 9438 4377 • fax: +61 2 9439 7310 • email: cis@cis.org.auYou can also read