Modeling freshwater quality scenarios with ecosystem-based adaptation in the headwaters of the Cantareira system, Brazil - HESS
←
→
Page content transcription
If your browser does not render page correctly, please read the page content below
Hydrol. Earth Syst. Sci., 22, 4699–4723, 2018
https://doi.org/10.5194/hess-22-4699-2018
© Author(s) 2018. This work is distributed under
the Creative Commons Attribution 4.0 License.

Modeling freshwater quality scenarios with ecosystem-based
adaptation in the headwaters of the Cantareira system, Brazil
Denise Taffarello1 , Raghavan Srinivasan2 , Guilherme Samprogna Mohor1,3 , João Luis Bittencourt Guimarães4 ,
Maria do Carmo Calijuri1 , and Eduardo Mario Mendiondo1
1 São  Carlos School of Engineering, University of São Paulo, São Carlos, SP, 13566-590, Brazil
2 Spatial Science Laboratory, Ecosystem Science and Management Department, Texas A&M University,
College Station, TX 77801, USA
3 Institute of Earth and Environmental Science, University of Potsdam, Karl-Liebknecht-Str. 24–25,

14476 Potsdam, Germany
4 Aquaflora Meio Ambiente, Curitiba, PR, 82100-310, Brazil

Correspondence: Denise Taffarello (taffarellod@gmail.com, dt@sc.usp.br)

Received: 1 August 2017 – Discussion started: 21 August 2017
Revised: 17 March 2018 – Accepted: 19 April 2018 – Published: 7 September 2018

Abstract. Although hydrologic models provide hypothesis          pollution levels (WPL) for reference catchments, related to
testing of complex dynamics occurring at catchments, fresh-      the grey water footprint (greyWF) and water yield. On the
water quality modeling is still incipient at many subtrop-       one hand, water quality simulations allowed for the region-
ical headwaters. In Brazil, a few modeling studies assess        alization of greyWF at spatial scales under LULC scenarios.
freshwater nutrients, limiting policies on hydrologic ecosys-    According to the critical threshold, HSI identified areas as
tem services. This paper aims to compare freshwater quality      less or more sustainable catchments. On the other hand, con-
scenarios under different land-use and land-cover (LULC)         servation practices simulated through the S2 + EbA scenario
change, one of them related to ecosystem-based adaptation        envisaged not only additional and viable best management
(EbA), in Brazilian headwaters. Using the spatially semi-        practices (BMP), but also preventive decision-making at the
distributed Soil and Water Assessment Tool (SWAT) model,         headwaters of water supply systems.
nitrate, total phosphorous (TP) and sediment were modeled
in catchments ranging from 7.2 to 1037 km2 . These headwa-
ters were eligible areas of the Brazilian payment for ecosys-
tem services (PES) projects in the Cantareira water supply       1   Introduction
system, which had supplied water to 9 million people in
the São Paulo metropolitan region (SPMR). We considered          Basin plans comprise the main management tool and they
SWAT modeling of three LULC scenarios: (i) recent past           plan sustainable use of water resources in both spatial and
scenario (S1), with historical LULC in 1990; (ii) current        temporal scales. For sustainable water allocation, river plans
land-use scenario (S2), with LULC for the period 2010–2015       are based on accurate data on actual water availability per
with field validation; and (iii) future land-use scenario with   basin, taking into account water needs for humans, envi-
PES (S2 + EbA). This latter scenario proposed forest cover       ronmental water requirements and the basin’s ability to as-
restoration through EbA following the river basin plan by        similate pollution (Mekonnen et al., 2015). However, adap-
2035. These three LULC scenarios were tested with a se-          tive management options such as ecosystem-based adapta-
lected record of rainfall and evapotranspiration observed in     tion (EbA; see CBD, 2010; BFN/GIZ, 2013) and the wa-
2006–2014, with the occurrence of extreme droughts. To as-       ter footprint (WF) (Hoekstra and Chapagain, 2008; Hoek-
sess hydrologic services, we proposed the hydrologic service     stra and Mekonnen, 2012) have rarely been incorporated into
index (HSI), as a new composite metric comparing water           Brazilian basin plans. Moreover, integrated qualitative and
                                                                 quantitative simulations and indicators of human appropria-

Published by Copernicus Publications on behalf of the European Geosciences Union.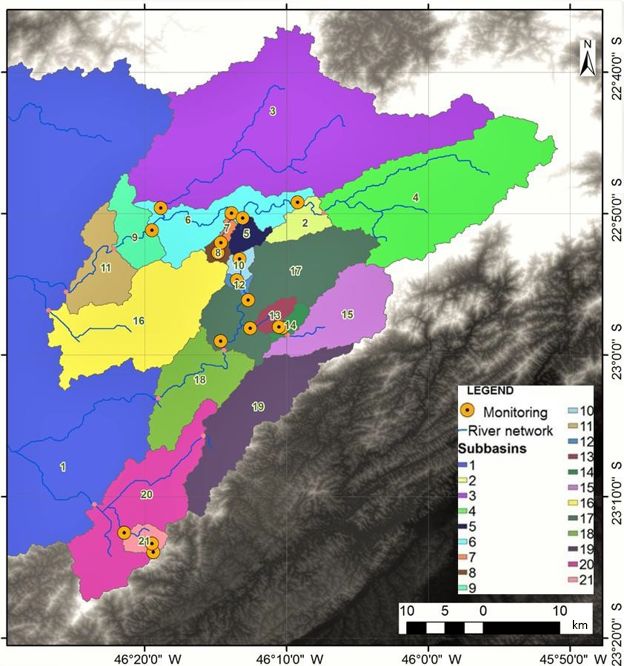
4700               D. Taffarello et al.: Modeling freshwater quality scenarios with EbA in the Cantareira system, Brazil

tion of freshwater resources are seldom used in river plans.      affects the supporting1 and regulating2 ecosystem services
The concept of ecosystem-based adaptation is addressed as         (Mulder et al., 2015; MEA, 2005) and needs to be monitored
“using biodiversity and ecosystem services to help people         for adaptive and equitable management on the river basin
adapt to the adverse effects of climate change”, which was        scale (Taffarello et al., 2016a, b). In spite of discussions re-
defined by the Convention on Biological Diversity – 10th          garding the lack of representativeness of data used in early
Conference of the Parties (CoP) (CBD, 2010). Detailed def-        studies with greyWF (Wichelns, 2015; Zhang et al., 2010;
initions of EbA applied to the Cantareira system’s head-          Aldaya et al., 2010; Aldaya and Llamas, 2008), we argue
waters can be found in Taffarello et al. (2017). The WF           that the greyWF method may account for hydrologic services
is still an environmental indicator used in watershed plans.      and provide a multidisciplinary, qualitative-quantitative inte-
For example, Spain uses WF as an indicator in basin plans         grated and transparent framework for better water policy de-
(Hoekstra, 2017; Velázquez et al., 2011; Aldaya et al., 2010).    cisions. Understanding these catchment-scale ecohydrologic
The clean water plan of Vancouver (June 2011) established         processes requires not only low-frequency sampling, but also
the reduction of the WF as a sustainable action in its wa-        automated, in situ high-frequency monitoring (Bieroza et al.,
ter resources management (MetroVancouver, 2011; Zubrycki          2014; Halliday et al., 2012), as well as using ecohydrologic
et al., 2011). The Colombian government was the first to          modeling to protect water quality and quantity. However,
publish a complete and multi-sectorial evaluation of WF in        freshwater quality modeling associated with EbA, greyWF
its territory. Although this study, titled Estudio Nacional del   and LULC is still incipient in many river catchments. In
Agua (Colombia, Instituto de Hidrología, Meteorología y Es-       Brazil, approximately only 5 % of modeling studies evaluate
tudios Ambientales, 2014), was not included in the national       nutrients in freshwater (Bressiani et al., 2015), which limits
water management plan, the strategic plan of the Magdalena–       the policies on regulating ecosystem services.
Cauca basin incorporates the grey water footprint (greyWF)           In this research, we propose that the regulating ecosystem
to assess agriculture pollution (Colombia, 2014). In Brazil,      services be addressed by the greyWF because it considers
a glossary of terms released by the Brazilian National Water      the water volume for self-purification of receiving water bod-
Agency (ANA, 2015) includes the concept of WF to support          ies affected by pollutants (Zhang et al., 2010). The working
water resources management.                                       hypothesis of the paper is related to how conservation prac-
   The WF (Mekonnen and Hoekstra, 2015; Hoekstra et al.,          tices addressed by EbA impact hydrology and the ecosystem
2011) measures both the direct and indirect water use within      services, such as maintaining, restoring or improving both
a river basin. The term water use refers to water withdrawal,     the water yield and the freshwater quality, using ecohydro-
as the consumptive use of rainwater (the green water foot-        logic modeling in different catchment scales. On the other
print) and of surface and groundwater (the blue water foot-       hand, we hypothesized that incentives of EbA policies can
print), and water pollution, i.e., the flow of water used to      affect water yield and water quality through nonlinear trade-
assimilate the pollutant loads (the grey water footprint; see     offs, with high spatiotemporal complexity, which can be as-
Chapagain et al., 2006). Given that water pollution can be        sessed by modeling, but previously supported by in situ mon-
considered a non-consumptive water use, the greyWF is ad-         itoring variables for setup boundary conditions of simulation
vantageous by quantifying the effects of pollution by flow        runs. In these scales, the greyWF can evaluate the changes
instead of by concentration, making water demand and avail-       in the regulating hydrologic services. Among the three wa-
ability comparable.                                               ter footprint components, in this study we assessed greyWF
   Water footprint assessment comprises four phases: (1) set-     for nitrate, total phosphorous (TP) and sediments in 20 sub-
ting goals, (2) accounting, (3) sustainability assessment and     basins in the headwaters of the Cantareira water supply sys-
(4) response formulation. At the WF response formulation          tem. Thus, the aim of this study is to compare freshwater
phase, the EbA options, represented by best management            quality scenarios, one of them related to EbA options through
practices (BMP) at the catchment scale, could represent           BMP, and to assess greyWF under different LULC changes:
a tradeoff on greyWF (Zaffani et al., 2011). That is, BMP         (S1) historic LULC of 1990, (S2) current LULC for the pe-
adopted in the catchment scale could contribute indirectly to     riod 2010–2015, and (S2 + EbA) future LULC based on EbA
decreasing the level of water pollution. Thus, the EbA would      with S2 as a baseline. This method is addressed using nested
compensate for the greyWF of a certain river basin (Taf-          catchment experiments (NCE, see Taffarello et al., 2016a,
farello and Mendiondo, 2011). In the context of water secu-       b) at a range of scales from small catchments of 7.7 km2 to
rity associated with land-use and land-cover (LULC) change,       medium-size basins of 1200 km2 at subtropical headwaters
many existing conflicts over water use could be prevented
(Winemiller et al., 2016; Aldaya et al., 2010; Oki and Kanae,
2006). For example, LULC influences water quality, which             1 Examples of supporting services: nutrient cycling, primary pro-
                                                                  duction and soil formation.
                                                                     2 Examples of regulating services: self-depuration of pollutants,
                                                                  climate regulation, erosion control, flood attenuation and water
                                                                  borne diseases.

Hydrol. Earth Syst. Sci., 22, 4699–4723, 2018                                    www.hydrol-earth-syst-sci.net/22/4699/2018/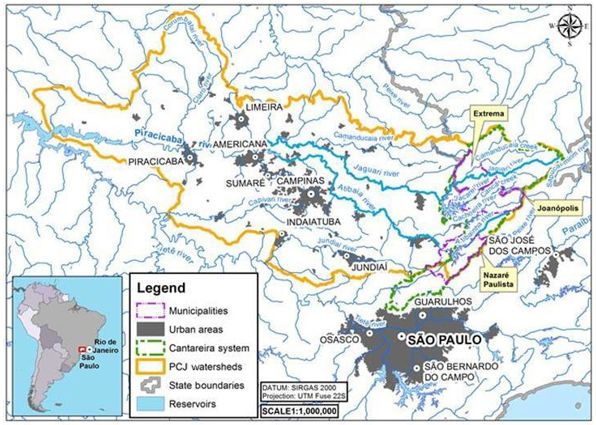
D. Taffarello et al.: Modeling freshwater quality scenarios with EbA in the Cantareira system, Brazil                     4701

responsible for the water supply of the São Paulo metropoli-      and Porto, 2014). As a result of this serious water crisis,
tan region (SPMR).                                                a new water policy on the average flow of the transfer lim-
   Therefore, this paper consists of four sections. The first     its of the Piracicaba watershed to the upper Tietê watershed
section provides a brief description of the context, gap, hy-     was postponed from 2014 to May 2017 (ANA, 2015). The
pothesis and our research goals. The second section describes     Cantareira system is located in the Atlantic Forest biome,
the simulation methods used in the watershed scale and the        which is considered a conservation hotspot because of its
development of three LULC scenarios. We then propose              rich biodiversity. In spite of that, 78 % of the original for-
some ecosystem-based adaptation approaches related to wa-         est cover of the Cantareira watershed has been deforested
ter pollution. Finally, in the fourth section, we discuss how     over the past 30 years (Zuffo, 2015). In 2014, the native
the grey water footprint for nitrate or total phosphorous could   forest cover was 10 % in Extrema, 12 % in Joanópolis and
be an EbA option for improving decision-making and water          21 % in Nazaré Paulista (SOS Mata Atlântica/INPE, 2015).
security in subtropical catchments under change.                  To counteract deforestation, some environmental and finan-
                                                                  cial tradeoffs have been developed in the Cantareira headwa-
                                                                  ters to protect downstream water quality and the regulation
2     Material and methods                                        of water flows. These are ecosystem-based adaptation ini-
                                                                  tiatives, in which rural landowners receive economic incen-
2.1    The case study area                                        tives to conserve and/or restore riparian forests and imple-
                                                                  ment soil conservation practices. The first Brazilian EbA ap-
Two of the most vulnerable areas in the Brazilian southeast       proach was the Water Conservator (Conservador das Águas)
are the upper Tietê (drainage area 7390 km2 ) and Piracicaba–     project, created in 2005 and implemented in Extrema, Minas
Capivari–Jundiaí (PCJ ;drainage area 14 178 km2 ) water-          Gerais (Richards et al., 2015, 2017; Pereira, 2013). The Wa-
sheds, particularly due to their high population: 18 million      ter Producer/PCJ project was developed from 2009 to 2014
inhabitants in the upper Tietê River basin and 5 million in       in the Cantareira system region (Guimarães et al., 2015), us-
PCJ (Sao Paulo, 2017; IBGE, 2010). In an attempt to en-           ing EbA scenarios and local actions adopting the concept of
sure public water supply, the government built the Cantareira     payment for hydrological ecosystem services (Pagiola et al.,
system, an inter-basin transfer, in two stages: (a) between       2013; Padovezi et al., 2013) through public–private partner-
1968 and 1974, at the end of a 35-year period that under-         ships, strengthening EbA in Brazil.
went a severe drought in the Piracicaba watershed; and (b) in
1982, with the inclusion of two additional reservoirs that        2.2   Databases and model adopted
regularized the increasing rainfall from the mid-1970s un-
til 2005 (Zuffo, 2015). The study area comprises the part of      Figure 2 shows the method developed and applied to assess
the Cantareira system that drains into the Piracicaba River       the regulating hydrologic services through grey WF, as well
and which is the headwater of the Piracicaba basin (Fig. 1).      as the spatial data used in this study. The simulations were
This basin is located on the borderline of the state of Minas     enhanced by model parameterization with qualitative and
Gerais and São Paulo. This part of the water supply system,       quantitative primary data (Mohor et al., 2015a, b; Taffarello
in the Piracicaba watershed, consists of three main reservoirs,   et al., 2016b) from six field campaigns between 2012 and
named after the rivers, damming the Jaguari–Jacareí, Ati-         2014, in partnership with ANA, CPRM, TNC-Brazil, WWF,
bainha and Cachoeira watersheds (drainage areas are 1230,         USP/EESC and municipalities. This can reduce uncertainties
392 and 312 km2 , respectively). These rivers are main trib-      of the model, facilitate data interpretation and provide con-
utaries of the Piracicaba River, which is a tributary of the      sistent information. We installed three data collection plat-
Tietê River system on the left bank of the Paraná Basin.          forms (DCP) in catchments at Posses, Cancã and Moinho, as
The Cantareira system consists of two more reservoirs out of      well as level and pressure sensors (see Table 1 and Fig. 8)
the Piracicaba River basin, Paiva Castro and Águas Claras,        in paired sub-basins (i) with high original vegetation cover
which are not part of our study area.                             and (ii) in basins that receive payment for ecosystem services
    With respect to the water quality, the headwaters of the      (PES) due to participating in the Water Producer/PCJ project.
Cantareira system are classified as class 1 (best quality) for       We obtained and organized secondary data from the re-
the Jacareí, Cachoeira and Atibainha watersheds and class 2       gion upstream of the Jaguari–Jacareí, Cachoeira and Ati-
for the Jaguari watershed, according to the CONAMA Res-           bainha reservoirs. We then set up a database originating from
olution no. 357/2005 (Brazil, 2005) and São Paulo Decree          several sources: Hidroweb (ANA, 2014), Water Sanitation
no. 8468/1976 (Sao Paulo, 1976), which means that, with           Company of the State of São Paulo (SABESP), Integrated
the exception of the Jaguari watershed, the others can be         Center for Agrometeorology Information (CIIAGRO, 2014),
used for supply with only a simple treatment. Regarding           Department of Water and Power (DAEE), National Institute
the water volume, this region has been intensely impacted         of Meteorology (INMET) and the Center for Weather Fore-
by a severe and recent drought (Taffarello et al., 2016a; Es-     casts and Climate Studies (CPTEC/INPE). Supplement Ta-
cobar, 2015; Whately and Lerer, 2015; ANA, 2015; Porto            ble S1 summarizes all hydrologic, pedological, meteorolog-

www.hydrol-earth-syst-sci.net/22/4699/2018/                                    Hydrol. Earth Syst. Sci., 22, 4699–4723, 2018
4702                D. Taffarello et al.: Modeling freshwater quality scenarios with EbA in the Cantareira system, Brazil

Figure 1. Location of the Cantareira water supply system in the Piracicaba and upper Tietê watersheds.

Figure 2. Methodological scheme for assessing hydrologic services based on greyWF.

ical and land-use data used as input for the delineation and           of important variables for ecosystem services analysis and
characterization of the watersheds. The topographical data             decision-making. Some examples of ecohydrologic models
used was the digital elevation model ASTER Global DEM,                 with progressive applications in Brazilian basins are the Soil
second version, 30 m (Tachikawa et al., 2011), available free          and Water Assessment Tool (SWAT; Bremer et al., 2016;
of charge at http://gdex.cr.usgs.gov/gdex/ (last access: 9 Au-         Francesconi et al., 2016; Bressiani et al., 2015), the models
gust 2015). The changes in hydrologic services can be eval-            reviewed by de Mello et al. (2016), Integrated Valuation of
uated by a large number of models (Carvalho-Santos et al.,             Ecosystem Services and Tradeoffs (InVEST) (Sharp, 2016)
2016; Duku et al., 2015; Quilbé and Rousseau, 2007), espe-             and Resource Investment Optimization System (RIOS) (Vogl
cially those more user-friendly for stakeholders and policy            et al., 2016).
makers. Simulations in this watershed-scale ecohydrologic                 The Texas A&M University Soil and Water Assess-
model (Borah and Bera, 2004) allow for the quantification              ment Tool (SWAT-TAMU; Arnold et al., 1998; Arnold and

Hydrol. Earth Syst. Sci., 22, 4699–4723, 2018                                         www.hydrol-earth-syst-sci.net/22/4699/2018/
D. Taffarello et al.: Modeling freshwater quality scenarios with EbA in the Cantareira system, Brazil                                                4703

Table 1. Sub-basins delimited in SWAT with drainage areas and geographic locations.

                  SWAT            Gauge station                  Field               Modeling           Drainage             Coordinates
                  sub-basin                                      observations        LULC/EbA                 area
                                                                 (2013–2014)         scenarios              (km2 )             Lat            Long
                  1               Alto Jaguari                   Yes                 Yes                    302.2       −22.820        −46.154
                  2               F23 basin                      Yes                 Yes                    508.1       −22.827        −46.314
                  3               F28 basin                      Yes                 Yes                    276.8       −22.806        −45.989
                  4               Salto basin                    Yes                 Yes                     15.0       −22.838        −46.218
                  5               Parque de Eventos              Yes                 Yes                    926.5       −22.853        −46.325
                  6               Posses Exuta                   Yes                 Yes                     11.9       −22.833        −46.231
                  7               Portal das Estrelas            Yes                 Yes                      7.1       −22.820        −46.244
                  8               F25 basin                      Yes                 Yes                    971.9       −22.850        −46.346
                  9               Domithildesb                   Yes                 Yes                      9.9       −22.886        −46.222
                  10              Jaguari basin                  No                  Yes                   1037.0       −22.896        −46.385
                  11              F30a                           Yes                 Yes                     15.1       −22.935        −46.212
                  12              Ponte Cachoeira.               Yes                 Yes                    121.0       −22.967        −46.171
                  13              Chalé Ponto Verde              Yes                 Yes                    107.9       −22.964        −46.181
                  14              Cachoeira dos Pretos           Yes                 Yes                    101.2       −22.968        −46.171
                  15              Jacareí basin                  No                  Yes                    200.5       −22.959        −46.341
                  16              F24                            Yes                 Yes                    293.5       −22.983        −46.244
                  17              Cachoeira basin                Yes                 Yes                    391.7       −46.209        −46.276
                  18              F34 basin                      Yes                 Yes                    129.2       −23.073        −46.209
                  19              Atibainha basin                No                  Yes                    313.8       −23.182        −46.342
                  20              Moinhoa                        Yes                 Yes                     16.9       −23.209        −46.357
                a Indicates new data collection stations installed for experimental monitoring according to ANA/CPRM standards. b Indicates
                experimental stations for research purposes. Source: Taffarello et al. (2016a)

Fohrer, 2005) is a public domain conceptual spatially semi-                          2.3     Model setup
distributed model, widely used in ecohydrologic and/or agri-
cultural studies at a river basin scale (Krysanova and Whyte,
2015; Krysanova and Arnold, 2008). It divides the basin into                         The initial model setup used the ArcSWAT interface, inte-
sub-basins based on an elevation map and the sub-basins are                          grated to ArcGIS 10.0 (Environmental Systems Research In-
further subdivided into hydrologic response units (HRUs).                            stitute). Discretization in sub-basins was carried out, where
Each HRU represents a specific combination of land use,                              possible, at the same NCE sites of field investigations. The
soil type and slope class within the sub-basin. The model                            delimitation of the basin using ArcSWAT requires a drainage
includes climatic, hydrologic, soil, sediments and vegeta-                           area threshold, determined to be 7.1 km2 , dividing the geo-
tion components, transport of nutrients, pesticides, bacte-                          graphical space to represent the 17 sampling sites in the re-
ria, pathogens, BMP and climate change in a river basin                              search field as sub-basins, plus the limits of the three reser-
scale (Raghavan Srinivasan, personal communication, 2014;                            voirs’drainage areas, which resulted in 20 sub-basins (Table 1
GASSMAN et al., 2014; Arnold et al., 2012). There have                               and Fig. 1b). We highlight that the basin was designed up
been at least 2600 published SWAT studies (SWAT Litera-                              to the confluence of the Jaguari and Atibaia rivers, form-
ture Database, mid-2016). In the SWAT Purdue conference,                             ing the Piracicaba River, to integrate all areas of interest in
held in 2015, 118 studies were presented, of which only 8 %                          the same SWAT project. The definition of the HRU was car-
assessed the transport of nutrients in watersheds (SWAT Pur-                         ried out using soil maps of the state of São Paulo. (Oliveira,
due, Book of Abstracts, 2015). Research using SWAT was                               1999) and land-use maps were developed by Molin (2014)
developed not only for quantity but also for water quality and                       and Molin et al. (2015) from Landsat 5 Thematic Mapper
ecosystem service assessments (Francesconi et al., 2016; Ab-                         imagery for 2010, using a 1 : 60 000 scale. The procedure
baspour et al., 2015; Duku et al., 2015; Gassman et al., 2014;                       defined 49 HRUs inside the 20 sub-basins, i.e., 49 different
Fukunaga et al., 2015) and also as an educational tool for                           combinations of soil type, soil cover and slope classes in
comparing hydrologic processes (Rajib et al., 2016).                                 our study area. Next, we adapted the land-use map devel-
                                                                                     oped by Guimarães et al. (2015), which represents a 2010
                                                                                     land-use scenario for the Cantareira system restoring the
                                                                                     most fragile degraded parcels (greatest potential for sedi-
                                                                                     ment production), to agree with the land-use classes of Molin

www.hydrol-earth-syst-sci.net/22/4699/2018/                                                            Hydrol. Earth Syst. Sci., 22, 4699–4723, 2018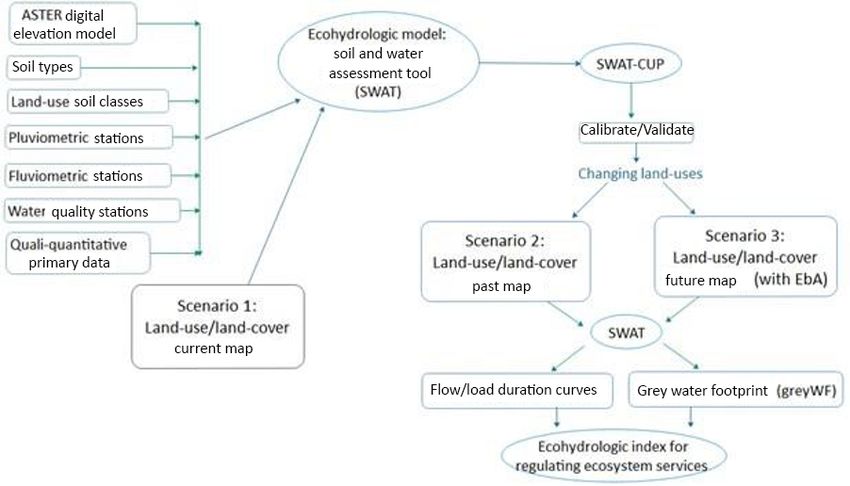
4704                D. Taffarello et al.: Modeling freshwater quality scenarios with EbA in the Cantareira system, Brazil

(2014). Additionally, we assumed that the second scenario          a general rule, if |Pbias| < 10 %, it means a very good fit;
of Guimarães et al. (2015), who used the INVEST model to           10 % < |Pbias| < 15 % means good; 15 % < |Pbias| < 25 %
provide the ecological restoration benefits in the Cantareira      means satisfactory; and |Pbias| > 25 % means the model is
system, could be achieved in year 2035, considering the in-        inappropriate. On the other hand, the NSE coefficient trans-
vestments provided in the PCJ river plan (Cobrape, 2011) to        lates the application efficiency of the model into more ac-
recover riparian forests. It is worth mentioning that, in the      curate predictions of flood flows, using the following clas-
PCJ basin plan, it is called the “trend scenario”. Since in        sifications: NSE > 0.65 the model is rated as very good;
the region the restoration of riparian forests is mostly due to    0.54 < NSE < 0.65 the model is rated as good; and between
Water-PES projects, which was recognized as an ecosystem-          0.5 and 0.54 it is rated as satisfactory.
based adaptation (according to CBD, 2010; BFN/GIZ, 2013;              In the results obtained for different basin scales (Fig. 4),
Taffarello et al., 2017), we identify the third scenario as        the Pbias and NSE coefficients (including NSE of loga-
S2 + EbA. Thus, Fig. 3 shows the land-use changes over             rithms) indicate adequate quantitative adjustments. As the
time. In the trend scenario (PCJ-COBRAPE, 2011), the mu-           SWAT simulations include more than 200 parameters, based
nicipalities covered by the Cantareira system could reach          on research from the literature (Duku et al., 2015; Bressiani
a 98 % collection rate with a sewage treatment rate of 100 %       et al., 2015; Arnold et al., 2012; Garbossa et al., 2011), we se-
and BOD5,20 removal efficiency of 95 % (PCJ-COBRAPE,               lected approximately 10 parameters (see Table 3) to complete
2011). Some studies have suggested including other param-          the calibration to simulate streamflow processes and nutri-
eters such as dissolved oxygen, nitrate and phosphate pol-         ent dynamics. These parameters refer to key processes which
luting loads, as well as sediments to assess the water quality     represent soil water storage, infiltration, evapotranspiration,
(Cunha et al., 2014). Regarding the treatment costs for drink-     flow channel, boundary conditions (see Mohor et al., 2015b)
ing water supply, ecosystem-based adaptation options, such         and main water quality processes at hillslopes. Although our
as watershed restoration, seem to be more cost-effective than      calibration is mainly focused on water yield as total runoff,
many technologies for water treatment (Cunha et al., 2016).        freshwater quality features through pollutant loads were per-
                                                                   formed in the scenarios. Further comments related to the ex-
2.4    Calibration and validation                                  isting literature for selected model parameters are depicted in
                                                                   Supplement Sect. S3 with comments on sensitivity analysis
We used the SWAT CUP 5.1.6.2 interfaces and sequential un-         to select model parameters used in this paper (the Supple-
certainty fitting (SUFI-2) algorithm for calibrating the quan-     ment).
tity and quality parameters and also for validating the simu-         Moreover, to reduce the uncertainty of our predictions, we
lations in the sub-basins. Quantitative calibration was per-       used approximately 2500 primary data derived from an ear-
formed in stations that had more than 2 full years of ob-          lier stage of this research (Taffarello et al., 2016a). As a pa-
served data, i.e., eight stations, namely Posses outlet, F23,      rameterization result of field investigations and ecohydro-
F24, F25B, F28, Atibainha Reservoir, Cachoeira Reservoir,          logic modeling, Fig. 5 shows parts of the calibrated model
Jaguari and Jacareí Reservoir (Table 2). A common test pe-         performance (lines) against field observations (dots with ex-
riod for all LULC scenarios was selected; in our case, the         perimental uncertainty) for flow discharges, nitrate and total
test period ranged from 1 January 2006 to 30 June 2014.            phosphorus loads for catchment areas ranging from 7.1 to
This period has the rain anomaly of drought conditions from        508 km2 . Finally, other water quality variables were studied
2013 to 2014. The calibration period was from October 2007         based on data from field sampling.
to September 2009, the only period with observed data in              We highlight some SWAT model limitations when we
all of the above eight stations. Validation took place from        compare the simulated to observed water flows, especially in
January 2006 to September 2007 and from October 2009               the dry season. For example, when the model was discretized
to June 2014. Calibration and validation of SWAT at the            on a daily resolution, the adherence level between the ob-
stations with over 2 years of data were rated as good, ac-         served and simulated flows was considered good. However,
cording to the classification by Moriasi et al. (2007), since      the model did not fit well to the observed values only dur-
the Nash–Sutcliffe efficiency (NSE) criterion (Nash and Sut-       ing a specific time interval of the drought period (i.e., Febru-
cliffe, 1970) was greater than 0.65, except for the Posses         ary 2014 to May 2014). These differences were more sig-
outlet, which presented the logarithmic Nash–Sutcliffe effi-       nificant for water quality parameters, such as nitrate and to-
ciency of the logarithm of discharges (NSElog) (using the          tal phosphorous. We point out that the macronutrient loads
logarithm of streamflow, a criterion that gives greater weight     found in May 2014 were clearly higher than the loads we
to smaller flow rates) of less than 0.5, rated as unsatisfac-      found in previous sampling, which occurred in wetter pe-
tory. The percent bias (Pbias) statistic indicates the bias per-   riods (Taffarello et al., 2016). For the sample collected in
centage of simulated flows relative to the observed flows          May 2014, the model significantly underestimated the pol-
(Gupta et al., 1999). Thus, when the Pbias value is closer         lutant loads of nitrate. This behavior, arising from the re-
to zero, it results in a better representation of the basin        cent and most severe drought faced by the Cantareira sys-
and in lower estimate tendencies (Moriasi et al., 2007). As        tem (Nobre et al., 2016; Marengo et al., 2015; Taffarello

Hydrol. Earth Syst. Sci., 22, 4699–4723, 2018                                    www.hydrol-earth-syst-sci.net/22/4699/2018/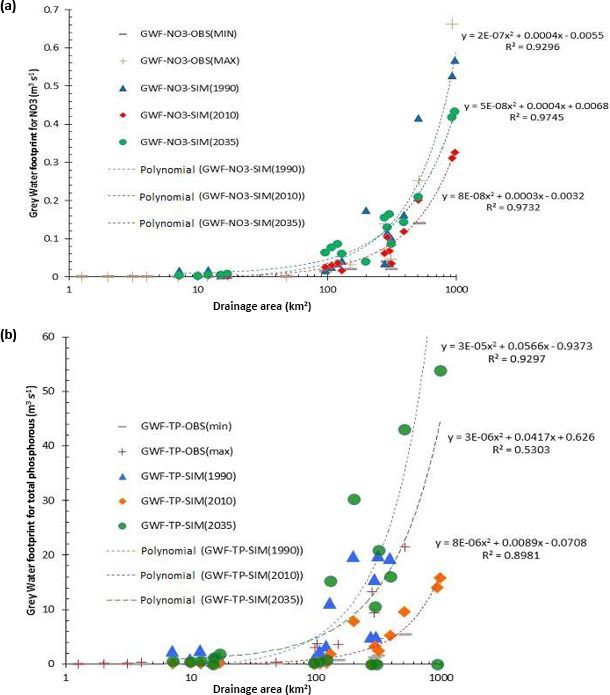
D. Taffarello et al.: Modeling freshwater quality scenarios with EbA in the Cantareira system, Brazil 4705
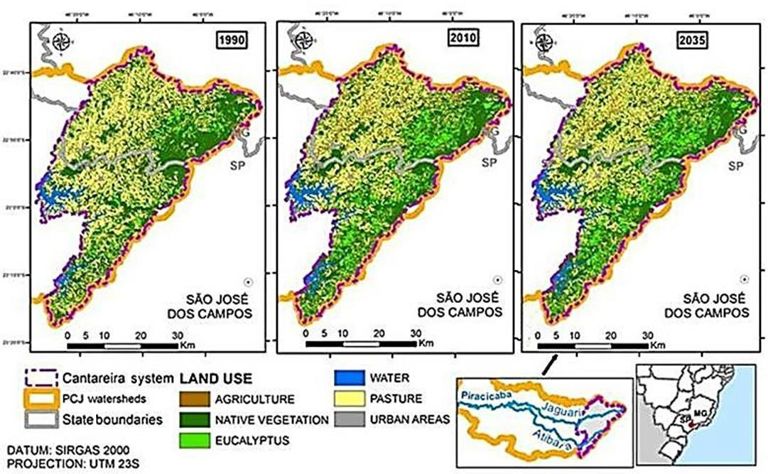
Figure 3. Land-use change during 1990 (scenario S1), 2010 (scenario S2) and 2035 (scenario S2 + EbA) in the headwaters of the Cantareira
water supply system.
Table 2. Characteristics of quantitative calibration and validation of SWAT in studied catchments (Moriasi et al., 2007). Area delimited by
the digital terrain model (adapted from Mohor and Mendiondo, 2017).
Gauge Area Pbias NSE NSE Pbias NSE NSE Log Performance level of
station (km2 ) (%) (–) Log(–) (%) (–) Log(–) calibration and validation
Calibration Validation (Moriasi et al., 2007)
Posses 13.3 −22.0 0.68 0.52 15.4 0.78 0.38 Unsatisfactory/very good
F28 281.5 5.3 0.80 0.68 14.2 0.72 0.31 Very good/good
F24 294.5 −13.3 0.69 0.71 −1.7 0.65 0.34 Satisfactory/satisfactory
Atibainha 331.7 −14.5 0.60 0.55 1.7 0.71 0.54 Satisfactory/good
Cachoeira 397.3 −26.6 0.49 0.31 −46.7 0.27 0.05 Unsatisfactory/unsatisfactory
F23 511.2 −1.8 0.88 0.90 12.0 0.84 0.77 Very good/very good
F25B 981.4 3.6 0.91 0.89 11.4 0.77 0.72 Very good/very good
Jag +Jac 1276.9 −12.0 0.83 0.87 −8.4 0.82 0.73 Very good/very good
et al., 2016a; Escobar, 2015; The Economist, 2015; Porto
and Porto, 2014), shows the need for the improvement of the
SWAT model performance, especially to capture nonlineari-
ties having impacts on regulating ecosystem services during
extreme flows. For EbA scenarios, we planned to set up field
investigations and SWAT calibrations (see Fig. 5) using the
extreme conditions of the 2013–2014 drought through fresh-
water quality monitoring at the headwaters of the Cantareira
system (see Tafarello et al., 2016a).
2.5 The scenarios and a new index for hydrologic
service assessment
Figure 4. Model calibration related to drainage areas of catchments Differences in flow rates and water quality (for the vari-
in the Cantareira system. ables of nitrate, phosphate, BOD5,20 , turbidity and faecal co-
liforms) for the 20 sub-basins were evaluated using flow-
and-load duration curves for the three scenarios proposed
www.hydrol-earth-syst-sci.net/22/4699/2018/ Hydrol. Earth Syst. Sci., 22, 4699–4723, 2018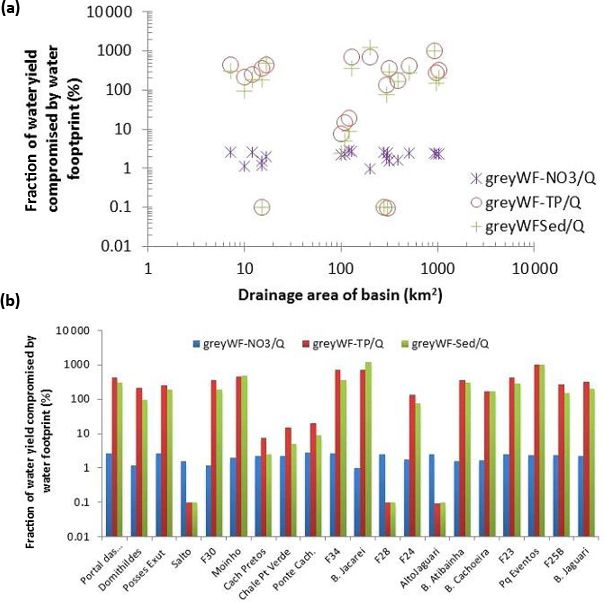
4706                 D. Taffarello et al.: Modeling freshwater quality scenarios with EbA in the Cantareira system, Brazil

Table 3. Calibrated SWAT parameters in the headwaters of the Cantareira water supply system. SCS is related to the method developed
by the Natural Resources Conservation Service of USDA, previously named the Soil Conservation Service. USLE is the universal soil loss
equation.

                               Description                                              Parameter     Fitted values
                               Initial SCS curve number (moisture condition II) for     CN2           < 0.25
                               runoff potential.
                               Soil evaporation compensation factor.                    ESCO          < 0.2
             Water quantity    Plant uptake compensation factor.                        EPCO          < 1.0
                               Maximum canopy storage (mm).                             CANMX         Varies by vegetal cover
                               Manning’s coefficient “n” value for the main channel.    CH_N2         0.025
                               Nitrate percolation coefficient                          NPERCO        0.2
             Water quality     Minimum value of the USLE C coefficient for water        USLE_C        Varies by land use (< 0.4)
                               erosion related to the land cover

Figure 5. Comparison between flow discharges (upper part) and nitrate loads (lower part), through observed flows (dotted lines), simulated by
SWAT (solid lines) and field validation through instantaneous experimental samples (marked points with uncertainty intervals) at monitored
stations of Posses outlet (left part), F23 Camanducaia (center part) and F24 Cachoeira (right part). The uncertainty bars were determined
using instantaneous velocities measured in the river cross-sections during 2013/14 field campaigns (Taffarello et al., 2016a). The uncertainty
bars represent the minimum and maximum values of measured streamflow and pollutant loads in a cross section of the river during a field
campaign of headwater catchments.

in this study: (i) recent past scenario (S1), including the              water footprint. Next, we developed a new ecohydrologic in-
recorded past events for land use in 1990; (ii) current land-            dex to assess the regulating hydrologic services in relation
use scenario (S2), which considered land uses for the 2010–              to the greyWF. This new indicator encompasses the former
2015 period as the baseline; and (iii) future land-use scenario          theory related to environmental sustainability of the greyWF,
(S2 + EbA), supposing a forest cover conversion in the pro-              according to Hoekstra et al. (2011). In this study, as a relevant
tected areas, through EbA options, according to the PCJ river            local impact indicator, Hoekstra et al. (2011) proposed to cal-
basin plan by 2035. Using these curves, from the methodol-               culate the water pollution level (WPL) within the catchment,
ogy shown by Hoekstra et al. (2011), and based on Duku                   which measures the degree of pollution. WPL is defined
et al. (2015) and Cunha et al. (2012), we estimated the grey             as a fraction of the waste assimilation capacity consumed

Hydrol. Earth Syst. Sci., 22, 4699–4723, 2018                                           www.hydrol-earth-syst-sci.net/22/4699/2018/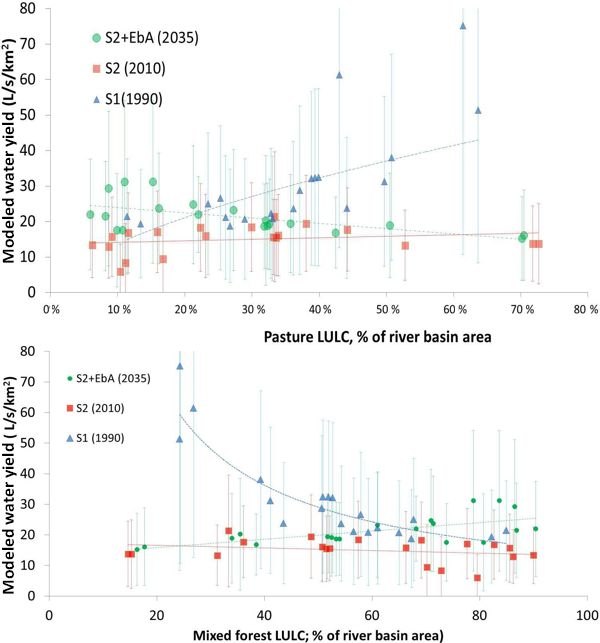
D. Taffarello et al.: Modeling freshwater quality scenarios with EbA in the Cantareira system, Brazil                         4707

and calculatedPby taking the ratio of the total of greyWF in       3.1   Data from field sampling
a catchment ( WFgrey) to the actual runoff from that catch-
ment (Ract ), or, in a proxy manner, the water yield or mean       Some of the water quality and quantity variables from our
water yield or long-term period (Qlp ). This assumption is that    freshwater monitoring are useful to assess the hydrologic ser-
a water pollution level of 100 % means that the waste assim-       vices; thus, they are presented in Table 4. These variables
ilation capacity has been fully consumed. Furthermore, this        were selected due to their relationship with anthropic im-
approach assumes that when WPL exceeds 100 %, environ-             pacts on the water bodies and because of their importance
mental standards are violated, such as                             for sanitation. Among the water quality variables sampled in
         P                                                         the field step of the research (see Taffarello et al., 2016a, b),
            WFgrey [x, t]                                          we highlight turbidity because it indicates a proxy estima-
WPL =                      .                                (1)
             Ract [x, t]                                           tion about the total suspended solids in lotic environments
                                                                   (UNEP, 2008), related to the LULC conversion, and reflects
It is worth mentioning that for some experts, the aforemen-
                                                                   the changes in the hydrologic services. Figure 6 shows the di-
tioned equation can overestimate the flow necessary to dilute
                                                                   rect correlation between turbidity and size of the sub-basins.
pollutants. For that reason, new insights of composite indica-
                                                                   Turbidity can indirectly indicate anthropic impacts in streams
tors or thresholds are recommended, as follows. The above
                                                                   and rivers (Martinelli et al., 1999). The lower turbidity mean
assumption could overestimate WPL because it would fail to
                                                                   values were observed in two more conserved sub-basins
consider the combined capacity of water to assimilate multi-
                                                                   (which presented higher amounts of forest remnants): 2 NTU
ple pollutants (Hoekstra et al., 2012; Smakhtin et al., 2005).
                                                                   in the reference Cancã catchment (Domithildes) and 5 NTU
Conversely, in this study, we define an alternative indicator
                                                                   in the upper Posses. Otherwise, we found a positive rela-
related to the three following fundamentals. First, the WPL
                                                                   tionship between nitrate concentrations and both discharge
should be extended to a composite index, thereby represent-
                                                                   and mean water level (Fig. 7). It can be inferred that higher
ing weights of each pollutant related to the actual runoff, here
                                                                   concentrations of macronutrients would be found in down-
as a proxy of long-term runoff, i.e.,
                                                                   stream areas. This trend can be associated with the nutrient
                        P
                          {w [x, t] · WFgrey[x, t]}                migration (Cunha et al., 2013) and land-use change (Zaffani
WPLcomposite [x, t] =                                              et al., 2015), as well as point source pollution. In addition,
                          Ract [x, t] ∼
                                      = Qlp [x, t]
    X                                                              the absence of the riparian forest in 70 % of the protected
       w [x, t] = 1, 0 ≤ w[x, t] ≤ 1.                        (2)   area (36.844 ha) of the Cantareira system (Guimarães et al.,
                                                                   2015) can increase the sediment transport from riparian areas
For this new equation, weights should be assessed, either          to rivers and make pollutant filtration more difficult, leading
from field experiments or even from simulation outputs. Sec-       to higher nitrate concentrations downstream.
ond, we define a threshold value of WPLcomposite,ref regarding
the reference catchments in non-developed conditions which         3.2   LULC change scenarios
suggest more conservation conditions among other catch-
ments of the same region, as WPLreference . For this study, we     The variations in LULC affect freshwater quality, which,
selected the Domithildes catchment as the reference catch-         in turn, affect the dynamics of aquatic ecosystems (Zaf-
ment with conservancy measures. From this reference catch-         fani et al., 2015; Hamel et al., 2013; Bach and Ostrowski,
ment, we define the composite reference index for the water        2013). These changes impact the hydrologic services, espe-
pollution level as WPLcomposite,ref and, derived from it, the      cially regulating and supporting ecosystem services (Mulder
hydrologic service index (HSI), as a non-dimensional factor        et al., 2015; Molin et al., 2017). The LULC of each sub-
of comparison between WPL for reference and non-reference          basin, according to a past-condition scenario (S1, in 1990),
catchments, as follows:                                            a present-condition (S2, in 2010) and a future (S2 + Eba,
                      WPL [x, t] − WPLcomposite,ref                in 2035) LULC scenario, using the same weather input data
HSI [x, t] greyWF =                                 .       (3)    files, is shown in Table 5. We evaluated the effects of LULC
                           WPLcomposite,ref
                                                                   change scenarios in 20 catchments in the Jaguari, Cachoeira
                                                                   and Moinho sub-basins, southeast Brazil (Fig. 8). Concern-
3   Results                                                        ing the land-use change, the main soil uses 25 years ago were
                                                                   pasture (in 50 % of the sub-basins) and native vegetation (in
In the following section, we present the results from field        45 % of the sub-basins). According to Molin (2014), the 5 %
observations, which are useful not only for ecohydrologic          of the remaining area was divided into vegetables, eucalyp-
parameterization, but also for elucidating features regarding      tus, sparse human settlements, bare soil and mining. The
greyWF and hydrologic services. Next, we compare the wa-           main activity in the past (1990) was extensive cattle raising
ter yield and greyWF outputs from simulations under LULC           for milk production by small producers in the region (ANA,
scenarios, including EbA options, to finally propose a new         2012; Veiga Neto, 2008). By assessing the temporal trends of
hydrologic services indicator.                                     increment or reduction of native remnants, we examined the

www.hydrol-earth-syst-sci.net/22/4699/2018/                                     Hydrol. Earth Syst. Sci., 22, 4699–4723, 2018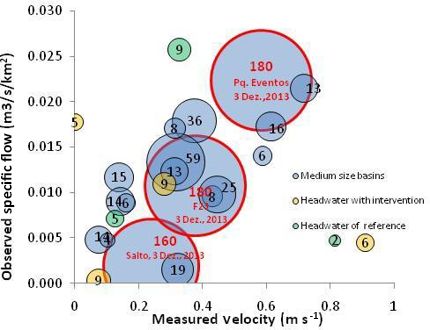
4708                 D. Taffarello et al.: Modeling freshwater quality scenarios with EbA in the Cantareira system, Brazil

                                                                         and assessed for all modeled sub-basins (N = 20), the results
                                                                         show average values of water yield: 31.4 ± 25.2 L s−1 km−2
                                                                         for S1 (1990), 14.9 ± 11.5 L s−1 km−2 for S2 (2010) and
                                                                         21.4 ± 15.3 L s−1 km−2 for S2 + EbA (2035). This very high
                                                                         variation can be due to the complexity of river basin systems
                                                                         and the various sources of uncertainty in the representation
                                                                         of ecohydrologic processes.
                                                                            The three analyzed scenarios and the ecohydrologic mon-
                                                                         itoring provide different types of information for the same
                                                                         catchments. The 52 % decrease in water yield between S1
                                                                         (1990) and S2 (2010) scenarios, as ((14.9 − 31.3)/31.3 ×
                                                                         100), might be related to a marginal increase in the euca-
                                                                         lyptus cover. In fact, from 1990 to 2010, eucalyptus cover
                                                                         increased +6.8 % in total land cover, but +181 % in relative
                                                                         terms. Another possible explanation is the decrease in na-
                                                                         tive vegetation from 1990 to 2010, with −1.8 % in total land
Figure 6. Experimental sampling of turbidity (size of circles), ob-      cover, but −4.3 % in relative terms. In parallel, we evalu-
served flows and mean velocities in river cross sections of 17 catch-    ated the water yield. Thus, the flow-and-load duration curves
ments in Cantareira system headwater (October 2013–May 2014).            summarize the flow and pollutant load variability, thereby
This illustration shows the high interdependence and complexity in       showing potential links and impacts for aquatic ecosystem
integrating any standard parameterization, at a regional scale, of the
                                                                         sustainability (Cunha et al., 2012; Cruz and Tucci, 2008).
SWAT model, linking potential scenarios of LULC, water yield and
freshwater quality in medium-size basins and headwaters.
                                                                         From these curves, we obtained two different behaviors for
                                                                         the studied sub-basins (Fig. 10).
                                                                            Behavior I: the water yield in 2010 was reduced in relation
periods 1990–2010 vs. 2010–2035. From 1990 to 2010, the                  to 1990 and the water yield in 2035 might exceed the 1990
percentage of forest increased by 50 % in the Domithildes                levels. The examples are as follows: the Upper Jaguari (Alto
sub-basin, which was the reference catchment of the Water                Jaguari), Cachoeira sub-basin (including the Cachoeira dos
Producer/PCJ project (see Taffarello et al., 2016a), Moinho,             Pretos, Chalé Ponto Verde, Ponte Cachoeira, F24 outlet) and
Cachoeira dos Pretos, F34, B. Jacareí, B. Atibainha, B. Ca-              Moinho catchments.
choeira, Pq Eventos, F25B and B. Jaguari (Fig. 9). Con-                     Behavior II: the water yield after 2010 was reduced until
cerning the period from 2010 to 2035, the model was set                  2035 and this water yield recuperation was not possible for
up considering an increase in native vegetation in all sub-              the values in 1990. Examples, in decreasing size of drainage
basins from forest remnants in 2010 and from the new BMP                 areas, are as follows: Atibainha, B. Jaguari, F25B, Parque de
of reforestation with native species in 20 sub-basins by 2035            Eventos, F23, B.Atibainha, F34, F30, Salto, Posses outlet,
(Fig. 9). The hydro-services in the Posses and Salto catch-              Domithildes, Portal das Estrelas (middle Posses).
ments and in the Cachoeira sub-basin will be increased by                   On the one hand, according to Fig. 11, the water yield of
2035 as a function of the efforts on EbA which currently ex-             S1 is inversely proportional to the land use of mixed forest
ist in the region (Richards et al., 2015, 2017; Santos, 2014).           cover. The water yield in S2 indicates a constant value of ap-
                                                                         proximately 17 L s−1 km−2 . Moreover, for the S2 + EbA sce-
3.3    Water yield as a function of soil cover                           nario, which incorporates the EbA approach through BMP,
                                                                         the water yield is approximately 17 L s−1 km−2 , but with
In this research, we chose to use qualitative and quantitative           a slight increase in the water yield when the percentage of
duration curves for the integrated assessment of availabil-              forest cover is higher than 50 %. Presumably, this slight in-
ity and quality of water. The flow-and-load duration curve,              crease in the water yield would be related to the type of
comparable to histograms of relative cumulative frequencies              best management practices of the recovery forests, which still
of flows and loads of a water body, is a simple and im-                  did not achieve evapotranspiration rates of the climax stage.
portant analysis in hydrology (Collischonn and Dornelles,                In the riparian forest recovery, evapotranspiration rates are
2013). In quantitative terms, the flow duration curve shows              lower and, thus, a greater amount of precipitation reaches the
the probabilistic temporal distribution of water availability            soil and rivers through the canopy. This process could ben-
(Cruz and Silveira, 2007), relating the flow in the river cross          efit other hydrologic components, such as runoff, increasing
section to the percentage of time in which it is equalled or             water flows into the rivers. This effect can possibly explain
exceeded (Cruz and Tucci, 2008).The three scenarios S1, S2               the behavior I catchments (see Fig. 10).
and S2 + EbA resulted in different flow values for the 20
sub-basins (Fig. 10). Based on the arithmetic mean of time
series of monthly water yields, related to catchment areas,

Hydrol. Earth Syst. Sci., 22, 4699–4723, 2018                                         www.hydrol-earth-syst-sci.net/22/4699/2018/
D. Taffarello et al.: Modeling freshwater quality scenarios with EbA in the Cantareira system, Brazil 4709
Figure 7. Multidimensional chart of hydraulic and water quality variables sampled in field campaigns in the headwaters of the Cantareira
water supply system between October 2013 and May 2014.
3.4 Relationships between land-use and land-cover to low values in the three analyzed scenarios (between 1
change and grey water footprint and 10 %; Fig. 12a). In relation to total phosphorous, the
load duration curves from S1, S2 and S2 + EbA scenarios
For an integrated assessment of hydro-services, we analyzed showed disparities. For example, the greyWF-TP decreased
the spatiotemporal conditions of load production at the sub- in all sub-basins between 1990, 2010 and 2035. From 2010 to
basin scale (see more information on Sect. S4 “Comments on 2035, the model predicts a new behavior for the greyWF-TP.
differences in land use and land cover in sub-basins studied”, Results of the greyWF for TP, NO3 and sediments en-
in the Supplement). As we studied rural sub-basins, water abled us to infer hydrological regionalization for nutrient
pollution was mainly produced by diffuse sources, such as loads. Among the 20 sub-basins studied, we selected 2 sub-
fertilizers and agrochemicals. In this context, we evaluated basins as study cases to illustrate the links between LULC
the evolution of greyWF to show nitrate (N-NO3 ), total phos- and greyWF: (1) the Upper Jaguari and (2) Domithildes. The
phorus and sediment (Sed) yields (indicated by turbidity) of reasons for selecting the two sub-basins among the 20 sub-
scenarios S1, S2 and S2 + EbA. First, we calculated the ni- catchments are detailed in Sect. S5.
trate loads generated from the 20 sub-basins in the three sce-
narios. Second, we did the same for total phosphorous loads
and sediment yields. Third, considering the river regime, we 3.4.1 Case study I: Upper Jaguari sub-basin
calculated the greyWF for nitrate, total phosphorous and sed-
iments in each sub-basin to develop a new composite index The Upper Jaguari (Fig. 13) has 302 km2 and is the sec-
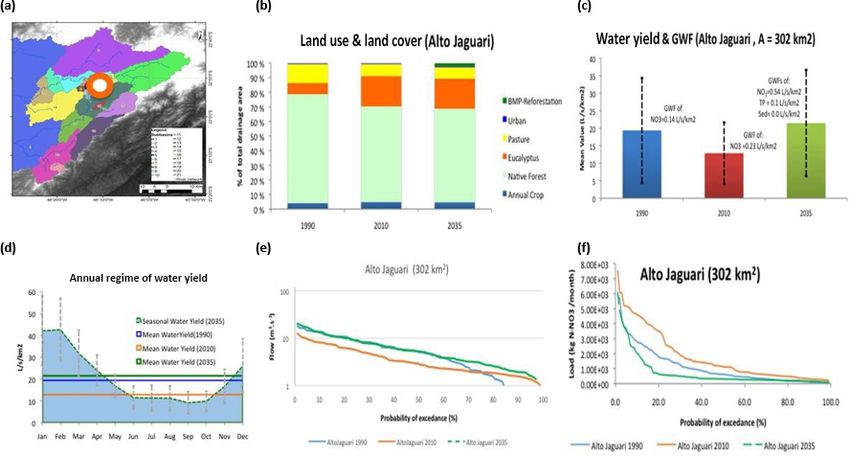
that assesses the sustainability of hydrologic services. ond most upstream sub-basin within the Cantareira sys-
Concerning nitrate, the sampled concentrations were low. tem (downstream of only the F28 sub-basin, with 277 km2 ).
In addition, SWAT simulations also produced very low out- Comparing scenario 1990 (S1) and 2010 (S2), the results
puts, and the greyWF-NO3 varied from 0.11 L s−1 km−2 showed evidence that the native forest decayed approx. 10 %.
(in Atibainha sub-basin in the S2, 2010, scenario) to Indeed, scenario 2035 (S2 + EbA) still assumes a very small
2.83 L s−1 km−2 (in the middle Posses catchment, Portal das decrease in the native forest. This decrease may be due to the
Estrelas, under the S2 + EbA, 2035, scenario). Considering increase in secondary forests by BMP, which could stabilize
Brazilian water quality standards for nitrate, the maximum the native forest LULC by 70 % until 2035. The mean annual
allowed concentration is 10 mg L−1 (Brasil, 2005). These simulated water yields, in spite of high variability of sim-
low amounts of nitrate loads make the greyWF-NO3 fall ulated scenarios, pointed out values of 18 L s−1 km2 (1990,
www.hydrol-earth-syst-sci.net/22/4699/2018/ Hydrol. Earth Syst. Sci., 22, 4699–4723, 20184710 D. Taffarello et al.: Modeling freshwater quality scenarios with EbA in the Cantareira system, Brazil Figure 8. Study area divided into sub-basins for hypothesis testing using semi-distributed SWAT model. Figure 9. Native forest cover in S1 (1990), S2 (2010) and S2 + EbA (2035). Hydrol. Earth Syst. Sci., 22, 4699–4723, 2018 www.hydrol-earth-syst-sci.net/22/4699/2018/
D. Taffarello et al.: Modeling freshwater quality scenarios with EbA in the Cantareira system, Brazil                      4711

Figure 10. Flow duration curves under three LULC scenarios: S1(1990), S2(2010) and S2 + EbA(2035) at headwaters of the Cantareira
water supply system.

www.hydrol-earth-syst-sci.net/22/4699/2018/                                     Hydrol. Earth Syst. Sci., 22, 4699–4723, 2018
4712                D. Taffarello et al.: Modeling freshwater quality scenarios with EbA in the Cantareira system, Brazil

Figure 11. LULC scenarios for specific water yield for 20 drainage areas at Jaguari, Cachoeira and Atibainha watersheds, according to S1
(1990), S2 (2010) and S2 + EbA (2035) scenarios.

S1), 13 L s−1 km−2 (2010, S2) and 21 L s−1 km−2 (for 2035,            situation may not achieve values obtained for S1 conditions
S2 + EbA).                                                            in 1990 (∼ 29 L s−1 km−2 ).

                                                                      3.5   Results of a new index for hydrologic service
3.4.2   Case study II: Domithildes headwater
                                                                            assessment

The Domithildes catchment (9.9 km2 ) is located in the Cancã          The new index for hydrologic service assessment was devel-
catchment. Similar to the Upper Jaguari, Domithildes is one           oped as a simple relation between greyWF and water yield,
of the most conserved sub-basins, mainly with native forests.         using a fraction between water demand (numerator) and
The native forest fraction remained constant (see Fig. 14)            availability (denominator). Some authors commonly use this
from S1 (51 % in 1990) to S2 (52 % in 2010). However, un-             fraction as a direct approach to water scarcity (i.e., Smakhtin
like the Upper Jaguari sub-basin (see Fig. 13), native vege-          et al., 2005; Hoekstra, 2013; McNulty et al., 2010; among
tation could increase by 56 % in S2 + EbA (2035). Due to              others). Therefore, we first assessed greyWF by respective
the fact that Domithildes was adopted as a reference basin            drainage basins (Fig. 15). Then, we calculated the water pol-
for Water Producer/PCJ, the augmented fraction of native              lution levels. The results in Fig. 16 show the composite wa-
forest by 2035 could show an increase in secondary forest.            ter pollution level (WPLcomposite,ref ) vs. drainage areas and
Regarding water yield, the Domithildes catchment was clas-            compared with the HSI. The baseline WPLcomposite,ref is re-
sified as a second type of sub-basin behavior (Sect. 3.3).            lated to the Domithildes catchment (horizontal, dotted line in
There is a positive increment of water yield between 2010 (∼          Fig. 16). This line divides the graph into two regions: less
18 L s−1 km−2 ) and 2035 (∼ 23 L s−1 km−2 ), although this            sustainable basins (HSI > 0) and more sustainable basins

Hydrol. Earth Syst. Sci., 22, 4699–4723, 2018                                        www.hydrol-earth-syst-sci.net/22/4699/2018/
D. Taffarello et al.: Modeling freshwater quality scenarios with EbA in the Cantareira system, Brazil 4713
Figure 12. Fraction of water yield (mean Q) compromised by the grey water footprint of nitrate (greyWF-NO3), total phosphorous (greyWF-
TP) and sediments (greyWF-Sed) vs. drainage area (a) and vs. selected sub-basins (b).
(HSI ≤ 0). The more sustainable basins (HSI < 0) are the 4.1 On field data
Salto; Cachoeira nested catchments (Cachoeira dos Pretos,
Chalé Ponto Verde and Ponte Cachoeira); and the F28, F24 Other conserved sub-basins also presented low mean val-
and Upper Jaguari basin. ues of turbidity (< 6.5 NTU), e.g., intervention Cancã catch-
ment (5 NTU) and Cachoeira dos Pretos (6 NTU). We found
3.6 Comparison of field investigation and modeled the highest turbidity above 40 NTU, which is considered the
scenarios maximum established water quality standard for Brazilian
class 1 (BRASIL, 2005), at Parque de Eventos (283 NTU),
Field and experimental data (Taffarello et al., 2016a) with at F23 (180 NTU) and at Salto outlet (160 NTU). How-
modeled scenarios of land-use and land-cover change, in- ever, these three sampling sites are located at water bodies
cluding the EbA hypothesis, were integrated into a summary of class 2, where the maximum turbidity allowed is up to
figure in the Supplement (see Fig. S1). 100 NTU (BRAZIL, 2005). Due to these areas having the
highest urbanization among the sampled sites, they are in
4 Discussion noncompliance with Brazilian environmental standards. Ar-
roio Jr. et al. (2013) found a decreasing relation between tur-
This section discusses field data, LULC change scenarios, bidity and drainage areas in another catchment located in São
greyWF and water yield, not only in general aspects, but also Paulo state. Temporal turbidity patterns show that on the one
in selected catchments, which is mentioned in Sect. 3. hand, in 11 out of 17 monitored sites, the higher values of tur-
bidity occurred in December 2013, the only field campaign
with significant precipitation (35.3 mm) and with a higher an-
tecedent precipitation index (API = 123.7 mm). This can be
due to carrying allochthon particles, which are drained into
www.hydrol-earth-syst-sci.net/22/4699/2018/ Hydrol. Earth Syst. Sci., 22, 4699–4723, 20184714 D. Taffarello et al.: Modeling freshwater quality scenarios with EbA in the Cantareira system, Brazil Figure 13. Synthesis chart of case study of the Upper Jaguari sub-basin (drainage area = 302 km2 ). (a) Localization at the drainage areas of the Cantareira system; (b) LULC conditions for scenarios S1 (1990), S2 (2010) and S2 + EbA (2035); (c) comparison of water yields simulated for conditions of S1, S2 and S2 + EbA; (d) water yield scenarios compared with intra-annual regime of S2 + EbA scenario; (e) comparison of duration curves of flows for S1, S2 and S2 + EbA conditions; (f) duration curves of N-NO3 loads for S1, S2 and S2 + EbA. Figure 14. Synthesis chart of case study the Domithildes catchment (drainage area = 9.9 km2 ). (a) Localization at the drainage areas of the Cantareira system; (b) LULC conditions for scenarios S1 (1990), S2 (2010) and S2 + EbA (2035); (c) comparison of water yields simulated for conditions of S1, S2 and S2 + EbA; (d) water yield scenarios compared with intra-annual regime of S2 + EbA scenario; (e) comparison of duration curves of flows for S1, S2 and S2 + EbA conditions; (f) duration curves of N-NO3 loads for S1, S2 and S2 + EbA. Hydrol. Earth Syst. Sci., 22, 4699–4723, 2018 www.hydrol-earth-syst-sci.net/22/4699/2018/
D. Taffarello et al.: Modeling freshwater quality scenarios with EbA in the Cantareira system, Brazil                             4715

Figure 15. Relationships between grey water footprint for nitrate (a) and total phosphorous (b) according to three LULC scenarios (1990,
2010 and 2035) and size of the drainage areas of headwaters in the Cantareira water supply system.

rivers by precipitation. Analogously, Arroio Jr. et al. (2013)        of the sub-basins) in 2010. From 1990 to 2010, there was
also observed higher turbidity in the rainy season (Decem-            a significant conversion of soil cover, with a small reduc-
ber 2012) which can lead to erosive processes. On the other           tion of pasture areas (−2 %) and native remnants (−5 %) and
hand, Zaffani et al. (2015) showed that turbidity did not vary        with a progressive increase in eucalyptus, a non-native tree
over the hydrologic year in medium-sized, rural and peri-             species in Brazil. Eucalyptus soil use varied from an increase
urban watersheds ranging from 1 to 242 km2 . In this case,            of +1 % within Posses up to an increase of +31 % in the
other factors may have had an influence, such as deforesta-           Chalé Ponto Verde sub-basin in 2010 (compared to 1990).
tion, seasonal variability, soil use type, sewage and mining          Eucalyptus cover, however, did not achieve 10 % of the soil
(CETESB, 2016; Tundisi, 2014).                                        uses in any of the simulated sub-basins in 1990. In the third
                                                                      scenario (S2 + EbA), we hypothesized incentives of public
4.2   On LULC change scenarios                                        policies for forest conservation and restoration, due to the
                                                                      strengthening of EbA in the Cantareira system. This could
The main soil uses are pasture (58 % of the drainage area             lead to an increase in native vegetation reaching percentages
of the sub-basins) and forest (40 % of the drainage area

www.hydrol-earth-syst-sci.net/22/4699/2018/                                         Hydrol. Earth Syst. Sci., 22, 4699–4723, 2018
You can also read