Modeling the risk of illegal forest activity and its distribution in the southeastern region of the Sierra Madre Mountain Range, Philippines ...
←
→
Page content transcription
If your browser does not render page correctly, please read the page content below
iForest                                                                                                      Research Article
                                                                                                           doi: 10.3832/ifor3937-014
                                                                                                                    vol. 15, pp. 63-70
          Biogeosciences and Forestry

Modeling the risk of illegal forest activity and its distribution in the
southeastern region of the Sierra Madre Mountain Range, Philippines

Jhun B Barit (1-2),                                Illegal activity within protected forests, such as illegal logging, slash-and-burn
                                                   farming, and agricultural expansion, has brought many plant and animal spe-
Kwanghun Choi (2),                                 cies to the brink of extinction and threatens various conservation efforts. The
Dongwook W Ko (2)                                  Philippine government has introduced a number of actions to combat environ-
                                                   mental degradation, including the use of mobile platforms such as the SMART-
                                                   Lawin system to collect patrol data from the field, which represents a remark-
                                                   able step towards data-driven conservation management. However, it remains
                                                   difficult to control illegal forest activity within protected landscapes due to
                                                   limited patrol and law enforcement resources. A better understanding of the
                                                   spatial distribution of illegal activity is crucial to strengthening and efficiently
                                                   implementing forest protection practices. In the present study, we predicted
                                                   the spatial distribution of illegal activity and identified the associated environ-
                                                   mental factors using maximum entropy modeling (MaxEnt). Patrol data collect-
                                                   ed using the SMART-Lawin system from the Baliuag Conservation Area for the
                                                   period 2017-2019 were used to train and validate the MaxEnt models. We
                                                   tuned the MaxEnt parameter setting using the ENMeval package in R to over-
                                                   come sampling bias, avoid overfitting, and balance model complexity. The re-
                                                   sulting MaxEnt models provided a clear understanding of the overall risk of il-
                                                   legal activity and its spatial distribution within the conservation area. This
                                                   study demonstrated the potential utility of data-driven models developed from
                                                   patrol observation records. The output of this research is beneficial for con-
                                                   servation managers who are required to allocate limited resources and make
                                                   informed management decisions.

                                                   Keywords: Philippines, SMART, Ranger Patrol Data, Illegal Forest Activity, Pro-
                                                   tected Area Management

Introduction                                       diversity in protected areas in the Philip-      east Asia and the seventh-fastest globally
  Due to their diverse landscapes, the for-        pines (Carandang et al. 2013), while the         during this period (Bisson et al. 2003). In
ests in the Philippines are considered one         growing demand for forest resources by lo-       the Philippines, slash-and-burn farming has
of the most significant global biodiversity        cal communities makes it more challenging        converted primary or secondary forest to
hotspots and an important conservation             to manage these areas and their natural re-      agricultural land (Kummer 1992), while in-
target (Lasco et al. 2008). However, Philip-       sources (Jones et al. 2019).                     discriminate illegal mining operations have
pine forests and their biodiversity have             Earlier studies have emphasized that the       also seriously damaged several forest areas
been degraded at an alarming rate due to a         threats to biodiversity are directly associ-     (Finger et al. 1999). Similarly, charcoal pro-
combination of illegal anthropogenic for-          ated with the excessive utilization of re-       duction is a significant threat in the Philip-
est activity, such as illegal logging, slash-      sources, developmental activity, and the in-     pines because fuelwood-dependent indus-
and-burn farming, mining, and charcoal             creasing population in the Philippines (Van      tries rely on illegally gathered charcoal
production, and biophysical phenomena,             Der Ploeg et al. 2003). From 2000 to 2005,       from natural or plantation forests to pro-
such as typhoons, floods, and landslides           the Philippines lost about 0.1 million ha of     duce goods for commercial and domestic
(Rubas-Leal et al. 2017). Illegal activity asso-   its forest cover (2.1% of the overall forested   use (Remedio 2009). A number of strate-
ciated with the extraction of natural re-          area) annually due to illegal logging, the       gies are thus required to prevent illegal
sources has reduced forest cover and bio-          second-fastest deforestation rate in South-      activity in protected areas, including
                                                                                                    strengthening law enforcement monitor-
                                                                                                    ing and patrolling, support for alternative
  (1) Department of Environment and Natural Resources (DENR), Philippines; (2) Depart-              industries in the local community, the re-
ment of Forest Environment and Systems, Kookmin University, South Korea                             duction of forest communities living in
                                                                                                    close proximity to the forests, and the
@ Dongwook W Ko (dwko@kookmin.ac.kr)                                                                strict implementation of laws and reg-
                                                                                                    ulations related to forest conservation
Received: Jul 28, 2021 - Accepted: Dec 16, 2021                                                     (Plumptre et al. 2014, Critchlow et al. 2015).
                                                                                                      Various policies and programs have been
Citation: Barit JB, Choi K, Ko DW (2022). Modeling the risk of illegal forest activity and its      introduced to reduce illegal activity in Phil-
distribution in the southeastern region of the Sierra Madre Mountain Range, Philippines.            ippine forests, but these have been under-
iForest 15: 63-70. – doi: 10.3832/ifor3937-014 [online 2022-02-21]                                  mined by inadequate law enforcement and
                                                                                                    institutionalization (e.g., law enforcement
Communicated by: Maurizio Marchi                                                                    monitoring or ground patrolling – Domingo
                                                                                                    & Manejar 2018, Carandang et al. 2013). Re-

© SISEF https://iforest.sisef.org/                                      63                                                    iForest 15: 63-70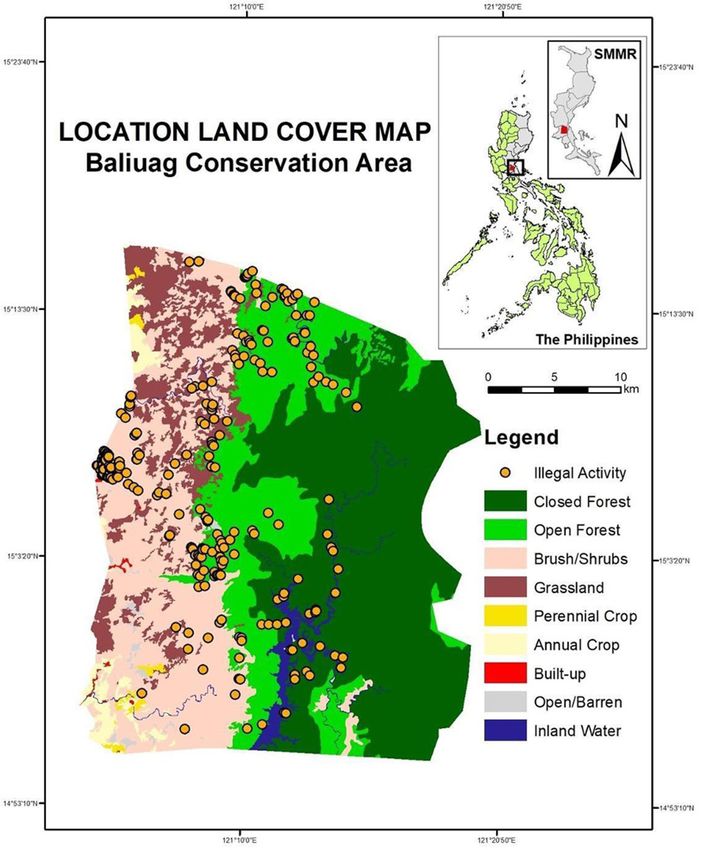
Barit JB et al. - iForest 15: 63-70
cently, the Philippine government has vided a comprehensive spatial analysis of a data generated using the SMART-Lawin
iForest – Biogeosciences and Forestry
sought to protect the remaining forest wide range of illegal forest activity, instead system can be used to identify the risk and
cover through ground patrolling and law focusing only on the accurate assessment potential locations of illegal activity within
enforcement activity using the Spatial of the dynamics of a specific illegal activity a landscape and analyze the spatial rela-
Monitoring and Reporting Tool (SMART). (Critchlow et al. 2015). tionship between this distribution and vari-
The Department of Environment and Natu- Conservation area managers require in- ous environmental and infrastructure vari-
ral Resources (DENR), in partnership with formation on the potential risk and spatial ables, such as the elevation, slope, wet-
the United States Agency for International distribution of illegal forest activity within a ness, land cover, and proximity to rivers,
Development (USAID), has developed the protected area in order to devise optimal roads, and villages (Keane et al. 2011, Plum-
SMART-Lawin Forest and Biodiversity Pro- management strategies with limited re- ptre et al. 2014, Critchlow et al. 2015, 2017,
tection System (hereafter, SMART-Lawin sources. Several studies have attempted to Denninger Snyder et al. 2019).
system). Through ground patrolling, this predict the spatial distribution of illegal ac- In this study, we used MaxEnt models to
system efficiently gathers information on tivity using Bayesian spatially explicit occu- predict the spatial patterns of illegal forest
forest conditions, threats to the environ- pancy models (Critchlow et al. 2015) and activity and identify environmental and hu-
ment (i.e., illegal activity), and indicator maximum entropy (MaxEnt) models (Plum- man drivers that are likely to influence this
species of forest health using cutting-edge ptre et al. 2014, Denninger Snyder et al. activity in the SMMR. An advantage of the
technology. The SMART-Lawin system can 2019). The MaxEnt approach has been em- MaxEnt approach is that it only requires
be employed to track illegal forest activity ployed in many studies to examine spatial presence data for an item of interest, while
and locate their hotspots of illegal activity patterns of the risk of illegal forest activity other approaches require both presence
within protected areas, thus allowing time- within various national parks (Plumptre et and absence data to identify spatial pat-
ly, informed decisions to be made based on al. 2014, Denninger Snyder et al. 2019). terns. MaxEnt models substitute absence
the rapid transmission of data. The primary These studies have found that the lack of data with randomly generated background
purpose of this system is to establish ap- manpower, logistic and financial resources, data, which is particularly useful for pre-
propriate strategies that maximize patrol and extensive patrol coverage hinder the dicting the spatial distribution of a species
effectiveness in deterring illegal forest ac- effective patrolling/monitoring of forest re- due to the difficulties associated with
tivity. sources. The accurate assessment and obtaining absence data (Elith & Leathwick
Previous research on illegal forest activity modeling of the spatial distribution of the 2009, Torres et al. 2016, Muscarella et al.
has mainly focused on a single specific ac- potential risk of illegal activity is thus nec- 2017, Zhang et al. 2018, Tumaneng et al.
tivity, for instance, illegal logging (Van Der essary to strengthen forest protection and 2019). We then used the results to recom-
Ploeg et al. 2011), the illegal hunting and effectively and efficiently manage individ- mend improvements in the patrol strategy
gathering of wildlife resources (Minter et ual conservation areas. for the region.
al. 2014), and charcoal production (Geron- In the Sierra Madre Mountain Range In summary, the main objectives of the
imo et al. 2016). These studies have been (SMMR), ranger patrol activity has gener- present study were: (i) to develop MaxEnt
useful in that they provide relevant infor- ated large volumes of data in the SMART- models for illegal forest activity within the
mation on the extent and intensity of an il- Lawin system. However, few attempts SMMR utilizing ranger patrol data collect-
legal activity within the conservation area have been made to utilize this crucial data ed via the SMART-Lawin system to under-
and how it has changed over time. How- to better allocate resources for efficient stand the spatial patterns of this activity;
ever, most of these studies have not pro- and strategic patrolling. The ranger patrol (ii) to identify significant environmental
variables that determine the distribution of
illegal forest activity; and (iii) to assess the
Fig. 1 - Location risk of illegal forest activity in this region
of and land and thus determine the patrol coverage
cover within that is required and improve the general
the Baliuag patrol strategy for the conservation area.
Conservation
Area. Materials and methods
Study area
The SMMR is the longest mountain range
in the Philippines and is surrounded by nine
provinces: Isabela, Nueva Vizcaya, Cagay-
an, Quirino, Nueva Ecija, Aurora, Bulacan,
Rizal, and Quezon (Van Der Ploeg et al.
2003). It is home to 240 bird species includ-
ing the Philippine eagle (Pithecophaga jef-
feryi) and the endemic Isabela oriole (Ori-
olus isabellae – Mallari & Jensen 1993). A
considerable number of commercially sig-
nificant but severely threatened tree spe-
cies are also found in the conservation
area, including members of the dipterocarp
family such as Shorea spp. and Hopea spp.
(Torres et al. 2016). This region is domi-
nated by the Dumagat ethnic group (62%),
and all of the residents in the area are de-
pendent on natural resources for their live-
lihoods (DENR 2015).
We selected the Baliuag Conservation
Area (BCA) in Bulacan, which is in the
southeastern region of the SMMR, as our
study area (Fig. 1). The total coverage of
64 iForest 15: 63-70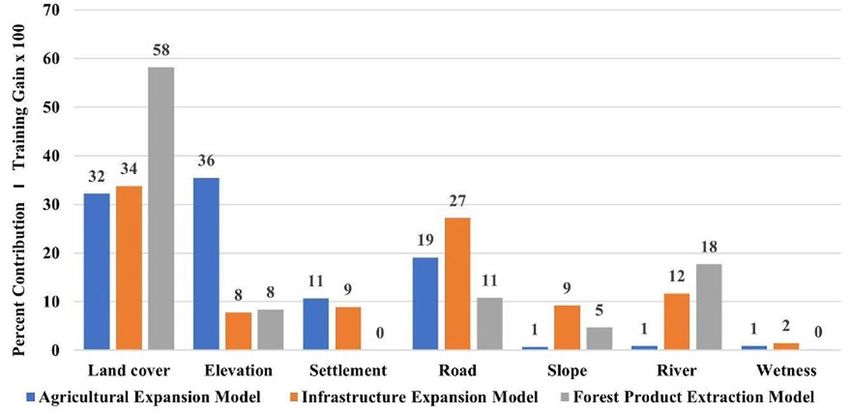
Modeling the risk of illegal forest activity in SE Philippines

the BCA is approximately 90,448 ha, which

                                                                                                                                                     iForest – Biogeosciences and Forestry
                                                 Tab. 1 - Summary of the environmental variables used in this study. (1): ASTER-Global
includes closed forest (34,849 ha), open
                                                 Digital Elevation Model (GDEM) 30 m of NASA; (2): derived from the DEM; (3): http://
forest (18,531 ha), and non-forest (37,069
                                                 www.geofabrik.de; (4): National Mapping Resources Information Authority / Forest
ha) areas (DENR-FMB 2018). The BCA com-
                                                 Management Bureau.
prises three protected areas, the Angat
Watershed Forest Reserve, Biak-na-Bato
National Park, and Doña Remedios Water-            Variable     Variable Unit              Purpose                                       Source
shed, which are designated for protection         Elevation     Meters above sea level    Accessibility: high elevations can be           (1)
and conservation (DENR-PAWB 2009, DEN-                                                    difficult to access and detect illegal
R-FMB 2018). The entire BCA is a vital                                                    activity
source of fresh water for irrigation and in-      Slope         Slope of the terrain,     Accessibility: terrain with steep slopes        (2)
dustrial purposes (e.g., hydroelectric pow-                     percent                   can be difficult to access
er generation) and serves as a critical eco-
                                                  Road          Distance in meters to     Accessibility: roads facilitate access to a     (3)
logical corridor within the SMMR.                               the nearest road          conservation area, leading to an increase
                                                                (Euclidean distance)      in detection risk
Data collection
                                                  River         Distance in meters to     Accessibility: riverbanks or streambeds         (3)
   Currently, the BCA is managed by 23 for-
                                                                the nearest river         areas provide access for illegal activity
est rangers registered in the SMART-Lawin                       (Euclidean distance)      and denser vegetation suitable for illegal
system, though only 18 members regularly                                                  settlements
join the patrols. These forest rangers are
grouped into four teams, each in charge of        Settlement    Distance in meters to     Accessibility: most accessible areas if the     (3)
                                                                the nearest settlement    (permanent/temporary)
patrolling one of the four patrol sectors                       (Euclidean distance)      settlements are in close proximity to the
over an average distance of 6 km. Each                                                    conservation area
team conducts three patrols a month on
average (8 h per patrol). With the aid of         Land cover    Generalized categories Availability of resources: areas of intact         (4)
                                                                for Philippine land cover forest cover provide more available
the SMART-Lawin system, the forest
                                                                classification (i.e closed resources and suitable habitat for wildlife
rangers recorded 3554 observations (ap-                         forest, open forest, etc.)
proximately 1184 per year) within the BCA
over the three years from 2017 to 2019.           Topographic Index of soil moisture      Availability of resources: high wetness         (2)
                                                  wetness                                 and close proximity to water are
   We obtained data for the occurrence of il-
                                                                                          associated with a high animal density
legal activity over the entire BCA from the
SMART-Lawin system for the period of Jan-
uary 2017 to December 2019, which were
collected by the forest rangers during their    variance inflation factor (VIF) was used to      the corrected delta-Akaike information cri-
patrols. The spatial data were recorded in      test the multicollinearity of the predictors;    terion (ΔAICc), with priority given to those
the SMART-Lawin database using Cyber-           any predictor with a VIF greater than 5 was      with an ΔAICc < 2 as the best model for
Tracker, an open-source mobile application      removed from further analysis (Hair et al.       each illegal activity category. We then used
(USAID/B+WISER 2018).                           2014).                                           the area under the receiver operating
   We converted the occurrence data for il-                                                      curve (AUCTEST) to select the most appropri-
legal forest activity into spatial point data   Model tuning and processing                      ate model from among the competitive al-
and then categorized these points into            We optimized the models used to identify       ternatives (Denninger Snyder et al. 2019).
three categories: agricultural expansion, in-   the spatial distribution of illegal forest ac-     Applying the optimized FC and RM, we
frastructure expansion, and forest product      tivity using ENMeval. Though MaxEnt mod-         built MaxEnt models to predict the spatial
extraction. We removed unwanted pres-           els are known to be a useful and robust ap-      distribution patterns of the illegal activity
ence records that could influence the prob-     proach to spatial prediction (Elith et al.       categories. Based on the results, we gener-
ability distribution of the models based on     2006, Phillips et al. 2006), overfitting, com-   ated predictive maps and analyzed the in-
three criteria: (i) the point location was      plexity, and bias are common issues, and         fluence of environmental covariates, ob-
outside the study area; (ii) the records        these can be effectively addressed in ENM-       tained evaluation metrics, and evaluated
were duplicated (i.e., same date and coor-      eval (Radosavljevic & Anderson 2014,             the contribution of each predictor variable
dinates); and (iii) thinning of the data was    Merow et al. 2013). We investigated the op-      to the final model (Phillips et al. 2004).
possible (i.e., only retaining one occurrence   timal parameter settings, particularly the
point per grid pixel). The final dataset con-   regularization multiplier (RM) and feature       Model evaluation
sisted of 259 occurrence records, with 65,      classes (FCs), to overcome these issues.           We used k-fold cross-validation to evalu-
147, and 47 occurrences of agricultural ex-     For MaxEnt modeling and validation, we           ate the model by partitioning the occur-
pansion, infrastructure expansion, and for-     used 80% of the presence data as training        rence data into training and testing sets.
est product extraction, respectively. These     data and the remaining 20% for testing to        MaxEnt randomly partitions training and
were used to model the distribution of the      determine the distribution of illegal activity   testing sets based on user-defined k values,
illegal activity categories.                    and the accuracy of each model.                  which can inflate model performance met-
                                                  Initially, we identified the optimal combi-    rics due to spatial autocorrelation (Rado-
Environmental predictors                        nation of FCs and the RM for the three ille-     savljevic & Anderson 2014). To avoid over-
  Seven environmental variables at a 30 ×       gal forest activity categories using ENM-        fitting, we partitioned illegal activity occur-
30 m resolution (elevation, slope, wetness,     eval, which generates a series of MaxEnt         rence and background points into four sets
land cover, and distance from roads, rivers,    model candidates for particular parameter        (coarse-grained and fine-grained) using the
and settlements – Tab. 1) were used as po-      settings. There were six FCs (L, LQ, H, LQH,     “checkerboard2” partitioning scheme
tential predictors of illegal forest activity   LQHP, and LQHPT), where L, Q, H, P, and T        (Denninger Snyder et al. 2019, Muscarella
(Plumptre et al. 2014, Critchlow et al. 2015,   represent linear, quadratic, hinge, product,     et al. 2014). The AUCTEST (Elith et al. 2011)
2017, Denninger Snyder et al. 2019). All spa-   and threshold features, respectively, and        and true skill statistic (TSS – Allouche et al.
tial data were processed for input into the     we tested RM values of 0.5, 1, 1.5, 2, 2.5, 3,   2006) were used to assess the perfor-
Ecological Niche Model Evaluation (ENM-         3.5, and 4. The parameters used for the          mance of the final models for each illegal
eval) v. 0.3.0 package (Muscarella et al.       MaxEnt models are summarized in Tab. 2.          activity category.
2014) in R v. 3.5.1 (R Core Team 2020). The     The optimal models were selected using             The AUC is a strong independent thresh-

iForest 15: 63-70                                                                                                                               65
Barit JB et al. - iForest 15: 63-70
Spatial analysis
iForest – Biogeosciences and Forestry
Tab. 2 - List of significant MaxEnt parameters used to fine-tune the models for each We analyzed the predictive model for the
illegal activity category. (*): FC and RM parameters are the output of the ENMeval spatial distribution of each illegal activity
tuning process. by: (i) assessing the spatial extent of each
illegal activity by its coverage; and (ii) esti-
MaxEnt MaxEnt Tuned Model mating the overall risk of illegal activity
Selection
Parameter Default Parameters
across the landscape. First, we assessed
Feature class (FC) Linear (L) Auto: *Agricultural Expansion = LQHPT the potential spatial extent of each illegal
Quadratic (Q) LQH *Infrastructure Expansion = LQHP activity by reclassifying the MaxEnt output
Product (P) *Forest Product Extraction = LQ of each pixel into likely and unlikely areas
Threshold (T)
for the illegal activity using the 10 th per-
Hinge (H)
Auto centile logistic threshold. Second, we as-
sessed the overall risk of illegal activity
Regularization Number >=0.5 in 1.0 *Agricultural Expansion = 2.5 across the landscape by summing the num-
multiplier (RM) steps of 0.5 *Infrastructure expansion = 1
ber of illegal activity occurrences exceed-
*Forest Product Extraction = 1.5
ing the threshold for each pixel, as deter-
Maximum number of Number 10,000 20,000 mined above; we represented the likeli-
background points hood of any illegal activity taking place at a
Maximum iterations Number 500 1,000 particular location with four risk levels
Output format Loglog, Logistic, Cloglog Raw and Logistic from 0 (none risk) to 3 (high risk).
Cumulative, Raw
Results
Tab. 3 - MaxEnt parameter settings used in the study and the evaluation metric re- Model selection and performance
sults. (§): selected optimal model with ΔAICc < 2 for each illegal forest activity. (- -): evaluation
values were not computed because it was not considered an optimal model; (Th*): We developed 144 MaxEnt models (48 for
the logistic threshold value for the 10th percentile minimum training presence. each illegal activity category) for various
combinations of the RM and FC (Tab. S1 in
Illegal Activity Avg
Supplmentary material). We obtained opti-
n FC RM ΔAICc AUCTRAIN TSS Th* mal parameter sets for each illegal activity
Category AUCTEST
§
according to the model selection criteria
Agricultural 65 LQHPT 2.5 0 0.8880 0.9158 0.6130 0.083
(Tab. 3). We employed RM values of 2.5, 1,
expansion
and 1.5, and the FC classes LQHPT, LQHP,
Infrastructure 147 LQHP 1 0§ 0.8055 0.8594 0.4420 0.191 and LQ for agricultural expansion, infra-
expansion structure expansion, and forest product
Forest product 47 LQH 2.5 0 0.6790 -- -- -- extraction, respectively. The models for all
extraction LQH 2 0.3589 0.6788 -- -- -- categories of illegal activity with optimal
§
parameter settings exhibited acceptable
LQ 1.5 0.5948 0.6973 0.7259 0.2551 0.214
model performance (Denninger Snyder et
LQ 2 1.1455 0.6916 -- -- -- al. 2019). The agricultural and infrastruc-
LQ 2.5 1.8373 0.6849 -- -- -- ture expansion models exhibited good per-
formance (mean AUCTEST = 0.88 and 0.80,
and TSS = 0.613 and 0.442, respectively),
old value that evaluates the ability of a forms better than random chance, and a while that of the product extraction model
model to discriminate presence from ab- high TSS represents the degree of agree- was relatively poor (mean AUC TEST = 0.69
sence points (i.e., background points). The ment between the samples generated by and TSS = 0.26).
resulting average AUC for each model was the MaxEnt model and the background
compared and ranked. The TSS was used prediction model. Therefore, models with Analysis of environmental predictors
as an additional metric because it considers both a high AUC and a high TSS would have The environmental predictors differed in
both omission and commission errors. A greater reliability and robustness. their impact on each illegal forest activity
high AUC indicates that the model per- model, with land cover and proximity to
roads and rivers having the strongest influ-
ence (Fig. 2). Agricultural expansion was
strongly affected by elevation (36%), fol-
lowed by land cover (32%) and roads (19%).
Infrastructure expansion was primarily af-
fected by land cover (34%), roads (27%), and
rivers (12%). Similarly, product extraction
was substantially influenced by land cover
(58%), rivers (18%), and roads (11%).
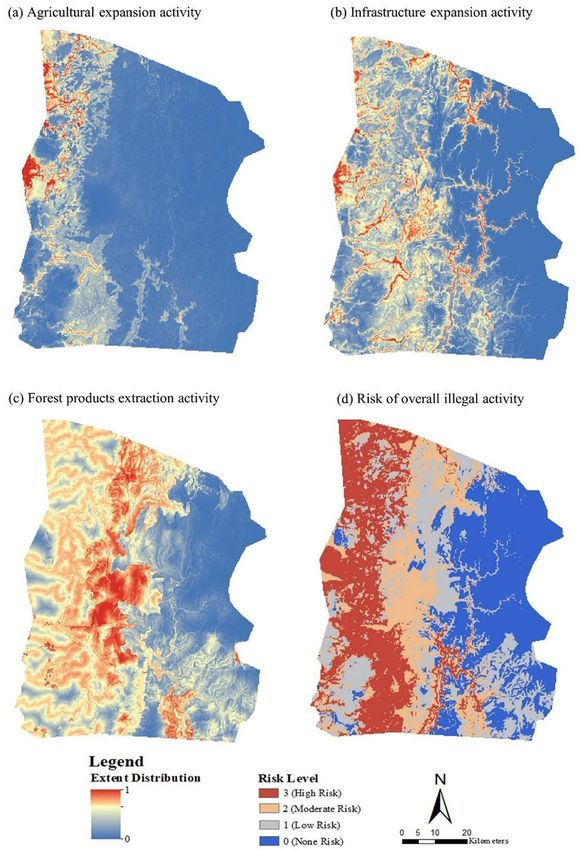
Potential distribution of illegal forest
activity
The predicted spatial distribution for each
illegal activity category varied across the
landscape (Fig. 3). The threshold values for
the presence and absence of agricultural
expansion, infrastructure expansion, and
forest product extraction were 0.083,
0.191, and 0.214, respectively. Forest prod-
Fig. 2 - Importance of each predictor variable to the illegal forest activity models. uct extraction was the most common ille-
66 iForest 15: 63-70Modeling the risk of illegal forest activity in SE Philippines
gal activity across the landscape (66%), fol-
iForest – Biogeosciences and Forestry
Fig. 3 - Spatial cov-
lowed by infrastructure expansion (44%)
erage of the
and agricultural expansion (30% – Tab. 4).
potential distribu-
Of the land cover types, brush/shrub was
tion of each illegal
most likely to be damaged by illegal activity
forest activity cat-
(59,007 ha), followed by open forest
egory (a-c) and the
(28,073 ha) and grasslands (16,405 ha –
level of risk pre-
Tab. 5). The predicted model revealed that
dicted across the
product extraction was most detrimental
study area (d).
to open and closed forest (25,463 ha), fol-
lowed by infrastructure expansion (13,901
ha) and agricultural expansion (173 ha).
The overall risk assessment, which repre-
sents the total frequency of all illegal activ-
ity occurrences, revealed that 25% of the
conservation area was at high risk, 20% at
moderate risk, 25% at low risk, and 30% at
no risk (Fig. 3d).
Discussion
This study demonstrated a method for
predicting the spatial patterns of illegal ac-
tivity in Philippine forests utilizing MaxEnt
models. We classified illegal activity into
three categories: agricultural expansion, in-
frastructure expansion, and forest product
extraction. Predictions of the distribution
of these illegal activity categories were car-
ried out using MaxEnt models based on
seven environmental predictors (i.e., eleva-
tion, slope, roads, rivers, settlements, land
cover, and topographic wetness) and 259
occurrences of illegal activity obtained
from the SMART-Lawin patrolling system.
The optimal MaxEnt models for agricul-
tural expansion and infrastructure expan-
sion produced a high prediction perfor-
mance, with an average AUCTEST of over
0.80, higher than the model for forest According to our results, each illegal ac- reported a very low relationship between
product extraction (AUCTEST = 0.697). We tivity was affected by different environ- land cover and forest product extraction,
found that the distribution and potential mental variables. Agricultural and infra- our results revealed that land cover had a
occurrence of illegal activity were also in- structure expansion demonstrated similar very large influence on the product extrac-
fluenced by the sample size and their spa- patterns in terms of the main environmen- tion model. This contrast in the results
tial extent of distribution. A higher sample tal variables affecting the models. They could be due to a difference in the land
size tends to increase model performance, were evenly affected by land cover and cover types in the respective study areas.
as represented by the AUC, but the pre- roads and slightly affected by the proximity Denninger Snyder et al. (2019) conducted
dicted coverage of each illegal activity had of settlement areas, indicating the gradual their study in the African savanna, where
the opposite effect on the AUC. Because expansion of both types of illegal activity. grassland is the dominant land cover type.
product extraction had fewer observed oc- On the other hand, forest product extrac- On the other hand, our study was carried
currences and its predicted coverage area tion was mainly affected by land cover and out in a region mainly covered by forests.
was almost twice as large as the two other the proximity of roads and rivers, which Because trees are evenly and sparsely dis-
illegal activities, its model had a lower AUC. can be used to transport forest products. tributed in savanna regions, the land cover
Further monitoring of illegal activity in for- Although Denninger Snyder et al. (2019) is not greatly impacted by tree logging; in-
ested areas using the SMART-Lawin system
could help to improve the accuracy of the
model. Tab. 5 - Coverage of illegal activity categories predicted for each land cover type
within the conservation area. (1): Annual crop; (2): Brush/shrubs; (3): Built-up; (4):
Closed forest; (5): Grassland; (6): Inland water; (7): Open forest; (8): Open barren; (9):
Tab. 4 - Coverage of each illegal activity Perennial crop.
category predicted across the conserva-
tion area.
Illegal Activity Land Classification Coverage
Class 1 2 3 4 5 6 7 8 9 (ha)
Illegal Activity Area Coverage
Category (ha) (%) Agricultural 976 19999 99 35 3734 2062 138 79 34 27256
Forest product 59.913 66 expansion
extraction Infrastructure 1166 18247 03 3405 3978 2005 10496 159 63 39722
expansion
Infrastructure 39.721 44
expansion Forest product 1790 20761 15 8024 8693 2214 17439 471 07 59914
Agricultural 27.256 30 extraction
expansion Total (ha) 3932 59007 317 11464 16405 6281 28073 709 704 126892
iForest 15: 63-70 67Barit JB et al. - iForest 15: 63-70
stead, proximity to villages and manage- right predictors is critical when seeking to activity. The present research demon-
iForest – Biogeosciences and Forestry
ment strategies have a greater effect on il- produce accurate and reliable models. In strates the use of a data-driven response
legal activity. However, in the tropical for- this study, we limited our focus to seven to facilitate a better understanding of an
ests in our study area, protected areas usu- important variables that are likely to affect entire conservation area and to provide ac-
ally conserve forests. Therefore, illegal ac- the occurrence of illegal activity. We found curate data that can be used to make in-
tivity tends to occur at locations where it is that land cover was a crucial environmen- formed conservation management deci-
difficult to detect but where it is easy to tal factor that affected the spatial distribu- sions. Applying MaxEnt models that were
transport the products quickly. Therefore, tion of all three illegal activity categories. based on illegal activity occurrence data
forest product extraction tends to be af- Elevation and proximity to roads and rivers collected from the field using the SMART-
fected by the land cover and proximity to were also very important to the accuracy Lawin patrolling system, we successfully
roads and rivers. of the model predictions. However, conser- identified the critical environmental drivers
vation managers are increasingly recogniz- determining illegal activity within the study
Applicability of the model ing the dynamic nature of illegal activity, site. However, this does not mean that the
Although the MaxEnt model is generally especially in response to patrolling or law seven environmental variables that we in-
used to estimate the spatial distribution of enforcement, which is extremely difficult vestigated are best suited for all categories
a species, it has been utilized in many stud- to include in the MaxEnt framework. On of illegal activity. Future research should in-
ies to estimate the spatial patterns of non- the other hand, there have been calls to fo- clude significant environmental predictors
biological items, such as illegal forest activ- cus patrolling efforts on areas with greater that were not used in this study but that
ity, because non-biological items are also conservation value (Plumptre et al. 2014), are likely to affect the occurrence of illegal
determined by environmental factors (Liao so that such illegal activity would eventu- activity. An improved version of the ap-
et al. 2017, Denninger Snyder et al. 2019). ally shift to areas with less conservation proach showcased in this study could be
Therefore, this method is widely used for value. implemented in other priority conservation
developing predictive models to under- areas with wider coverage using a large
stand the potential distribution of illegal Improving the patrol strategy sample size of illegal forest activity gener-
forest activity to assist in the efforts to Our study area in the BCA is 90,448 ha in ated over a longer time period, allowing
manage protected areas (Denninger Sny- size, which is covered by four patrol teams. for more effective patrol strategies. How-
der et al. 2019). However, it is difficult to This means that each team is responsible ever, it is important to note that the behav-
minimize the effects of spatial autocorrela- for patrolling over 20,000 ha. Given the lim- ior of poachers or violators is likely to
tion, particularly when the occurrences of ited human and logistic resources, it is al- change in response to changes in patrol
illegal activity are clustered. Therefore, this most impossible to cover the entire area in strategies (Keane et al. 2011, Critchlow et
approach may work well in large conserva- a systematic manner. Unfortunately, this al. 2017). Our study has also made it possi-
tion areas, especially when patrol efforts lack of conservation resources is not un- ble to predict locations with a high poten-
are systematically distributed over the en- common for most protected areas in the tial for illegal activity, which is helpful for
tire region. In our study, identifying areas tropics. The large patrol coverage area and improving the patrol strategy within pro-
that lack patrol coverage and variables that the limited budget and human resources, tected areas.
are poorly represented and including these hinder the effective implementation of law
in future patrols will be critical to improv- enforcement strategies (Plumptre et al. Acknowledgements
ing the modeling approach. 2014, Denninger Snyder et al. 2019). This research was supported by the Na-
The modeling approach presented here Under these circumstances, we believe tional Research Foundation of Korea (NRF)
also needs to include other relevant predic- our results can be used to improve pa- grant funded by the Korea government
tor variables such as (i) human and live- trolling by shifting focus to three specific (MSIT, no. NRF-2017R1A2B4010460), and
stock density, (ii) employment and income goals. The first should be to focus efforts R&D Program for Forest Science Technol-
levels, which have been linked to illegal re- on a specific illegal forest activity. In this ogy (Project No. 2019150B10-21230301)
source use (Critchlow et al. 2015), and (iii) case, the output map for the extent of the funded by the Korea Forest Service (Korea
distance to ranger camps and patrol posts illegal activity can be used to identify the Forestry Promotion Institute).
(Denninger Snyder et al. 2019). However, target areas for a particular illegal activity.
any rapid changes, such as the shift in the The second goal should be detecting as List of Abbreviations
location of illegal activity hotspots occur- many types of illegal activity as possible at The following abbeviations have been
ring in response to patrolling, land-use once. In this case, the moderate- to high- used along the paper:
changes, or other socio-economic reasons, risk areas identified in the risk assessment • AICc: Corrected Akaike Information Crite-
may be difficult to include in the model, es- map can provide the best information. The rion;
pecially if the patrols are ground-based. A third goal should be to focus on conserving • ΔAICc: Corrected Delta Akaike Informa-
combination of low-cost and easily deploy- and protecting the most valuable areas, tion Criterion;
ed unmanned aerial vehicles (UAVs) and such as protected areas and vulnerable ar- • ASCII: American Standard Code II;
high-resolution, freely available remote eas covered with intact forest (closed/ • ASTER: Advanced Spaceborne Thermal
sensing images with SMART-Lawin data open forest). In this case, overlaying the Emission and Reflection Radiometer;
would thus be beneficial. risk map for each illegal activity with land • AUC: Area Under the Curve;
cover or forest maps will be useful. • AUCTEST: Area Under the Curve for the
Optimal strategy for mitigating illegal Test Dataset;
activity Conclusion • BCA: Baliuag Conservation Area;
The results of this study can be used to It is important for conservation area man- • DEM: Digital Elevation Model;
deploy patrol teams that prioritize high-risk agers to identify the drivers determining • ENMeval: Ecological Niche Model Evalua-
areas. Managers can either target the de- the occurrence of illegal activity and the lo- tion;
terrence of a specific illegal activity or a cations where it is most likely to occur • FC: Feature Classes;
combination of multiple illegal activities. within their areas of jurisdiction in order to • FCA: Forest Conservation Area;
However, our results are limited by the effectively implement forest protection • FMB: Forest Management Bureau;
range of variables used in developing the and law enforcement. Because there are • MaxEnt: Maximum Entropy;
model. According to Critchlow et al. (2015), vast areas of forest with high biodiversity • RM: Regularization Multiplier;
the selection of variables plays a decisive in the Philippines, the optimal spatial allo- • SMART: Spatial Monitoring and Reporting
role in the resulting distribution of predict- cation of limited patrolling resources must Tool:
ed illegal activity. Therefore, identifying the be carried out to effectively prevent illegal • SMART-Lawin: Lawin Forest and Biodiver-
68 iForest 15: 63-70Modeling the risk of illegal forest activity in SE Philippines
sity Protection System; prove prediction of species’ distribution from tion 5: 1198-1205. - doi: 10.1111/2041-210X.12261
iForest – Biogeosciences and Forestry
• SMMR: Sierra Madre Mountain Range; occurrence data. Ecography 29 (2): 129-151. - Muscarella R, Galante PJ, Soley-Guardia M, Boria
• TSS: True Skill Statistics; doi: 10.1111/j.2006.0906-7590.04596.x RA, Kass JM, Uriarte M, Anderson RP (2017).
• VIF: Variance Inflation Factor. Elith J, Leathwick JR (2009). Species distribution Package “ENMeval”, version 0.3.0. Web site.
models: ecological explanation and prediction [online] URL: http://cran.r-project.org/web/pa
References across space and time. Annual Review of Ecol- ckages/ENMeval/index.html
Allouche O, Tsoar A, Kadmon R (2006). Assess- ogy Evolution and Systematics 40: 677-697. - Phillips SJ, Dudík M, Schapire RE (2004). A maxi-
ing the accuracy of species distribution models: doi: 10.1146/annurev.ecolsys.110308.120159 mum entropy approach to species distribution
prevalence, kappa and the true skill statistic Elith J, Phillips SJ, Hastie T, Dudík M, Chee YE, modelling. In: Proceedings of the “21st Interna-
(TSS). Journal of Applied Ecology 43: 1223-1232. Yates CJ (2011). A statistical explanation of tional Conference on Machine Learning” (Grei-
- doi: 10.1111/j.1365-2664.2006.01214.x MaxEnt for ecologists. Diversity and Distribu- ner R, Shuurmans D eds). ACM Press, Banff,
Bisson J, Guiang ES, Walpole P, Tolentino D tions 17 (1): 43-57. - doi: 10.1111/j.1472-4642.2010. Canada, New York, USA, pp. 655-662.
(2003). Better governance critical to reversing 00725.x Phillips SJ, Anderson RP, Schapire RE (2006).
forest degradation in Southeast Asia. In: Pro- Finger A, Stolton S, Dudley N (1999). Metals Maximum entropy modelling of species geo-
ceedings of the “12th World Forestry Congress”. from the forests. Mining and forest degrada- graphic distributions. Ecological Modelling 190:
UN-FAO (Québec City, Canada), no. 0837-A4. tion. IUCN and WWF, Gland, Switzerland. pp. 231-259. - doi: 10.1016/j.ecolmodel.2005.03.026
[online] URL: http://www.fao.org/3/XII/0837-A4 36. Plumptre AJ, Fuller RA, Rwetsiba A, Wanyama F,
.htm Geronimo MC, Marie Grace Cabansag S, Agnes Kujirakwinja D, Driciru M, Nangendo G, Watson
Carandang AP, Bugayong LA, Dolom PC, Garcia Reyes S (2016). Indigenous utilization of re- JEM, Possingham HP (2014). Efficiently target-
LN, Villanueva MMB, Espiritu NO (2013). Analy- sources and conservation practices of the Agta ing resources to deter illegal activities in pro-
sis of key drivers of deforestation and forest of Lupigue, Ilagan City, Isabela, Philippines. In: tected areas. Journal of Applied Ecology 51 (3):
degradation in the Philippines. Deutsche Gesell- “EDUCARE” International Journal for Educa- 714-725. - doi: 10.1111/1365-2664.12227
schaft für Internationale Zusammenarbeit (GIZ) tional Studies, Minda Masagi Press and UMP R Core Team (2020). R: a language and environ-
GmbH, Manila, Philippines, pp. 110. PurwokertoBandung, Indonesia, Vol. 8 (2), pp. ment for statistical computing. R Foundation
Critchlow R, Plumptre AJ, Driciru M, Rwetsiba A, 115-128. [online] URL: http://www.journals.mind for Statistical Computing, Vienna, Austria. [on-
Stokes EJ, Tumwesigye C, Wanyama F, Beale amas.com/index.php/educare/article/view/749 line] URL: http://www.r-project.org/
CM (2015). Spatiotemporal trends of illegal ac- Hair JF, Black WC, Babin BJ, Anderson RE (2014). Radosavljevic A, Anderson RP (2014). Making
tivities from ranger-collected data in a Ugan- Multivariate data analysis. Pearson Education better Maxent models of species distributions:
dan national park. Conservation Biology 29 (5): Limited, Harlow, UK, pp. 734. complexity, overfitting and evaluation. Journal
1458-1470. - doi: 10.1111/cobi.12538 Jones KR, Venter O, Fuller RA, Allan JR, Maxwell of Biogeography 41 (4): 629-643. - doi: 10.1111/
Critchlow R, Plumptre AJ, Alidria B, Nsubuga M, SL, Negret PJ, Watson JEM (2019). One-third of jbi.12227
Driciru M, Rwetsiba A, Wanyama F, Beale CM global protected land is under intense human Remedio EM (2009). An analysis of sustainable
(2017). Improving law-enforcement effective- pressure. Science 360: 788-791. - doi: 10.1126/sci fuelwood and charcoal production systems in
ness and efficiency in protected areas using ence.aap9565 the Philippines: a case study. In: “Criteria and
ranger-collected monitoring data. Conservation Keane A, Jones JPG, Edwards-Jones G, Milner- indicators for sustainable woodfuels: case stud-
Letters 10: 572-580. - doi: 10.1111/conl.12288 Gulland EJ (2011). Encounter data in resource ies from Brazil, Guyana, Nepal, Philippines and
Denninger Snyder K, Mneney PB, Wittemyer G management and ecology: pitfalls and possibili- Tanzania” (Rose S, Remedio EM, Trossero MA
(2019). Predicting the risk of illegal activity and ties. Journal of Applied Ecology 48: 1164-1173. - eds), FAO, Rome, Italy, pp. 133-194. [online]
evaluating law enforcement interventions in doi: 10.1111/j.1365-2664.2011.02034.x URL: http://www.fao.org/3/i1321e/i1321e08.pdf
the western Serengeti. Conservation Science Kummer DM (1992). Upland agriculture, the land Rubas-Leal LC, Washington-Allen RA, Popescu
and Practice 1 (9): 534. - doi: 10.1111/csp2.v1.9 frontier and forest decline in the Philippines. SC, Conner JR (2017). Estimation of above-
DENR-PAWB (2009). New conservation areas in Philippine Agroforestry Systems Publications ground biomass in Mt. Apo natural park in the
the Philippines project (NewCAPP). Threats to 18: 31-46. - doi: 10.1007/BF00114815 Southern Philippines using terrestrial LiDAR
Philippine biodiversity, Department of Environ- Lasco RD, Pulhin FB, Sanchez PJ, Villamor GB, Vil- system. BANWA Series B 12: res005. [online]
ment and Natural Resources-Protected Areas legas KAL (2008). Climate change and forest URL: http://ojs.upmin.edu.ph/index.php/banwa-
and Wildlife Bureau, Manila, Philippines, pp. 3- ecosystems in the Philippines: vulnerability, b/article/view/325
5. adaptation and mitigation. Journal of Environ- Torres AM, Pulhin FB, Lasco RD, Tiburan CL, Es-
DENR (2015). Integrated watershed manage- mental Science and Management 11 (1): 1-14. lava DF (2016). Modeling future spatial distribu-
ment plan (IWMP) for Angat - Watershed for- Liao Y, Lei Y, Ren Z, Chen H, Li D (2017). Predict- tion of Shorea palosapis (Blanco) Merr and
est reserve. Department of Environment and ing the potential risk area of illegal vaccine Shorea polysperma (Blanco) Merr in Northern
Natural Resources- Region 3, San Fernando, trade in China. Scientific Reports 7 (1): 3883. Sierra Madre natural park using Maxent. Jour-
Pampanga, Philippines, pp. 10-18. Mallari NMD, Jensen A (1993). Biological diver- nal of Environmental Science and Management
DENR-FMB (2018). Philippine forestry statistics sity in norther Sierra Madre, Philippines: its im- 2016 (1): 15-30. [online] URL: http://ovcre.uplb.
2018. Department of Environment Natural Re- plication for conservation and management. edu.ph/journals-uplb/index.php/JESAM/article/v
sources - Forest Management Bureau R, Mani- Asia Life Sciences 2 (2): 101-112. iew/485
la, Philippines, pp. 92. [online] URL: http:// Merow C, Smith MJ, Silander JA (2013). A practi- Tumaneng MR, Tumaneng R, Tiburan CL (2019).
forestry.denr.gov.ph/index.php/statistics/philip cal guide to MaxEnt for modeling species’ dis- Modeling species distribution of Shorea guiso
pines-forestry-statistics tributions: what it does, and why inputs and (blanco) Blume and Parashorea malaanonan
Domingo SN, Manejar AJA (2018). Forest protec- settings matter. Ecography 36: 1058-1069. - doi: (blanco) Merr in mount Makiling forest reserve
tion in the Philippines. Discussion Paper Series 10.1111/j.1600-0587.2013.07872.x using Maxent. ISPRS - International Archives of
no. 2018-53, Philippine Institute of Develop- Minter T, Van Der Ploeg J, Pedrablanca M (2014). the Photogrammetry, Remote Sensing and
ment Studies, Quezon City, Philippines, pp. 48- Limits to indigenous participation: the Agta and Spatial Information Sciences, pp. 441-448. [on-
52. the Northern Sierra Madre natural park, the line] URL: http://noa.gwlb.de/servlets/MCRFile
Elith J, Graham CH, Anderson RP, Dudik M, Fer- Philippines. Human Ecology 42 (5): 769-778. - NodeServlet/cop_derivate_00049506/isprs-arc
rier S, Guisan A, Hijmans RJ, Huettmann F, doi: 10.1007/s10745-014-9673-5 hives-XLII-4-W19-441-2019.pdf
Leathwick JR, Lehmann A, Li J, Lohmann LG, Muscarella R, Galante PJ, Soley-Guardia M, Boria USAID/B+WISER (2018). The Lawin forest and
Loiselle BA, Manion G, Moritz C, Nakamura M, RA, Kass JM, Uriarte M, Anderson RP (2014). biodiversity protection system manual. Module
Nakazawa Y, Overton Mc JC, Peterson AT, Phil- ENMeval: An R package for conducting spatial- 2: purpose-driven patrolling. Chemonics Inter-
lips SJ, Richardson KS, Scachetti-Pereira R, ly independent evaluations and estimating opti- national Inc, Washington, DC, USA. [online]
Schapire RE, Soberón J, Williams S, Wisz MS, mal model complexity for MAXENT ecological URL: http://forestry.denr.gov.ph/index.php/pub
Zimmermann NE (2006). Novel methods im- niche models. Methods in Ecology and Evolu- lications/2020
iForest 15: 63-70 69Barit JB et al. - iForest 15: 63-70
Van Der Ploeg J, Van Weerd M, Masipiqueña AB, of the “4th Regional Conference on Environ- totenv.2018.04.112
iForest – Biogeosciences and Forestry
Persoon GA (2011). Illegal logging in the North- ment and Development” (van der Ploeg J,
ern Sierra Madre Natural Park, the Philippines. Masipiquena AB, Bernando EC eds). CVPED, Is- Supplementary Material
Conservation and Society 9 (3): 202-215. [on- abela, The Philippines, pp. 443.
line] URL: http://www.jstor.org/stable/263930 Zhang K, Yao L, Meng J, Tao J (2018). Maxent Tab. S1 - ENMeval results for the three ille-
43 modeling for predicting the potential geo- gal activity classifications.
Van Der Ploeg J, Masipiquena AB, Bernando EC graphical distribution of two peony species un-
(2003). The Sierra Madre mountain range: der climate change. Science of The Total Envi- Link: Barit_3937@suppl001.xlsx
global relevance, local realities. In: Proceedings ronment 634 (10): 1326-1334. - doi: 10.1016/j.sci
70 iForest 15: 63-70You can also read