Molecular dynamics simulation study on the effect of perfluorosulfonic acid side chains on oxygen permeation in hydrated ionomers of PEMFCs - Nature
←
→
Page content transcription
If your browser does not render page correctly, please read the page content below
www.nature.com/scientificreports
OPEN Molecular dynamics
simulation study on the effect
of perfluorosulfonic acid side chains
on oxygen permeation in hydrated
ionomers of PEMFCs
Sung Hyun Kwon1,6, Haisu Kang1,6, Young‑Jun Sohn2,3, Jinhee Lee4, Sunbo Shim4* &
Seung Geol Lee1,5*
We prepared two types of perfluorosulfonic acid (PFSA) ionomers with Aquivion (short side chain) and
Nafion (long side chain) on a Pt surface and varied their water contents (2.92 ≤ λ ≤ 13.83) to calculate
the solubility and permeability of O2 in hydrated PFSA ionomers on a Pt surface using full atomistic
molecular dynamics (MD) simulations. The solubility and permeability of O2 molecules in hydrated
Nafion ionomers were greater than those of O2 molecules in hydrated Aquivion ionomers at the
same water content, indicating that the permeation of O2 molecules in the ionomers is affected not
only by the diffusion coefficient of O2 but also by the solubility of O2. Notably, O2 molecules are more
densely distributed in regions where water and hydronium ions have a lower density in hydrated
Pt/PFSA ionomers. Radial distribution function (RDF) analysis was performed to investigate where
O2 molecules preferentially dissolve in PFSA ionomers on a Pt surface. The results showed that
O2 molecules preferentially dissolved between hydrophilic and hydrophobic regions in a hydrated
ionomer. The RDF analysis was performed to provide details of the O2 location in hydrated PFSA
ionomers on a Pt surface to evaluate the influence of O2 solubility in ionomers with side chains of
different lengths. The coordination number of C(center)–O(O2) and O(side chain)–O(O2) pairs in
hydrated Nafion ionomers was higher than that of the same pairs in hydrated Aquivion ionomers with
the same water content. Our investigation provides detailed information about the properties of O2
molecules in different PFSA ionomers on a Pt surface and with various water contents, potentially
enabling the design of better-performing PFSA ionomers for use in polymer electrolyte membrane fuel
cells.
Polymer electrolyte membrane fuel cells (PEMFCs) are environmentally friendly energy sources that can allevi-
ate environmental problems because of their low emissions of environmental pollutant gases such as S Ox, NOx,
CO2, and CO1,2. PEMFCs have been used in various applications such as fuel-cell vehicles and power supplies
(including portable power supplies) because, in addition to their ecofriendly benefits, PEMFCs can also generate
high power densities and operate with short start-up times because of their low operating temperature1,3–5. In
general, PEMFCs consist of membrane electrode assembly (MEA) layers, gas-diffusion layers, microporous lay-
ers, gas flow channels, and bipolar plates3. The MEA layers are especially important because the cell performance
and durability of PEMFCs are strongly affected by the design and composition of their MEA layers4. MEA layers
in a PEMFC system comprise catalyst layers (CLs) and a polymer membrane; the polymer membrane plays a
1
School of Chemical Engineering, Pusan National University, 2, Busandaehak‑ro 63beon‑gil, Geumjeong‑gu,
Busan 46241, Republic of Korea. 2Fuel Cell Laboratory, Korea Institute of Energy Research (KIER), Yuseong‑gu,
Daejeon 34129, Republic of Korea. 3Advanced Energy and System Engineering, University of Science and
Technology, Gajeong‑ro 217, Yuseong‑gu, Daejeon, 34113 Daejeon, Republic of Korea. 4Hyundai Motor Company,
17‑5, Mabuk‑ro 240, Giheung‑gu, Yongin‑si, Gyeonggi‑do, Yongin‑si 16891, Republic of Korea. 5Department
of Organic Material Science and Engineering, Pusan National University, 2, Busandaehak‑ro 63beon‑gil,
Geumjeong‑gu, Busan 46241, Republic of Korea. 6These authors contributed equally: Sung Hyun Kwon and Haisu
Kang. *email: sunbo.shim@hyundai.com; seunggeol.lee@pusan.ac.kr
Scientific Reports | (2021) 11:8702 | https://doi.org/10.1038/s41598-021-87570-8 1
Vol.:(0123456789)
www.nature.com/scientificreports/
critical role in transferring protons from the anode to the cathode in the process of generating e lectricity5. CLs
also play a critical role because the electrochemical reactions related to energy conversion in a PEMFC, such
as the hydrogen oxidation reaction or oxygen reduction reaction (ORR), occur in CLs. The structure of CLs
includes a carbon matrix with a Pt catalyst (Pt/C) and proton-conducting ionomers. Importantly, the proton
transfer performance of a CL is affected by its ionomer thin film on Pt/C because protons can directly reach the
Pt surface through the hydrated ionomer thin film. Therefore, the composition and morphology of the ionomers
strongly influence the performance of a PEMFC.
The proton-conducting ionomers in PEMFCs are categorized as a perfluorinated acid (PFSA), nonfluorinated
hydrocarbon, or an acid–base c omplex1. Among these various polymer ionomers, PFSA ionomers such as Nafion
(DuPont)6,7, Aquivion (Dow Chemical)8,9, Aciplex-S (Asahi Glass)10, and Flemion (Asahi Glass)10,11 have been
extensively used in PEMFCs because of their excellent proton conductivity and good mechanical, chemical, and
thermal stabilities12. PFSA-based ionomers are composed of main chains of polytetrafluoroethylene (PTFE) and
side chains terminated by sulfonic acid groups. Both e xperimental13–15 and t heoretical16–24 investigations have
been performed to elucidate the proton transfer and O2 permeation mechanisms in PEMFC systems because
the length of the side chains in PFSA ionomers affects PEMFC performance.
Garsany et al.13 and Siracusano et al.14 experimentally investigated PFSA ionomers—specifically, Aquivion,
which has a short side chain, and Nafion, which has a long side chain—to improve PEMFC performance. They
concluded that Aquivion exhibits better cell performance than Nafion in PEMFCs because the Aquivion iono-
mer in the cathode CLs has a lower proton transport resistance, lower charge transfer resistance for the ORR,
and lower mass transport resistance than the Nafion ionomer. Baschetti et al.15 investigated gas permeation in
Nafion and Aquivion ionomers at various temperatures and relative humidities. Humidity and temperature
have especially strong effects on gas permeability, and Nafion 117 ionomer was found to exhibit greater O 2 gas
permeability than Aquivion at 50 ℃.
Several groups have investigated the relationship between the diffusion coefficients of water and hydro-
nium ions and PFSA morphologies in systems with various water contents and at different temperatures using
molecular dynamics (MD) s imulations16–21. The diffusion coefficients of water and hydronium ions were found
to increase with increasing PFSA water content and increasing temperature. In addition, the sulfur–sulfur intera-
tomic distance in PFSA increased with increasing PFSA water content. MD simulations22–24 have also been per-
formed to investigate O2 permeation in Nafion ionomers in CLs. Kurihara et al.22,23 investigated the permeation
of O2 gas into a Nafion ionomer on a Pt surface using MD simulations because such simulations are useful for
understanding the nanoscale structures in the CLs of PEMFCs. They concluded that the diffusion coefficient of
O2 molecules increased and the solubility of O 2 molecules decreased with increasing water content in the Nafion
ionomer. Jinnouchi et al.24 also used MD simulations to investigate O 2 permeation through a Nafion thin film on
a Pt surface, where the water content of the Nafion film was varied. Their results indicated that O
2 permeation in
Nafion increased with increasing water content and that understanding the behavior of O 2 in PFSA ionomers on
a Pt surface is critical to understanding its permeation properties. Therefore, the aforementioned experimental
results indicate that the length of the side chain in PFSA ionomers can affect both the performance of PEMFCs
and the O 2 permeation behavior. Therefore, studies comparing of the O 2 permeation properties of Nafion and
Aquivion are needed to elucidate the effect of side-chain length in PFSA ionomers in PEMFCs.
In the present study, computational simulations using the full atomistic MD simulation technique are carried
out to obtain detailed molecular information for calculating the transport properties of hydrated PFSA ionomers
with various water contents on a Pt surface. In addition, the O
2 permeation properties of hydrated PFSA with dif-
ferent side-chain lengths were measured at the interfacial region on the Pt surface. Therefore, two types of PFSA
ionomers—Nafion (longer side chain) and Aquivion (shorter side chain)—were prepared for measurement of the
O2 permeability at various water contents, enabling the relationship between the hydrated PFSA structure and
the O2 permeation properties to be elucidated. In addition, the distribution of O2 and water in PFSA ionomers
on a Pt surface were also analyzed using density profiles and radial distribution functions (RDFs) with various
water contents at the operating temperature of a PEMFC (353.15 K). We expect that the results of this study will
provide detailed information about O 2 permeability of water-containing PFSA ionomers on a Pt surface and can
provide guidance for the design of PFSA ionomers for use in PEMFCs.
Computational details
Model preparation. Figure 1 shows the chemical structures of the Nafion and Aquivion ionomers. Each
ionomer was composed such that each polymer had 10 repeat units with 10 sulfonic acid groups per polymer
chain. The molecular weight of the Nafion and Aquivion polymers was 9969.83 g/mol and 8309.63 g/mol per
polymer chain; equivalent weights (EWs) of ~ 1000 g/mol and ~ 830 g/mol were applied, respectively. Water, O
2
molecules, and hydronium ions were prepared for constructing hydrated PFSA ionomers. The components of
each PEMFC system are summarized in Table 1. Materials Studio visualization software was used for the atomic
visualization25.
Force‑field and MD parameters. To describe inter- and intramolecular interactions in the Nafion and
Aquivion in PEMFC systems, we applied a modified DREIDING force field26 in our simulations. The DREI-
DING force field has been widely used to describe PEMFCs s ystems27–33. The force fields of water molecules and
Pt atoms were applied using F3C force fi eld34 and the embedded-atom method (EAM) force field, r espectively35.
The total potential energy Etotal in PEMFC systems can be calculated using to Eq. (1):
Etotal = EvdW + EQ + Ebond + Eangle + Etorsion + Einversion + EEAM (1)
Scientific Reports | (2021) 11:8702 | https://doi.org/10.1038/s41598-021-87570-8 2
Vol:.(1234567890)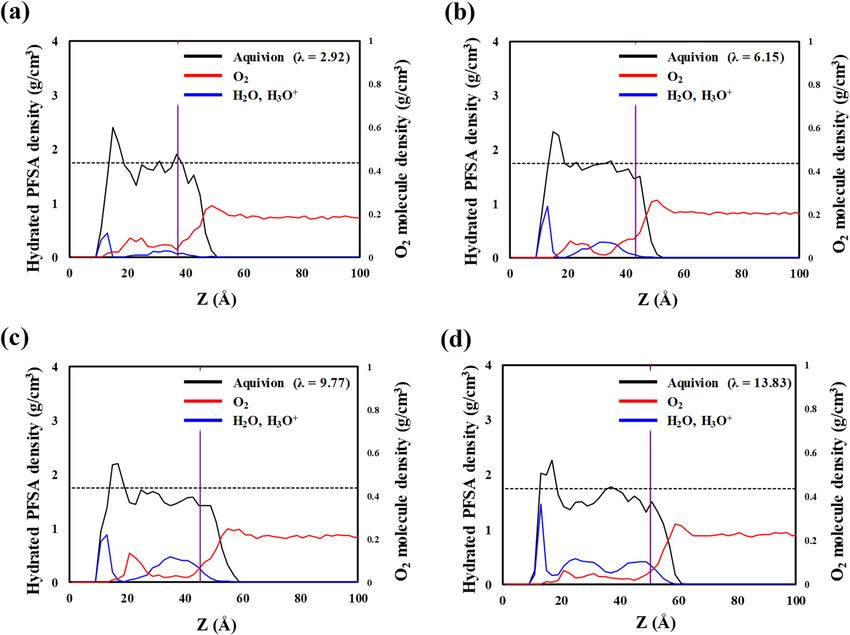
www.nature.com/scientificreports/
Figure 1. Chemical structures of PFSA component at (a) ionized Nafion (EW = 1000), (b) ionized Aquivion
(EW = 830), and (c) water, (d) hydronium ion, and (e) O2 molecules.
λ = 2.92 λ = 6.15 λ = 9.77 λ = 13.83
No. of water molecules 115 309 526 770
No. of hydronium ions 60 60 60 60
No. of O2 molecules 735
No. of PFSA chains (DP 10) (Nafion or Aquivion) 6
Table 1. Details of parameters for the MD simulations.
Figure 2. (a) The optimized structures of O2 molecules on the Pt (111) surface. (b) The change in potential
energies according to changes in distance between O 2 and the Pt (111) surface, as determined using DFT
calculations, fitting data, and DREIDING force field.
where EvdW , EQ, Ebond , Eangle, Etorsion, Einversion, and EEAM are the van der Waals, electrostatic, bond-stretching,
angle-bending, torsion, inversion, and the EAM energies, respectively. For calculating entire MD simulations
for PEMFC systems, the large-scale atomic/molecular massively parallel simulator (LAMMPS) code36,37 from
Plimpton at Sandia was used. All MD simulations were carried out using the velocity Verlet a lgorithm38 to inte-
grate equations of atomic motion, with a time steps of 1 fs. The electrostatic interactions in our systems were
calculated using the particle–particle particle–mesh method39. The charges of particles in Nafion and Aquivion
were calculated via density functional theory (DFT) calculations using the Mulliken charge analysis method40
in the Materials Studio s oftware25. All DFT calculations for charge analyses were carried out using the double
numerical basis set with polarization (DNP) function and the generalized gradient approximation with the
Perdew–Burke–Ernzerhof functional41.
Force‑field parameters between PEMFC components and the Pt surface. We used the non-
bonded interaction energies reported by Brunello et al.42 to describe the interactions of Pt atoms with Nafion,
Aquivion, water, and hydronium ions. In addition, for the interaction energies between O 2 and a Pt slab, we
calculated van der Waals parameters via DFT calculations to describe detailed intermolecular interactions using
a Pt (111) slab with three atomic layers with periodic boundary conditions (PBCs) of 8.324 × 8.324 × 25.000 Å3,
Scientific Reports | (2021) 11:8702 | https://doi.org/10.1038/s41598-021-87570-8 3
Vol.:(0123456789)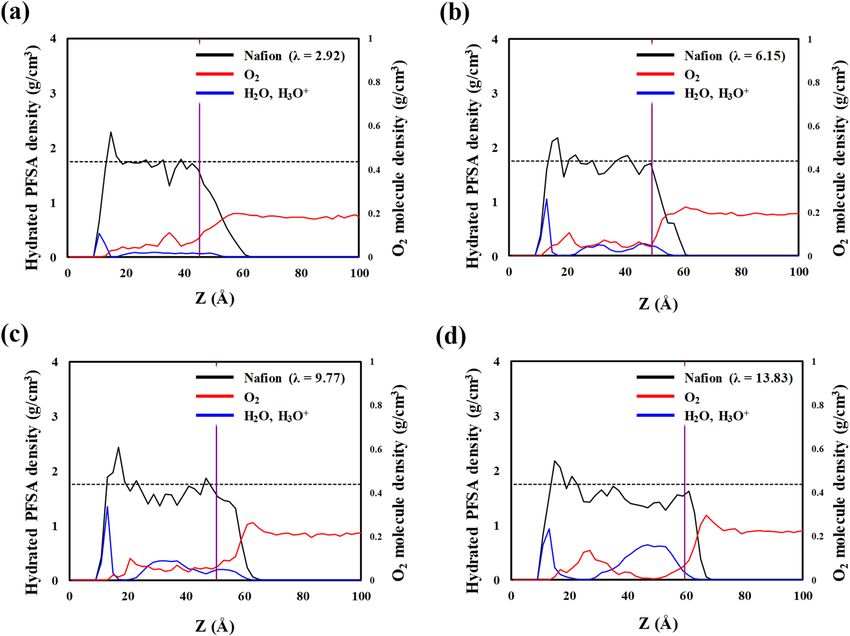
www.nature.com/scientificreports/
Figure 3. Snapshots of equilibrated systems comprising the Pt (111) surface, hydrated Nafion ionomers,
and O2 molecules with λ values of (a) 2.92, (b) 6.15, (c) 9.77, and (d) 13.83; snapshots of equilibrated systems
comprising the Pt (111) surface, hydrated Aquivion ionomers, and O 2 molecules with λ values of (e) 2.92, (f)
6.15, (g) 9.77, and (h) 13.83.
as shown in Fig. 2. The DFT calculation details were the same as those used in the charge analysis (Sect. 2.2.1),
and a semi-empirical dispersion correction (DFT-D) with the Tkatchenko–Scheffler scheme was additionally
applied43. Band-structure calculations with k-points were performed with a 4 × 4 × 1 Monkhorst–Pack k-point
mesh44.
Model construction. To generate the Pt (111) surface and hydrated PFSA ionomers, we constructed a
Pt (111) slab with five atomic layers with PBCs of 38.446 × 38.845 × 300.000 Å3. A z-direction length of 300 Å
was used to prevent interaction beyond the PBCs. To construct hydrated PFSA ionomers on a Pt (111) surface,
the λ (water molecules per sulfonic acid group) values were 2.92, 6.15, 9.77, and 13.83 for hydrated Nafion
and Aquivion ionomers. The PFSA ionomers were composed of six polymer chains with 60 hydronium ions to
maintain electrical neutrality. The Monte Carlo simulation in the Amorphous Cell module of the Materials Stu-
dio software25 was used to construct the initial configuration of hydrated PFSA ionomers on a Pt (111) surface.
MD simulations. After the initial hydrated PFSA with Pt (111) surface models were constructed, the tem-
perature was gradually increased to the operating temperature (353.15 K) of PEMFCs with canonical ensemble
(NVT) for 1 ns. Consequently, 15 ns MD simulations were performed by NVT simulation to obtain the equili-
brated structures. To simulate the permeation of O2 into PFSA ionomers, 735 O2 molecules with a thickness of
100 Å were placed on the equilibrated PFSA ionomers. After the O2 molecules were added, a total of 150 ns of
NVT simulations at 353.15 K was performed. The last 10 ns of NVT simulation was used for data collection of
the O2 permeation properties.
Results and discussion
van der Waals parameters for O2 and Pt. For a better description of the O2 permeation process inside a
hydrated Nafion ionomer thin film on a Pt (111) surface, the atomic interaction curve between O2 and the Pt sur-
face was reproduced by DFT under the framework of the DREIDING force field. Figure 2a shows O2 adsorbed
onto the Pt surface, which was built for calculation of the adsorption energy as a function of the z-distance. The
calculated adsorption energy as a function of distance was fitted to the Lennard–Jones potential in Fig. 2b, which
well reproduced the results of DFT calculations. The Lennard–Jones potential function is shown in Eq. (2):
rm 12 rm 6
E = ε ( ) − 2( ) (2)
r r
2 molecules on a Pt surface are 4.070 kcal/mol and 2.338 Å,
where E indicates the potential energy with changing distance r and ε is the depth of the potential well at distance
rm . The values of ε and rm for the oxygen atoms in O
respectively. The fitted interaction well describes detailed interactions that the DREIDING force field cannot
describe. Thus, the fitted interaction between O 2 and Pt surfaces was used in the MD simulation to analyze the
process of O2 permeation into a Nafion ionomer coated onto a Pt surface.
Scientific Reports | (2021) 11:8702 | https://doi.org/10.1038/s41598-021-87570-8 4
Vol:.(1234567890)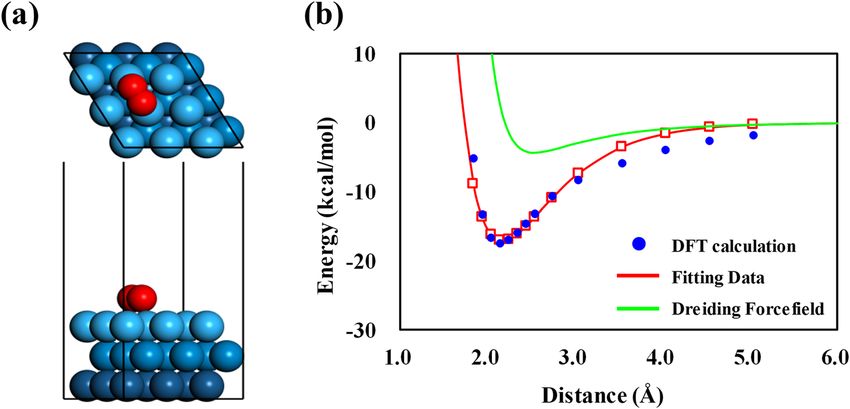
www.nature.com/scientificreports/
Figure 4. Density distributions of hydrated Nafion ionomer (with included water and hydronium ions; black
lines), water and hydronium ions (blue lines), and O 2 molecules (red lines) on the Pt (111) surface along the
thickness direction, with λ values of (a) 2.92, (b) 6.15, (c) 9.77, and (d) 13.83. Dashed lines show the previously
reported density for hydrated bulk N afion20. The purple line indicates the point of O 2 solvation occurs from the
interface of gas/hydrated Nafion.
Equilibrated structure. Equilibrated structures in Fig. 3a–h were obtained from the data corresponding to
the final 5 ns of the MD trajectories. Figure 3a–d show a hydrated Nafion thin film on a Pt surface, and Fig. 3e–h
show a hydrated Aquivion thin film on a Pt surface, both under different hydration levels, λ. As λ increases,
the Nafion and Aquivion films become gradually segregated into hydrophilic water clusters and hydrophobic
regions with PTFE backbones of Nafion and Aquivion ionomer, respectively. Water molecules are predomi-
nantly adsorbed as a thin layer onto the Pt surface because they strongly interact with this s urface30.
To quantitatively analyze the permeation of O2 molecules, we investigated the density profile of hydrated
Nafion, water molecules with hydronium ions, and O 2 molecules, as shown in Fig. 4a–d. Dotted lines represent
the average density of a bulk Nafion membrane, as reported in our previous s tudy20, which indicates that the
density of hydrated Nafion on a Pt surface is not substantially different from that of a bulk membrane except
for the density at the Nafion–Pt interface. As shown in the equilibrated structures in Fig. 3a–h, hydrated Nafion
ionomers and water molecules with hydronium ions exhibit the highest density at the hydrated Nafion–Pt
interface because of their strong attractive interaction. The purple line indicates the point of O 2 solvation from
the hydrated Nafion–gas interface, which is determined by the distance corresponding to the average number
of total solvated O
2 molecules. At this point, the density of O
2 molecules abruptly decreases from its maximum
value. These results are in good agreement with those of Jinnouchi et al.24, who reported that an energy barrier at
the Nafion–gas interface dominates the solubility of O 2 in hydrated Nafion. Inside hydrated Nafion, dissolved O 2
molecules exhibit the highest density and water molecules with hydronium ions exhibit the lowest density. This
trend becomes more discernible as the hydration level increases. These results suggest that O2 molecules are not
preferentially positioned inside hydrophilic domains but rather at the interfacial regions between hydrophobic
and hydrophilic regions.
We also investigated the density profile of water molecules, hydronium ions, and O 2 molecules in hydrated
Aquivion; the results are shown in Fig. 5a–d. Like Nafion, hydrated Aquivion and water molecules with hydro-
nium ions show the highest density at the Aquivion–Pt interface because of their strong attractive interaction.
The hydrated Aquivion is thinner than the hydrated Nafion because of Aquivion’s shorter side chains and lower
EW. The density of O 2 molecules also abruptly decreases the maximum value at the distance indicated by the
purple line, which represents the distance at which O 2 solvation begins. Inside hydrated Aquivion, the dissolved
O2 molecules exhibit the highest density and water molecules with hydronium ions exhibit the lowest density.
Scientific Reports | (2021) 11:8702 | https://doi.org/10.1038/s41598-021-87570-8 5
Vol.:(0123456789)www.nature.com/scientificreports/
Figure 5. Density distributions of hydrated Aquivion ionomer (with included water and hydronium ions; black
lines), water and hydronium ions (blue lines), and O 2 molecules (red lines) on the Pt (111) surface along the
thickness direction, with λ values of (a) 2.92, (b) 6.15, (c) 9.77, and (d) 13.83. Dashed lines show the previously
reported density for hydrated bulk A quivion20. The purple line indicates the point of O 2 solvation occurs from
the interface of gas/hydrated Nafion.
Figure 6. O2 (a) solubility and (b) permeability in hydrated Nafion and Aquivion on a Pt (111) surface.
O2 solubility and permeation. To quantify the solvation of O
2 molecules by hydration level, we calculated
the solubility on the basis of the average number of dissolved O2 molecules at the distance indicated by the pur-
ple vertical line in Figs. 4 and 5. The solubility of Nafion and Aquivion ionomers as a function of the hydration
level is presented in Fig. 6a. The solubility of O2 decreases with increasing hydration level in both the Nafion
and Aquivion ionomers. Because the interfacial region between hydrophilic and hydrophobic domains becomes
relatively limited when the net ionomer volume increases under hydration, the number of sites available for dis-
solved O2 molecules also becomes limited. Therefore, the ionomers exhibit low O 2 solubility at high hydration
levels (λ). At the same λ, the O2 solubility is higher in the Nafion ionomer than in the Aquivion ionomer, which
means that the solvation of O2 molecules in the Aquivion ionomer is restricted compared with that in the Nafion
ionomer.
Scientific Reports | (2021) 11:8702 | https://doi.org/10.1038/s41598-021-87570-8 6
Vol:.(1234567890)www.nature.com/scientificreports/
Figure 7. (a) Molecular model with the atomic definition for O
2 location analysis using RDFs. RDFs at (b)
C(center)–O(O2) and c) O(side chain)–O(O2) and the first coordination number of (d) C(center)–O(O2) and (e)
O(side chain)–O(O2).
Using the solubility values, we derived the permeability coefficient of O
2 molecules. Gases permeate through
ionomers via a solution-diffusion mechanism, where the dissolved gas molecules diffuse into the ionomers45.
Thus, the permeability coefficient P is described by the equation
P =D×S (3)
where D is the diffusion coefficient and S is solubility. The diffusion coefficient in our system was obtained from
the self-diffusion coefficient of O2 molecules in the bulk structures of Nafion and Aquivion. The calculated
permeability coefficients for O2 molecules in Nafion and Aquivion ionomer are shown in Fig. 6b; these values
are consistent with those reported by Baschetti et al.15. With increasing hydration level λ, the permeability of O 2
in both Nafion and Aquivion ionomers increases until λ = 9.77. At λ > 9.77, the permeability increases slightly
because, despite the diminished solubility, the self-diffusion coefficient of O2 in a bulk ionomer membrane
increases with increasing hydration level; thus, permeability increases with increasing hydration level. In our
previous work20, we reported that O2 molecules exhibit greater diffusion in Aquivion ionomers than in Nafion
ionomers because of the Aquivion ionomers’ better-developed water channels. However, at the same hydration
level λ, both the permeability and solubility of O
2 are higher in Nafion ionomer than in Aquivion ionomer. This
result means that solubility is more critical to permeability, which is dominated by the availability of solvation
sites for dissolved O2 molecules in the ionomer.
RDF analysis. The interface region between hydrophilic and hydrophobic domains in a hydrated PFSA
ionomer, where O2 molecules preferentially dissolve, is most likely to be the side-chain part above the sulfonic
acid groups. That is, O
2 solvation mainly occurs at the side chains of the ionomers. Thus, the difference in solubil-
ity between Nafion and Aquivion is reasonably deduced to arise from their different side-chain structures. In this
regard, we analyzed the structure between O2 and the main component of the Nafion and Aquivion side-chain
structures to understand the difference in O 2 solubility between them. As shown in Fig. 7a, we analyzed correla-
tions between Carbon(center)–Oxygen(O2) and Oxygen(side chain)–Oxygen(O2) using RDFs. The RDF of each
pair is described by the following equation:
n
N
B B
gA−B (r) = / (4)
4πr 2 dr V
where nB is the number of B particles located at a distance r in a shell of thickness dr from particle A, NB is the
number of B particles in the system, and V is the total volume of the system; NB/V can be represented by the
tively. The ρg(r) of both C(center)–O(O2) and O(side chain)–O(O2) shows the first peak at 7.87 Å and 8.51 Å,
number density, ρ. The ρg(r) of each pair of Nafion and Aquivion ionomers is presented in Fig. 7b, c, respec-
respectively. These values decrease with increasing hydration level. At the same hydration level, the ρg(r) of both
C(center)–O(O2) and O(side chain)–O(O2) is greater in the Nafion ionomer than in the Aquivion ionomer. This
Scientific Reports | (2021) 11:8702 | https://doi.org/10.1038/s41598-021-87570-8 7
Vol.:(0123456789)www.nature.com/scientificreports/
Pairs Ionomer λ = 2.92 λ = 6.15 λ = 9.77 λ = 13.83
Nafion 6.18 5.68 5.35 5.15
C(center)–O(O2) (7.87 Å)
Aquivion 5.91 4.22 4.05 3.82
Nafion 7.56 6.60 5.94 5.64
O(side chain)–O(O2) (8.51 Å)
Aquivion 7.14 4.79 4.55 4.30
Table 2. The coordination numbers of Nafion and Aquivion on a Pt surface at 353.15 K, where the water
contents (λ) were varied.
result means that O 2 has a more favorable correlation with C(center) and O(side chain) in the Nafion ionomer
than with those in the Aquivion ionomer. The first coordination number (CN) at the distance of the first peak
was calculated (Table 2). As shown in Fig. 7d, e, the CN of C(center)–O(O2) and O(side chain)–O(O2) pairs also
decreases as the hydration level increases with increasing ρg(r). At the same hydration level, the Nafion ionomer
shows a higher CN of each pair than the Aquivion ionomer. This result suggests that more O 2 molecules are
coordinated to the side chain of the Nafion ionomer than to that of the Aquivion ionomer, especially to the side
chains’ oxygen atoms, which results in greater solubility of O2 in the Nafion ionomer. In addition, we note that
Aquivion shows a similar CN as Nafion at λ = 2.92. As described in the previous section, we also observed that
the difference in solubility and permeability is more discernible at a hydration level greater than λ = 2.92. At a low
hydration level, the site for O2 solvation is not significantly different due to only a few water molecules located
near the side chain leading to a lack of phase segregation, and O2 molecules can be easier located near the side
chain of PFSA than other water contents. However, as the hydration level increases, the solvation sites of O 2
molecules become limited to the side-chain region of the ionomer due to the water molecules formed the water
cluster near sulfonic acid groups of PFSA. Although the water molecules formed the water cluster near sulfonic
acid groups, O2 molecules can be located near the side chain of Nafion easier than Aquivion because the side
chain of Nafion is longer than that of Aquivion, leading to higher CNs of Nafion. The CN of C(center)–O(O2)
and O(side chain)–O(O2) pairs of Aquivion were sharply decreased at λ = 6.15 because we assume that the water
cluster can be formed in Aquivion easier than Nafion due to higher sulfonic acid group concentration. After
that, the CNs of Aquivion at 9.77 to 13.83 was gradually decreased with developing water clusters and channels
near the side chain. Consequently, Nafion and Aquivion exhibit an observable difference in solubility at higher
hydration levels.
Conclusion
We prepared two types of hydrated PFSA ionomers on a Pt (111) surface and varied their water contents
(2.92 ≤ λ ≤ 13.83) to analyze the distribution morphologies and permeability properties of O 2 molecules in detail
using full atomistic MD simulations at the operating temperature of PEMFCs (353.15 K). The hydrated PFSA
ionomer structures were prepared using Nafion (long side chain) and Aquivion (short side chain). In the MD
simulations, O2 molecules were gradually permeated into hydrated PFSA ionomers on the Pt surface. Density
profile analysis for hydrated PFSA ionomers was performed to calculate the O 2 solubility in hydrated PFSA
ionomers with various λ. The O 2 solubility in hydrated Nafion ionomers on the Pt surface was higher than that in
hydrated Aquivion ionomers on the Pt surface at the same λ values. The RDF analysis showed that the first CN of
C(center)–O(O2) and O(side chain)–O(O2) pairs of hydrated Nafion ionomers was greater than that of hydrated
Aquivion ionomers at the same water content. These results suggest that more O 2 molecules are coordinated to
the side chains of the Nafion ionomer than to those of the Aquivion ionomer, especially oxygen atoms, which
results in greater O
2 solubility in the Nafion ionomer.
Received: 14 December 2020; Accepted: 4 February 2021
References
1. Peighambardoust, S. J., Rowshanzamir, S. & Amjadi, M. Review of the proton exchange membranes for fuel cell applications. Int.
J. Hydrogen Energ. 35, 9349–9384 (2010).
2. Stambouli, A. B. Fuel cells: the expectations for an environmental-friendly and sustainable source of energy. Renew. Sustain. Energy
Rev. 15, 4507–4520 (2011).
3. Debe, M. K. Electrocatalyst approaches and challenges for automotive fuel cells. Nature 486, 43–51 (2012).
4. Kraytsberg, A. & Ein-Eli, Y. Review of advanced materials for proton exchange membrane fuel cells. Energ Fuel 28, 7303–7330
(2014).
5. Wang, Y., Chen, K. S., Mishler, J., Cho, S. C. & Adroher, X. C. A review of polymer electrolyte membrane fuel cells: Technology,
applications, and needs on fundamental research. Appl. Energ. 88, 981–1007 (2011).
6. Gierke, T. D., Munn, G. E. & Wilson, F. C. The morphology in nafion perfluorinated membrane products, as determined by wide-
angle and small-angle X-ray studies. J. Polym. Sci. Pol. Phys. 19, 1687–1704 (1981).
7. Kariduraganavar, M. Y., Nagarale, R. K., Kittur, A. A. & Kulkarni, S. S. Ion-exchange membranes: Preparative methods for elec-
trodialysis and fuel cell applications. Desalination 197, 225–246 (2006).
8. Moore, R. B. & Martin, C. R. Morphology and chemical-properties of the dow perfluorosulfonate ionomers. Macromolecules 22,
3594–3599 (1989).
9. Gebel, G. & Moore, R. B. Small-angle scattering study of short pendant chain perfuorosulfonated ionomer membranes. Macro-
molecules 33, 4850–4855 (2000).
Scientific Reports | (2021) 11:8702 | https://doi.org/10.1038/s41598-021-87570-8 8
Vol:.(1234567890)www.nature.com/scientificreports/
10. Yoshida, N., Ishisaki, T., Watakabe, A. & Yoshitake, M. Characterization of flemion (R) membranes for PEFC. Electrochim Acta
43, 3749–3754 (1998).
11. Saito, M., Arimura, N., Hayamizu, K. & Okada, T. Mechanisms of ion and water transport in perfluorosulfonated ionomer mem-
branes for fuel cells. J. Phys. Chem. B 108, 16064–16070 (2004).
12. Smitha, B., Sridhar, S. & Khan, A. A. Solid polymer electrolyte membranes for fuel cell applications: a review. J. Memb. Sci. 259,
10–26 (2005).
13. Garsany, Y. et al. Improving PEMFC performance using short-side-chain low-equivalent-weight PFSA ionomer in the cathode
catalyst layer. J. Electrochem. Soc. 165, F381–F391 (2018).
14. Siracusano, S. et al. Performance analysis of short-side-chain Aquivion (R) perfluorosulfonic acid polymer for proton exchange
membrane water electrolysis. J. Membr. Sci. 466, 1–7 (2014).
15. Baschetti, M. G., Minelli, M., Catalano, J. & Sarti, G. C. Gas permeation in perflurosulfonated membranes: Influence of temperature
and relative humidity. Int. J. Hydrogen Energ. 38, 11973–11982 (2013).
16. Jang, S. S., Molinero, V., Çaǧın, T. & Goddard, W. A. Nanophase-segregation and transport in Nafion 117 from molecular dynamics
simulations: Effect of monomeric sequence. J Phys Chem B 108, 3149–3157 (2004).
17. Cui, S. T. et al. A molecular dynamics study of a nafion polyelectrolyte membrane and the aqueous phase structure for proton
transport. J. Phys. Chem. B 111, 2208–2218 (2007).
18. Venkatnathan, A., Devanathan, R. & Dupuis, M. Atomistic simulations of hydrated Nafion and temperature effects on hydronium
ion mobility. J. Phys. Chem. B 111, 7234–7244 (2007).
19. Sunda, A. P. & Venkatnathan, A. Molecular dynamics simulations of side chain pendants of perfluorosulfonic acid polymer elec-
trolyte membranes. J. Mater. Chem. A 1, 557–569 (2013).
20. Kwon, S. H. et al. Investigating the influence of the side-chain pendants of perfluorosulfonic acid membranes in a PEMFC by
molecular dynamics simulations. Mater. Today Commun. 21, 100625 (2019).
21. Paddison, S. J. & Elliott, J. A. Molecular Modeling of the short-side-chain perfluorosulfonic acid membrane. J. Phys. Chem. A 109,
7583–7593 (2005).
22. Kurihara, Y., Mabuchi, T. & Tokumasu, T. Molecular analysis of structural effect of ionomer on oxygen permeation properties in
PEFC. J. Electrochem. Soc. 164, F628–F637 (2017).
23. Kurihara, Y., Mabuchi, T. & Tokumasu, T. Molecular dynamics study of oxygen transport resistance through ionomer thin film
on Pt surface. J. Power Sources 414, 263–271 (2019).
24. Jinnouchi, R., Kudo, K., Kitano, N. & Morimoto, Y. Molecular dynamics simulations on O-2 permeation through nafion lonomer
on platinum surface. Electrochim Acta 188, 767–776 (2016).
25. BIOVIA. Materials Studio 2019. San Diego, Dassault Systèmes (2019).
26. Mayo, S. L., Olafson, B. D. & Goddard, W. A. Dreiding: A generic force-field for molecular simulations. J. Phys. Chem. Us 94,
8897–8909 (1990).
27. Devanathan, R., Venkatnathan, A. & Dupuis, M. Atomistic simulation of nafion membrane. 2. Dynamics of water molecules and
hydronium ions. J. Phys. Chem. B 111, 13006–13013, (2007).
28. Kwon, S. H., Lee, S. Y., Kim, H.-J., Kim, H.-T. & Lee, S. G. Molecular dynamics simulation to reveal effects of binder content on
pt/c catalyst coverage in a high-temperature polymer electrolyte membrane fuel cell. ACS Appl. Nano Mater. 1, 3251–3258 (2018).
29. Lee, K. A. et al. Post-assembly modification of polymeric composite membranes using spin drying for fuel cell applications. J.
Mater. Chem. A 7, 7380–7388 (2019).
30. Kang, H. et al. Nanostructures of nafion film at platinum/carbon surface in catalyst layer of PEMFC: molecular dynamics simula-
tion approach. J. Phys. Chem. C 124, 21386–21395 (2020).
31. Lee, J. H. et al. Dispersion-solvent control of ionomer aggregation in a polymer electrolyte membrane fuel cell. Scientific Reports
8, (2018).
32. Lee, J. H. et al. Controlling ionomer film morphology through altering Pt catalyst surface properties for polymer electrolyte
membrane fuel cells. ACS Appl. Polym. Mater. 2, 1807–1818 (2020).
33. Doo, G. et al. Nano-scale control of the ionomer distribution by molecular masking of the Pt surface in PEMFCs. J. Mater. Chem.
A 8, 13004 (2020).
34. Levitt, M., Hirshberg, M., Sharon, R., Laidig, K. E. & Daggett, V. Calibration and testing of a water model for simulation of the
molecular dynamics of proteins and nucleic acids in solution. J. Phys. Chem. B 101, 5051–5061 (1997).
35. Zhou, X. W., Johnson, R. A. & Wadley, H. N. G. Misfit-energy-increasing dislocations in vapor-deposited CoFe/NiFe multilayers.
Phys Rev B 69, (2004).
36. Plimpton, S. Fast parallel algorithms for short-range molecular-dynamics. J. Comput. Phys. 117, 1–19 (1995).
37. Plimpton, S., Pollock, R., Stevens, M. in PPSC.
38. Swope, W. C., Andersen, H. C., Berens, P. H. & Wilson, K. R. A Computer-simulation method for the calculation of equilibrium-
constants for the formation of physical clusters of molecules - application to small water clusters. J. Chem. Phys. 76, 637–649 (1982).
39. Hockney, R. W., Eastwood, J. W. Computer simulation using particles. (CRC Press, 1988).
40. Mulliken, R. S. Electronic population analysis on LCAO–MO molecular wave functions. I. J Chem Phys 23, 1833–1840 (1955).
41. Perdew, J. P., Burke, K. & Ernzerhof, M. Generalized gradient approximation made simple. Phys. Rev. Lett. 77, 3865–3868 (1996).
42. Brunello, G. F. et al. Interactions of Pt nanoparticles with molecular components in polymer electrolyte membrane fuel cells:
multi-scale modeling approach. RSC Adv. 6, 69670–69676 (2016).
43. Tkatchenko, A., Scheffler, M. Accurate molecular van der waals interactions from ground-state electron density and free-atom
reference data. Phys. Rev. Lett. 102, (2009).
44. Monkhorst, H. J. & Pack, J. D. Special points for brillouin-zone integrations. Phys. Rev. B 13, 5188–5192 (1976).
45. Kusoglu, A. & Weber, A. Z. New insights into perfluorinated sulfonic-acid lonomers. Chem. Rev. 117, 987–1104 (2017).
Acknowledgements
This work was supported by the R&D Collaboration Programs of Hyundai Motor Company. This research was
supported by the National Research Foundation of Korea (NRF) funded by the Ministry of Science, ICT &
Future Planning (No. 2020M1A2A2080807). This research was supported by Global Frontier Program through
the Global Frontier Hybrid Interface Materials (GFHIM) of the National Research Foundation of Korea (NRF)
funded by the Ministry of Science, ICT and Future Planning (No. 2013M3A6B1078882). The work was supported
by the National Research Foundation of Korea(NRF) Grant funded by the Ministry of Education: Brain Korea
21 Plus Program (4199990414196).
Author contributions
S.H.K. and H.K. performed the molecular dynamics simulations. S.H.K. and H.K. analyzed data. Y.-J.S., J.L., S.S.
and S.G.L. conceived the research idea. S.S. and S.G.L. designed experiments. S.H.K., H.K. and S.G.L. wrote the
main manuscript text. S.S. and S.G.L. supervised the research. All authors reviewed the manuscript.
Scientific Reports | (2021) 11:8702 | https://doi.org/10.1038/s41598-021-87570-8 9
Vol.:(0123456789)www.nature.com/scientificreports/
Competing interests
The authors declare no competing interests.
Additional information
Correspondence and requests for materials should be addressed to S.S. or S.G.L.
Reprints and permissions information is available at www.nature.com/reprints.
Publisher’s note Springer Nature remains neutral with regard to jurisdictional claims in published maps and
institutional affiliations.
Open Access This article is licensed under a Creative Commons Attribution 4.0 International
License, which permits use, sharing, adaptation, distribution and reproduction in any medium or
format, as long as you give appropriate credit to the original author(s) and the source, provide a link to the
Creative Commons licence, and indicate if changes were made. The images or other third party material in this
article are included in the article’s Creative Commons licence, unless indicated otherwise in a credit line to the
material. If material is not included in the article’s Creative Commons licence and your intended use is not
permitted by statutory regulation or exceeds the permitted use, you will need to obtain permission directly from
the copyright holder. To view a copy of this licence, visit http://creativecommons.org/licenses/by/4.0/.
© The Author(s) 2021
Scientific Reports | (2021) 11:8702 | https://doi.org/10.1038/s41598-021-87570-8 10
Vol:.(1234567890)You can also read