MONITORING AND MAPPING THE CONFLICT IN IRAQ USING SATELLITE IMAGERY
←
→
Page content transcription
If your browser does not render page correctly, please read the page content below
REMOTE SENSING/DEFENCE

MONITORING AND MAPPING
THE CONFLICT IN IRAQ
USING SATELLITE IMAGERY
GATHERING INFORMATION ON THE GROUND DURING WARTIME CAN BE
BOTH DIFFICULT AND DANGEROUS. ANA ISABEL MARTÍNEZ EXPLAINS HOW
MULTI-SPECTRAL SATELLITE IMAGERY WAS USED TO MONITOR EVERYTHING
FROM OIL FIRES TO REFUGEE CAMPS AROUND MOSUL IN IRAQ

Monitoring the evolution of wars and conflicts, the damage they           were going on in Mosul and its surroundings; then, this
produce to the environment, heritage sites and infrastructures, as        information was used to task the very-high-resolution Deimos-2
well as the extent of the humanitarian crises to which they lead can      over the identified areas to get much more detailed imagery.
be a complicated task, given the danger that being on-site poses.             The ability to record a sequence of images over time at different
    Satellite imagery is a key way to both monitor and map a conflict’s   spatial resolution and the use of the tipping and queuing technique
evolution and impact, without the risks and costs associated with         enabled the tracking and capture of the most relevant developments
having people on-site. It allows users to capture reliable imagery,       in Mosul’s conflict and its dynamics, both in context and in detail.
and ensures accurate and timely monitoring over sites located in              Moreover, the expansion of camps for refugees and internally
areas affected by ongoing threats, where it’s otherwise difficult         displaced people (IDP), such as the one in Hammam al-Alil 25km
to get up to date information and verify potential damage.                south of Mosul (Figure 6) was monitored, as were the evolution
    Deimos Imaging has been monitoring and mapping the                    of the oil fires in Qayyarah (Figure 3) and the changes in the ag-
conflict in and around Mosul since its beginning using its two            ricultural production in the Nineveh region (Figures 4 and 5).
satellites: the medium resolution Deimos-1 and the very-high                  Thus, Deimos Imaging’s imagery helped with the assessment of
resolution Deimos-2. Both satellites operate continuously,                the humanitarian, economic and environmental impact of this conflict,
with a global network of five ground station ensuring contact             providing data to decision-makers in a wide range of areas, from
with each of them every orbit to command and download                     NGOs and international organisations to local institutions promoting
data every 90 minutes (see ‘Satellite capabilities’).                     precision agriculture for the country’s recovery post-conflict.
    In this study, a synergistic tipping and queuing has been
carried out, collecting information and coordinating activities           Deimos-2 to analyse and quantify infrastructure damages
between Deimos Imaging’s sensors. Thanks to its wide swath and            On October 17 last year, Iraqi security forces launched a major
high revisit time, Deimos-1 spotted where the main developments           offensive to recapture Mosul, IS’ last major stronghold in Iraq.

38                                                                                           July/August 2017 | GeoConnexion International Magazine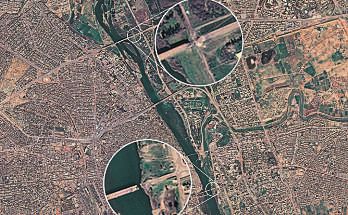
During the offensive, multiple churches,
mosques and shrines, dozens of
antiquities in the Mosul Museum and
great parts of the ancient Assyrian city
of Nineveh were destroyed. Moreover,
the city’s infrastructure has been severely
damaged by both sides of the conflict.
Deimos-2 imagery was used to identify
and assess the damage that occurred
during the conflict to infrastructure such
as the city’s airport and bridges. For this
purpose, a pre-event and post-event change
detection analysis was carried out, revealing
extensive damages (Figures 1 and 2). The
analysis of the Deimos-2 high-resolution
image captured on February 19 this year
allowed the identification of razed buildings
and rubble placed along Mosul airport’s
runaway, and the image captured on
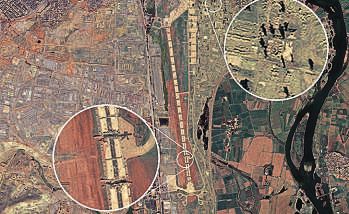
March 10 shows the suspended bridges to Figure 1. Deimos-2 image of the city of Mosul showing 2 of the 5 badly damaged bridges. Upper zoom in: Al-
impede crossing from east to west Mosul. Shohada Bridge; lower zoom in: Al-Jamhuriya Bridge. Image captured on March 10 2017
This data is also useful in post-conflict to
quantify damage to infrastructure, so it an
important tool in long-term reconstruction
programmes. In addition, archive imagery
is being continuously updated with fresh
images, which is crucial in areas affected
by ongoing conflicts where it’s difficult to
get up-to-date and verified information.
Pollution sources and
environmental damage
From August last year to April this year,
several fires burned in the oil field of
Qayyarah, around 60km south of Mosul.
Deimos-1 and Deimos-2, together with
other satellites’ imagery, allowed Wim
Zwijnenburg, project leader at the non-
profit, non-governmental organisation PAX,
to identify different pollution sources.
“As PAX’s core goal is to protect civilians,
knowing what is happening on the ground
during a conflict proves to be very difficult Figure 2. Deimos-2 image of Mosul’s Airport: the airport runway was destroyed and infrastructures damaged. Upper
if you don’t have access to area,” he says. zoom in: razed building; lower zoom in: rubble and trenches at runaway. Image captured on February 19 2017
“This goes for all our programmes, be it
monitoring the use of weapons, civilian
harm tracking or my area of expertise – the
monitoring of the impact of conflict on the
environment and related human health risks.
Analysis of satellite imagery from Deimos
Imaging and UNOSAT allowed us to track the
problems with the oil wells in Qayyarah, and
to identify attacks and damages to industrial
sites in and around Mosul zones in Iraq.”
He adds: “We applied similar approaches
to monitor the conflicts in Syria, Ukraine
and Libya, and we used this information to
support public advocacy and send out public
alerts about the risks of chemical incidents
and/or long-term environmental pollution
that can lead to acute or chronic health
problems for civilians and their communities.”
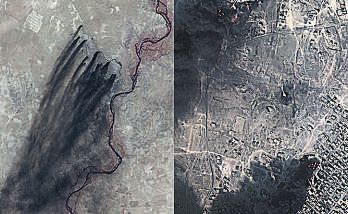
The images in Figure 3 were created
combining red, green and near-infrared
bands to show active fires (bright red and Figure 3. Qayyarah oil fires, Iraq: Deimos-1 image acquired on November 28 2016 (left); Deimos-2 image
yellow) and smoke (black). The vegetation acquired on October 29 2016 (right). Bright red and yellow show active fires while black represent smoke
is pictured in red in these false-colour billowing from the oil fields
www.geoconnexion.com 39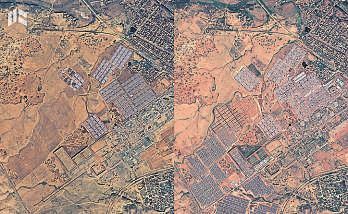
images acquired in October (Deimos 2)
and November (Deimos-1) last year.
The impact on agriculture
The Nineveh province was once Iraq’s
breadbasket, accounting for almost half the
country’s overall wheat supply. However,
the ongoing conflict is jeopardising the
agricultural production, mainly in the regions
of the Nineveh, Kirkuk and Salahuddin
governorates in Iraq. Deimos Imaging tasked
both Deimos-1 and Deimos-2 satellites on the
Nineveh Governorate in Iraq (Figures 4 and 5).
The bands of Deimos-1 (RG, NIR) and
Deimos-2 (RGB, NIR) have been especially
designed for monitoring vegetation. In
particular, they provide analytic-ready
imagery, supplying the information needed
for vegetation indices calculations. These
provide an indication of the relative density
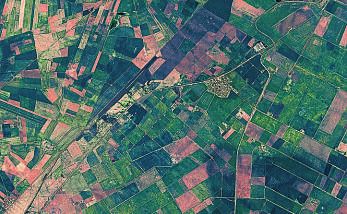
Figure 4. Deimos-1 image of Nineveh Governorate, Iraq, April 4 2016
and health of vegetation for each pixel of
Deimos-1 and Deimos-2 imagery. In addition,
the satellites’ high temporal resolution capacity
ensures data is acquired systematically,
enabling consistent monitoring and analysis.
In general, this high frequency and
high-resolution data can be used to supply
a powerful operational service for precision
agriculture, with an accurate multitemporal
overlay at pixel level. This can empower
precision agriculture users at different stages:
planning; in-season practices and yield.
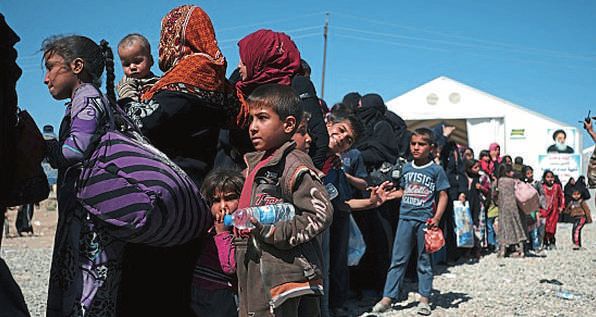
The humanitarian impact
Satellite imagery also plays an increasingly
important role in monitoring and measuring
humanitarian crises. It serves to support
decision-making and manage humanitarian
aid and response through, for instance,
the monitoring of changes in refugee IDP
camps. Deimos-2 data helped to detect the
Figure 5. Deimos-2 image of Nineveh Governorate, March 30 2017 evolution of the refugee camp at Hammam
Al-Alil, around 25km south of Mosul. The
multitemporal analysis of Deimos-2 imagery
provided reliable information to measure the
camp’s growth and density over time, allowing
an estimate of the population sheltered there.
Accurate multitemporal analysis showed that
the number of tents increased from 3,738 on
February 19 to 8,136 on April 22. Therefore, the
camp grew by 54% in just two months. Given
that on average six people are accommodated
in each tent, the number of people hosted in
the camp increased from around 22,500 to
almost 50,000 between February 19 to April 22.
The image captured on April 22 also shows
a part of the camp still under construction,
which enables a forecast of future occupancy
of almost 56,000 people – a number that
matches the capacity expectations of
the United Nations High Commissioner
for Refugees, which is responsible for
managing and developing this camp.
Figure 6. Deimos-2 images of Hammam Al-Alil, Iraq, captured on February 19 2017 (left) and April 22 2017
(right). Careful image analysis showed that the amount of people hosted in the camp incremented from Ana Isabel Martínez is communications
around 22.500 to almost 50.000 between the two acquisition dates. This is a preliminary analysis which has manager at Deimos Imaging, an UrtheCast
not been yet validated in the field company (www.deimos-imaging.com)
40 July/August 2017 | GeoConnexion International Magazine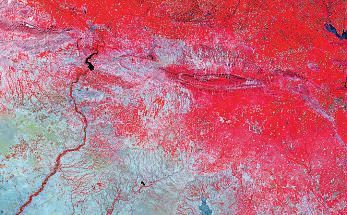
You can also read