Xml2jupyter: Mapping parameters between XML and Jupyter widgets - bioRxiv
←
→
Page content transcription
If your browser does not render page correctly, please read the page content below
bioRxiv preprint first posted online Apr. 7, 2019; doi: http://dx.doi.org/10.1101/601211. The copyright holder for this preprint (which
       was not peer-reviewed) is the author/funder, who has granted bioRxiv a license to display the preprint in perpetuity.
                                     It is made available under a CC-BY 4.0 International license.

                                          xml2jupyter: Mapping parameters between XML and
                                          Jupyter widgets
                                           Randy Heiland1 , Daniel Mishler1 , Tyler Zhang1 , Eric Bower1 , Paul Macklin1,*

                                          1 Intelligent Systems Engineering, Indiana University

                                           Paul.Macklin@MathCancer.org

                                           Abstract
                                           Jupyter Notebooks [4, 6] provide executable documents (in a variety of programming
                                           languages) that can be run in a web browser. When a notebook contains graphical
                                           widgets, it becomes an easy-to-use graphical user interface (GUI). Many scientific
                                           simulation packages use text-based configuration files to provide parameter values and
                                           run at the command line without a graphical interface. Manually editing these files
                                           to explore how different values affect a simulation can be burdensome for technical
                                           users, and impossible to use for those with other scientific backgrounds. xml2jupyter
                                           is a Python package that addresses these scientific bottlenecks. It provides a mapping
                                           between configuration files, formatted in the Extensible Markup Language (XML), and
                                           Jupyter widgets. Widgets are automatically generated from the XML file and these can,
                                           optionally, be incorporated into a larger GUI for a simulation package, and optionally
                                           hosted on cloud resources. Users modify parameter values via the widgets, and the
                                           values are written to the XML configuration file which is input to the simulation’s
                                           command-line interface. xml2jupyter has been tested using PhysiCell [1], an open source,
                                           agent-based simulator for biology, and it is being used by students for classroom and
                                           research projects. In addition, we use xml2jupyter to help create Jupyter GUIs for
                                           PhysiCell-related applications running on nanoHUB [5].

                                           Introduction
                                          A PhysiCell configuration file defines model-specific  in XML. Each
                                          parameter element consists of its name with attributes, defining its data type, units
                                          (optional), description (optional), whether the widget should be hidden (optional), and
                                          the parameter’s default value. The attributes will determine the appearance and behavior
                                          of the Jupyter widget. For numeric widgets (the most common type for PhysiCell),
                                          xml2jupyter will calculate a delta step size as a function of the default value and this
                                          step size will be used by the widget’s graphical increment/decrement feature.
                                              To illustrate, we show the following simple XML example, containing each of the four
                                          (currently) supported data types and the various attributes:

                                               250.0

                                               8

                                                                                                                                          1/7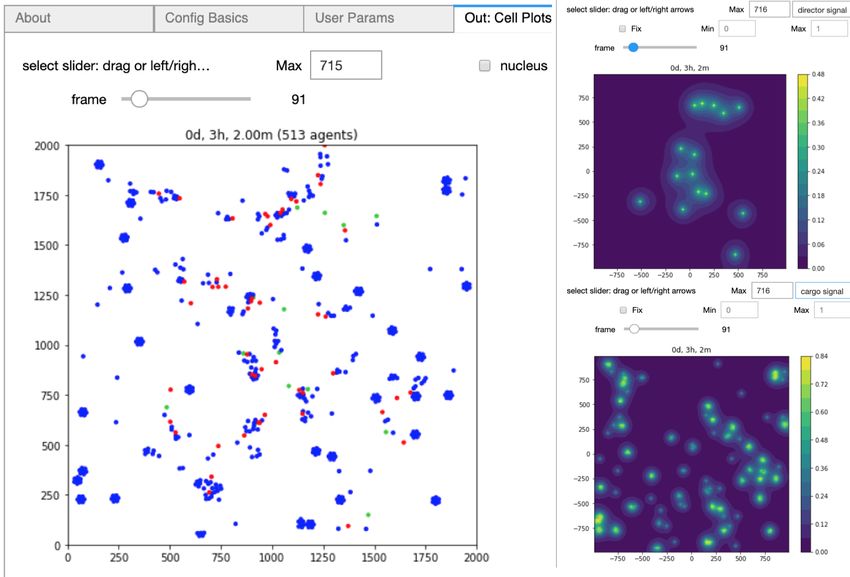
bioRxiv preprint first posted online Apr. 7, 2019; doi: http://dx.doi.org/10.1101/601211. The copyright holder for this preprint (which
       was not peer-reviewed) is the author/funder, who has granted bioRxiv a license to display the preprint in perpetuity.
                                     It is made available under a CC-BY 4.0 International license.

                                               red
                                               True

                                              When we map this into Jupyter widgets, we obtain the rendered results in Figure 1.
                                          Notice the color parameter is not displayed since we specified it should be hidden in
                                          the XML. The name of the other parameters, their values, and attributes, if present, are
                                          displayed in rows (as disabled Jupyter button widgets). Using alternating row colors
                                          (“zebra stripes”) helps visually match associated fields and avoid changing the wrong
                                          parameter value. For numeric widgets (type “int” or “double”), we compute a delta step
                                          value based on the magnitude (log) of the initial value. For example, the radius widget
                                          will have a step value of 10, whereas threads will have a step value of 1.

                                           Figure 1. Simple example of XML parameters as Jupyter widgets.

                                              For a more realistic example, consider the config_biorobots.xml configuration file
                                          (found in the config_samples directory). The XML elements in the
                                          block include the (optional) description attribute which briefly describes the parameter
                                          and is displayed in another widget. To demonstrate xml2jupyter on this XML file, one
                                          would: 1) clone or download the repository, 2) copy the XML configuration file to the
                                          root directory, and 3) run the xml2jupyter.py script, providing the XML file as an
                                          argument.

                                           $ cp config_samples/config_biorobots.xml .
                                           $ python xml2jupyter.py config_biorobots.xml

                                              The xml2jupyter.py script parses the XML and generates a Python module,
                                           user_params.py, containing the Jupyter widgets, together with methods to populate
                                           their values from the XML and write their values back to the XML. To “validate” the
                                           widgets were generated correctly, one could, minimally, open user_params.py in an
                                           editor and inspect it.
                                              But to actually see the widgets rendered in a notebook, we provide a simple test:

                                           $ python xml2jupyter.py config_biorobots.xml test_user_params.py
                                           $ jupyter notebook test_gui.ipynb

                                               This should display a minimal notebook in your browser and, after selecting Run all
                                           in the Cell menu, you should see the notebook shown in Figure 2.

                                           PhysiCell Jupyter GUI
                                           Our ultimate goal is to generate a fully functional GUI for PhysiCell users. xml2jupyter
                                           provides one important piece of this - dynamically generating widgets for custom user
                                           parameters for a model. By adding additional Python modules to provide additional
                                           components (tabs) of the GUI that are common to all PhysiCell models, a user can

                                                                                                                                          2/7
bioRxiv preprint first posted online Apr. 7, 2019; doi: http://dx.doi.org/10.1101/601211. The copyright holder for this preprint (which
was not peer-reviewed) is the author/funder, who has granted bioRxiv a license to display the preprint in perpetuity.
It is made available under a CC-BY 4.0 International license.
Figure 2. The biorobots parameters rendered as Jupyter widgets.
3/7bioRxiv preprint first posted online Apr. 7, 2019; doi: http://dx.doi.org/10.1101/601211. The copyright holder for this preprint (which
was not peer-reviewed) is the author/funder, who has granted bioRxiv a license to display the preprint in perpetuity.
It is made available under a CC-BY 4.0 International license.
Figure 3. Plotting the biorobots (cells; left) and signals (substrates; right).
configure, run, and visualize output from a simulation. Two tabs that provide visualiza-
tion of output files are shown below with results from the biorobots simulation. Note
that some of the required modules are not available in the Python standard library,
e.g., Matplotlib [2] and SciPy [3]. 2001). We provide instructions for installing these
additional dependencies in the repository README.
Extensions and Discussion
We hope others will be inspired to extend the core idea of this project to other text-based
configuration files. XML is only one of several data-interchange formats, and while
we created this tool for XML-based configurations based on needs to create GUIs for
PhysiCell projects, the approach should be more broadly applicable to these other
formats. And while the additional Python modules that provide visualization are also
tailored to PhysiCell output, they can serve as templates for other scientific applications
whose input and output file formats provide similar functionality.
xml2jupyter has helped us port PhysiCell-related Jupyter tools to nanoHUB, a
scientific cloud for nanoscience education and research that includes running interactive
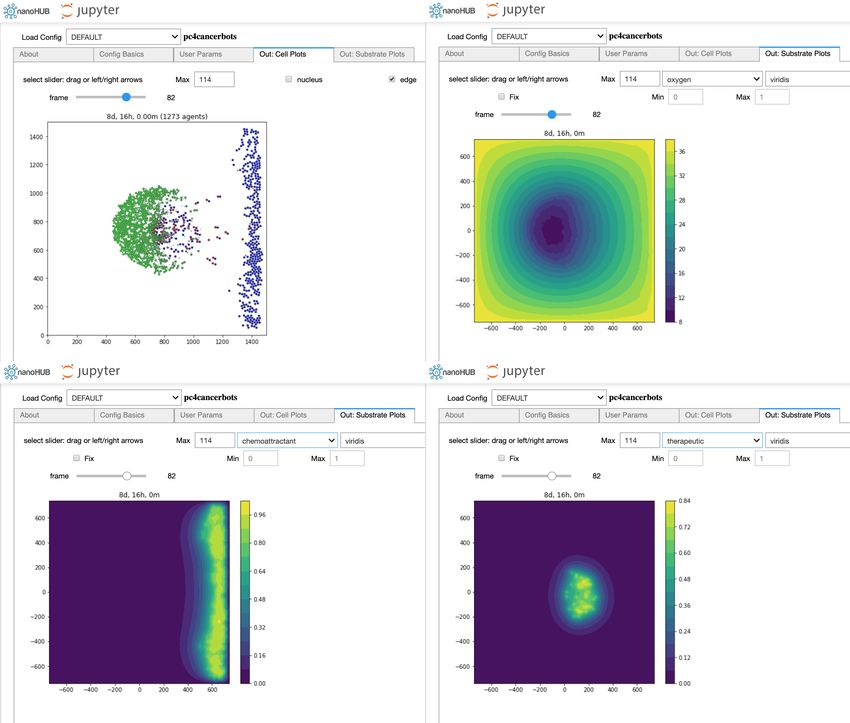
simulations in a browser. For example, Figure 4 shows the xml2jupyter-generated User
Params tab in our our pc4cancerbots tool running on nanoHUB. Figure 5 shows the
cells (upper-left) and three different substrate plots for this same tool. This particular
model and simulation is described in this video.
Other PhysiCell-related nanoHUB tools that have been created using xml2jupyter
include pc4heterogen, pcISA, and pc4cancerimmune. Readers can create a free account
on nanoHUB and run these simulations for themselves. We encourage students to use
xml2jupyter to create their own nanoHUB tools of PhysiCell models that 1) can be
run and evaluated by the instructor, 2) can be shared with others, and 3) become part
of a student’s living portfolio. (Another repository, https://github.com/rheiland/
tool4nanobio, provides instructions and scripts to help generate a full GUI from an
4/7bioRxiv preprint first posted online Apr. 7, 2019; doi: http://dx.doi.org/10.1101/601211. The copyright holder for this preprint (which
was not peer-reviewed) is the author/funder, who has granted bioRxiv a license to display the preprint in perpetuity.
It is made available under a CC-BY 4.0 International license.
Figure 4. The cancer biorobots parameters in a nanoHUB Jupyter application.
existing PhysiCell model.)
We welcome suggestions and contributions to xml2jupyter. For example, currently,
we arrange the generated parameter widgets vertically, one row per parameter. This is
an appropriate layout for an educational setting. But if a GUI will be used by researchers
who are already familiar with the parameters, it may be preferable to generate a more
compact layout of widgets, e.g., in a matrix with only the parameter names and values.
Moreover, it may be useful to provide additional control over styling and placement
by a separate style.xml or similar file, or by an external cascading style sheet. We will
explore these options in the future, with the aim of separating as much GUI specification
and styling from the original scientific application as possible. Such a decoupling would
make it easier for scientific developers to continue refining their scientific codes without
worrying about impact on the GUI, and without undue encumbrance by non-scientific
annotations.
Also, we currently provide just 2-D visualizations of (spatial) data. In the near
future, we will provide visualizations of 3-D models and welcome suggestions from the
community.
Acknowledgements
We thank the National Science Foundation (1720625) and the National Cancer Institute
(U01-CA232137-01) for generous support. Undergraduate and graduate students in the
Intelligent Systems Engineering deparment at Indiana University provided internal test-
ing, and students and researchers within the NSF nanoMFG (1720701) group generously
provided external testing. All of their feedback resulted in considerable improvements to
this project. Finally, we thank our collaborators at Purdue University, especially Martin
Hunt and Steve Clark, who provided technical support with nanoHUB and Jupyter.
5/7bioRxiv preprint first posted online Apr. 7, 2019; doi: http://dx.doi.org/10.1101/601211. The copyright holder for this preprint (which
was not peer-reviewed) is the author/funder, who has granted bioRxiv a license to display the preprint in perpetuity.
It is made available under a CC-BY 4.0 International license.
Figure 5. The cancer biorobots Jupyter notebook on nanoHUB.
6/7bioRxiv preprint first posted online Apr. 7, 2019; doi: http://dx.doi.org/10.1101/601211. The copyright holder for this preprint (which
was not peer-reviewed) is the author/funder, who has granted bioRxiv a license to display the preprint in perpetuity.
It is made available under a CC-BY 4.0 International license.
References
1. A. Ghaffarizadeh, R. Heiland, S. H. Friedman, S. M. Mumenthaler, and P. Macklin.
Physicell: An open source physics-based cell simulator for 3-d multicellular systems.
PLOS Computational Biology, 14(2):1–31, 02 2018.
2. J. D. Hunter. Matplotlib: A 2d graphics environment. Computing In Science &
Engineering, 9(3):90–95, 2007.
3. E. Jones, T. Oliphant, P. Peterson, et al. SciPy: Open source scientific tools for
Python, 2001. [Online; accessed April 4, 2019].
4. T. Kluyver, B. Ragan-Kelley, F. Pérez, B. Granger, M. Bussonnier, J. Frederic,
K. Kelley, J. Hamrick, J. Grout, S. Corlay, P. Ivanov, D. Avila, S. Abdalla, and
C. Willing. Jupyter notebooks – a publishing format for reproducible computational
workflows. In F. Loizides and B. Schmidt, editors, Positioning and Power in
Academic Publishing: Players, Agents and Agendas, pages 87 – 90. IOS Press, 2016.
5. K. Madhavan, L. Zentner, V. Farnsworth, S. Shivarajapura, M. Zentner, N. Denny,
and G. Klimeck. nanohub.org: cloud-based services for nanoscale modeling, simula-
tion, and education. Nanotechnology Reviews, 2, 2013.
6. J. M. Perkel. Why jupyter is data scientists’ computational notebook of choice.
Nature, 563:145–146, 2018.
7/7You can also read