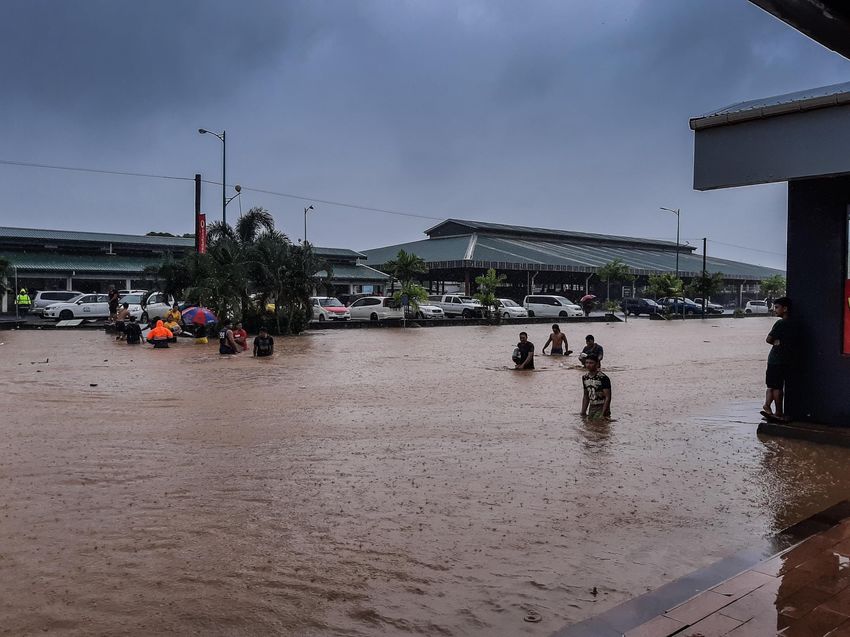
Monthly Climate Bulletin - November 2021 - Photo Credit: Anetone Sagaga image of flooding in Apia 2019 - SPREP
←
→
Page content transcription
If your browser does not render page correctly, please read the page content below
Monthly Climate Bulletin
November 2021

                                                             ISSN: 2617-3557

                Photo Credit: Anetone Sagaga image of flooding in Apia 2019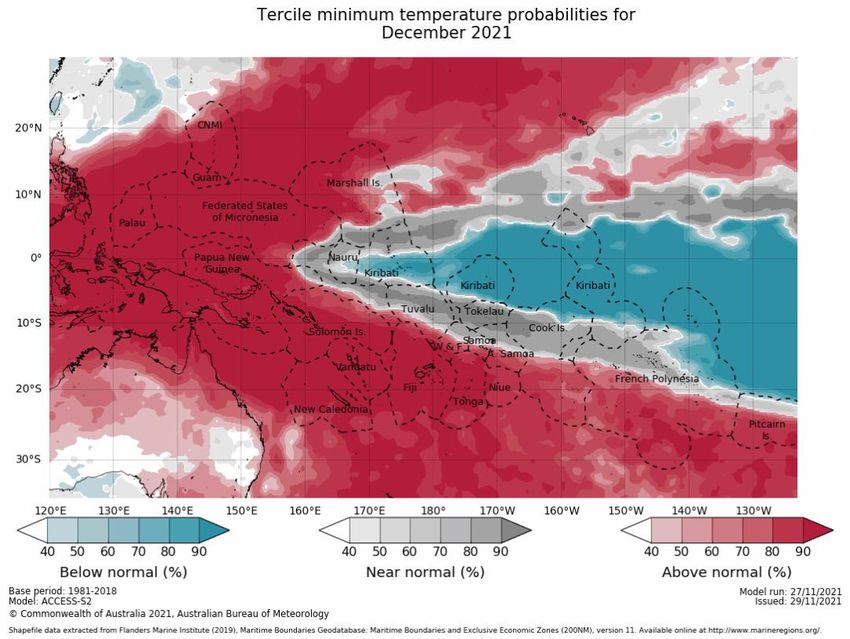
CONTENTS

Summary                        2
El Niño–Southern Oscillation   3
Madden–Julian Oscillation      4
Wind                           5
Cloud and Rainfall             6
Oceanic Conditions             9
Mean Sea Level Pressure        13
Model Outlooks                 14
Cyclones                       17
Further Information            18

1 | Monthly Climate Bulletin
Issued 10 December 2021

•    La Niña is firmly established in the tropical Pacific with climate models suggest this will persist
     until February 2022.

•    The current Madden-Julian Oscillation (MJO) is pulse has weakened in recent days but is ex-
     pected to track eastwards across the Maritime Continent and restrengthen in the coming week
     while in the Western Pacific region

•    The Intertropical Convergence Zone (ITCZ) was active and shifted north of its normal position,
     while the South Pacific Convergence Zone (SPCZ) was active around New Caledonia, Vanuatu
     to New Zealand.

•    The sea surface temperature anomaly pattern in November shows SSTs were warmer than av-
     erage in the far western Pacific while cooler than average SSTs along the central and eastern
     equatorial Pacific Ocean.

•    Coral bleaching status warning 'Alert Level 2' for parts of northern PNG mainland while 'Alert
     Level 1' for other parts of northern and southeast PNG, Palau and FSM. 'No stress' or 'watch'
     for the rest of COSPPac countries. Coral bleaching outlook remains at 'Alert Level 2' for north-
     ern and southern PNG for the next three weeks.

•    A notable sea level anomaly of +300mm observed in Palau and FSM while other COSPPac
     countries recorded between +100mm to +250mm above normal sea level.

•    For December 2021-February 2022, the dynamical models (including SCOPIC) agree on above
     normal rainfall for Palau, Guam, CNMI, FSM, southern RMI, southeastern PNG, most of Solo-
     mon Islands, New Caledonia, Vanuatu, Fiji, Tonga, Niue, southern Cook Islands and southern
     French Polynesia. The models also agree on below normal rainfall for northern PNG, northern
     RMI, northern Solomon Islands, Nauru, Kiribati, Tuvalu, Tokelau, northern and central Cook Is-
     lands, and the northern and central French Polynesia.

•    The weekly tropical cyclone forecast from the ACCESS-S model shows significant increased
     risk in the weeks beginning 12 December and ending 25 December 2021 for the northwest Pa-
     cific, especially in areas around Philippines. There is also increased risks for the southwest Pa-
     cific region especially for PNG, Solomon Islands, New Caledonia, Vanuatu, Fiji and New Zea-
     land for weeks beginning 12 December and ending 18 December.

    © SPREP 2021
    This copyright statement protects our work from commercial exploitation, while ensuring that the information can be freely used for scien-
    tific, educational or research purposes, provided SPREP and the source document are acknowledged.

    2 | Monthly Climate Bulletin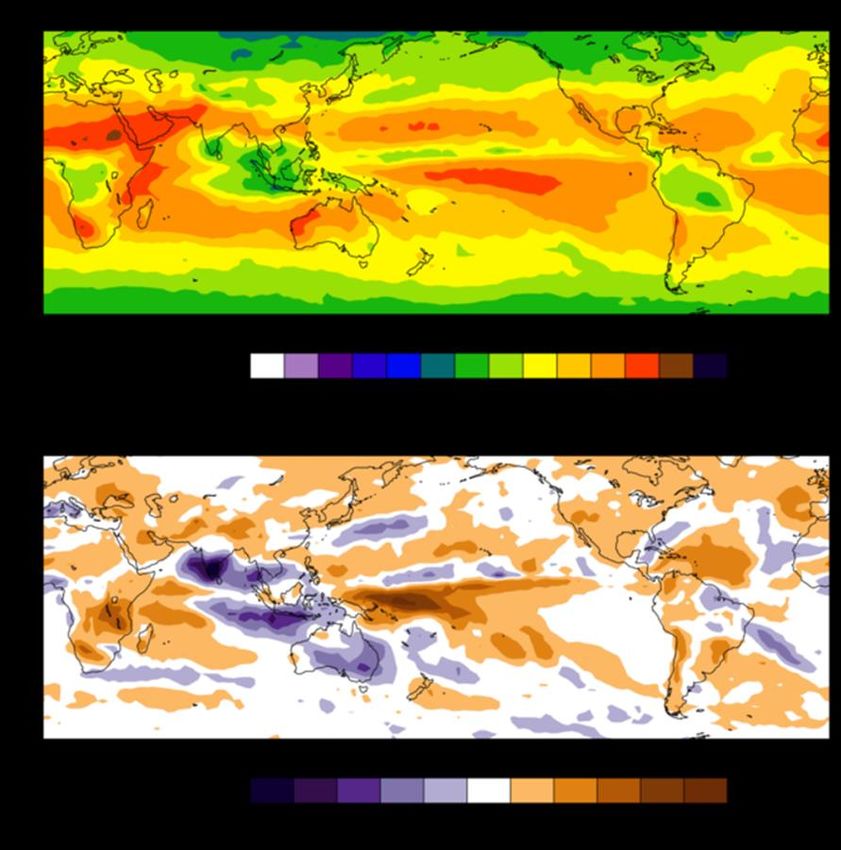
EL NIÑO–SOUTHERN OSCILLATION
La Niña firmly established in the tropical Pacific

Click link to access    Climate Driver Update issued on 07 December 2021

La Niña is firmly established in the tropical Pacific. Climate models suggest La Niña will persist
until the late southern hemisphere summer (February 2022) or early autumn (March) 2022. La Ni-
ña events increase the chance of above average rainfall across much of northern and eastern
Australia and the western Pacific Islands countries during summer.

Most El Niño Southern Oscillation (ENSO) indicators show clear La Niña patterns. Sea surface
temperatures in the tropical Pacific have cooled to La Niña thresholds, with climate model out-
looks expecting them to cool further. In the atmosphere, cloud and wind patterns are typical of La
Niña, indicating the atmosphere is responding to the changes in ocean temperatures. This feed-
back process is known as "coupling", and it means La Niña conditions are now expected to be
locked in until at least the end of summer.

The negative Indian Ocean Dipole (IOD) is near its end, with IOD index values in the neutral
range. However, some signs of the negative IOD persist with increased cloud over the eastern In-
dian Ocean and strengthened westerly winds. Climate models predict the IOD will remain neutral
for the coming months, consistent with its typical seasonal cycle.

The 30-day Southern Oscillation Index (SOI) for the 30 days ending 05 December was +13.8. The
90-day SOI value was +9.9. The 30-day SOI gradually has steadily increased over the second half
of November.

 3 | Monthly Climate Bulletin
EL NIÑO–SOUTHERN OSCILLATION
 La Niña firmly established in the tropical Pacific

 Click link to access             Climate Driver Update issued on 07 December 2021

Bureau of Meteorology NINO3.4 ENSO Model Outlooks for December, February and April

                 Bureau of Meteorology NINO3.4 International Model Outlooks

 Bureau of Meteorology summary of international model outlooks for NINO3.4: http://www.bom.gov.au/climate/model-summary/#tabs=Pacific-Ocean

   4 | Monthly Climate Bulletin
MADDEN–JULIAN OSCILLATION
Click link to access                 Tropical Climate Update [Issued on Tuesday 30 November 2021]

During last two weeks of November, a weak to moderately strong pulse of
Madden-Julian Oscillation (MJO) tracked across the Maritime Continent. In
the past fortnight, a moderately strong pulse of the MJO was located over the
Maritime Continent, to Australia's north. This pulse was likely a significant
contributing factor in the formation of tropical cyclone Paddy, by providing
conditions favourable for the development of the near equatorial trough in the
south eastern Indian Ocean. The current MJO pulse has weakened in recent
days but is expected to track eastwards across the Maritime Continent and
restrengthen in the coming week while in the Western Pacific region. In this
scenario, the MJO is likely to increase the chance of above-average cloudi-
ness and rainfall over far northern Australia and the Maritime Continent. At
this time of year, an MJO in these regions also increases the chance of
broadscale westerly wind-flow developing over the region, including around
northern Australia. As such, the MJO may assist the development of mon-
soonal flow in the southern hemisphere across Maritime Continent longitudes.

This is an abbreviated version of the Tropical Climate Update. Click on the
Weekly Tropical for more information .

 5 | Monthly Climate Bulletin
WIND
Click link to access            Wind plots link

The trade winds in November were stronger over the west and close to average over the cen-
tral and eastern equatorial Pacific for most of the month.

During La Niña events, there is a sustained strengthening of the trade winds across much of
the tropical Pacific, while during El Niño events there is a sustained weakening, or even rever-
sal, of the trade winds.

 6 | Monthly Climate Bulletin
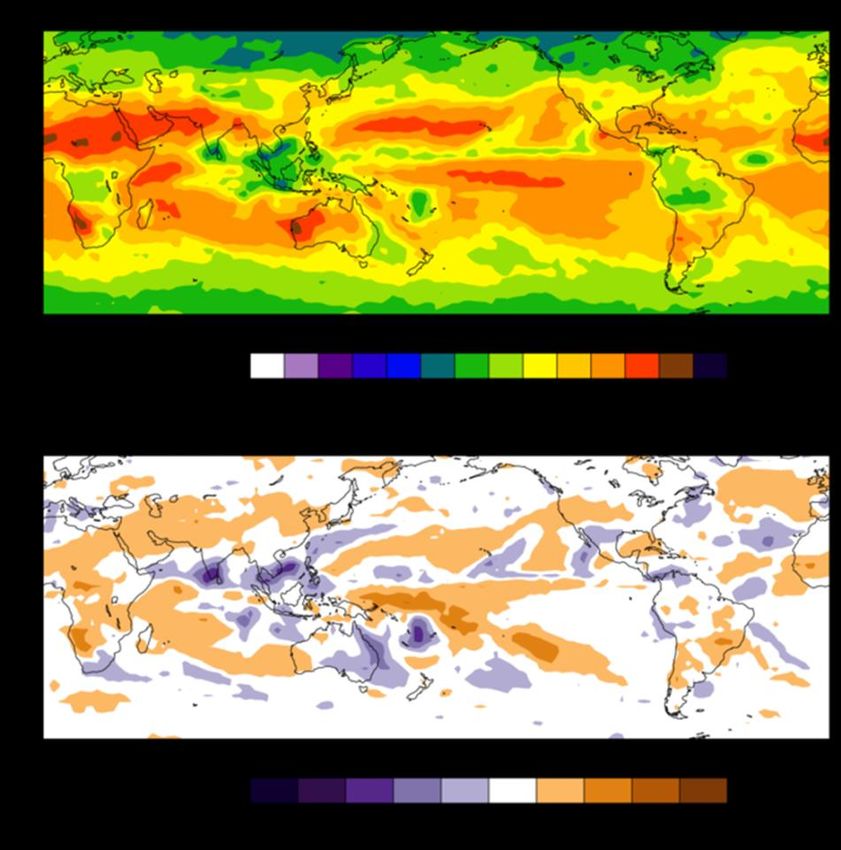
CLOUD AND RAINFALL
Click link to access            OLR

The November 30-day OLR total and anomaly maps suggest the Intertropical Convergence
Zone (ITCZ) was active and shifted north of its normal position, while the South Pacific Conver-
gence Zone (SPCZ) was active and shifted southwest around New Caledonia, Vanuatu to New
Zealand.
Note: Global maps of OLR below highlight regions experiencing increased or decreased cloudi-
ness. The top panel is the total OLR in Watts per square metre (W/m 2) and the bottom panel is
the anomaly (current minus the 1979-1998 climate average), in W/m2. In the bottom panel, neg-
ative values (blue shading) represent above normal cloudiness while positive values (brown
shading) represent below normal cloudiness.

                    OLR Total and Anomalies, 30 Day OLR

 7 | Monthly Climate Bulletin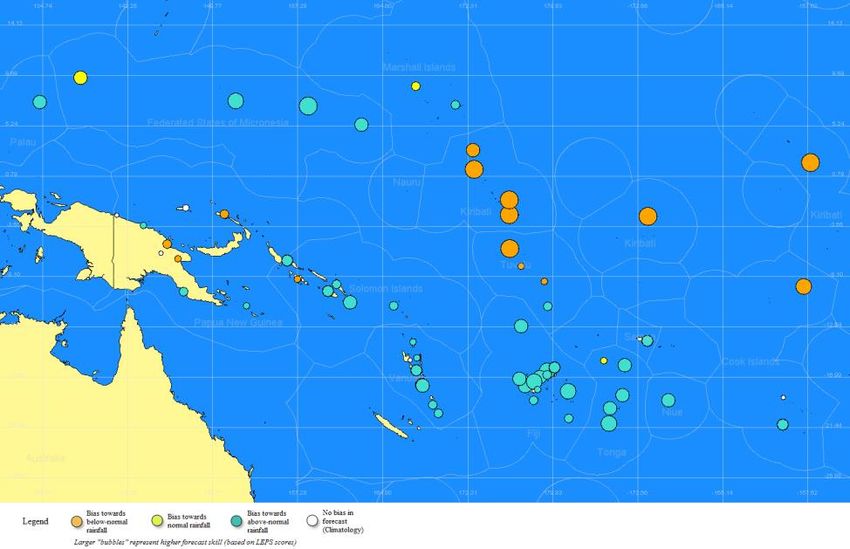
OLR Total and Anomalies, 7 Day OLR

8 | Monthly Climate Bulletin
30-Day Rainfall Anomalies

NOAA Climate Prediction Centre - NCEP CMAP precipitation:
https://ww.cpc.ncep.noaa.gov/products/Global_Monsoons/Global-Monsoon.shtml

9 | Monthly Climate Bulletin
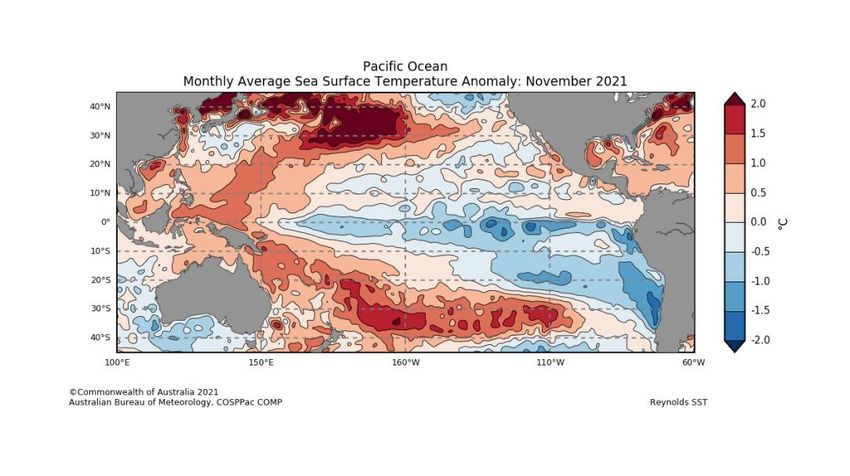
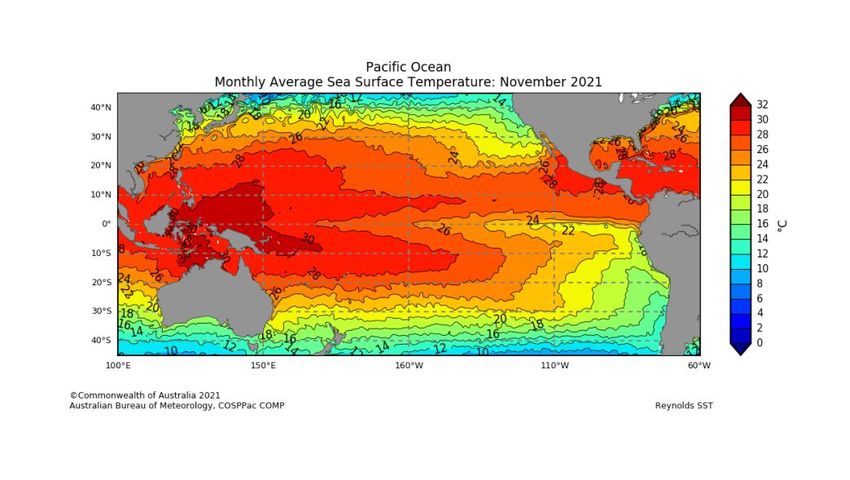
OCEAN CONDITIONS
SEA SURFACE TEMPERATURE
Click link to access Pacific Community COSPPac Ocean Portal
The SST map for November 2021 show weak cool SST anomalies were present across most of
the equatorial Pacific, while warm SST anomalies were largely present across the remainder of
the basin west of 160°E, including around the Maritime Continent and northern Australia.
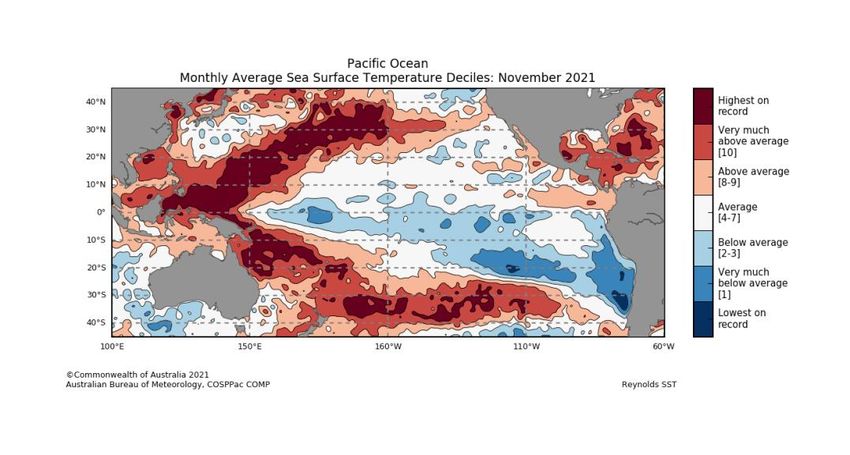
In terms of the deciles, highest on record occurred in Palau, western FSM, northern and eastern
PNG, Coral Sea region, western and southern Solomon Islands, northern Vanuatu, southern Fiji
and Tonga. Patches of highest on record deciles were also observed in New Caledonia and
New Zealand. Regions of very much above average (deciles 10) SSTs spanned across parts of
Palau, western RMI, FSM, PNG, Solomon Islands, New Caledonia, Vanuatu, Fiji and Tonga.
The regions of above average (deciles 8-9) for November occurred across majority of the CO-
SPPac countries from Palau to southern Cook Islands. In contrast, below average (deciles 2-3)
SSTs were observed in Nauru, northern Tuvalu, Tokelau, Kiribati with patches of very much be-
low average (decile 1) over parts of Nauru and eastern Kiribati, and western Kiribati.
Mean Sea Surface Temperature
10 | Monthly Climate BulletinOCEAN CONDITIONS
Click link to access SEA SURFACE TEMPERATURE
Anomalous Sea Surface Temperature
Sea Surface Temperatures Deciles
11 | Monthly Climate BulletinOCEAN CONDITIONS
SUB SURFACE
The four-month sequence of equatorial Pacific sub-surface temperature anomalies (to 18 No-
vember 2021) shows cool anomalies have persisted across the sub-surface of the central to
eastern equatorial Pacific over the past three months. For November to date, waters were more
than three degrees cooler than average across a large region east of 140°W, and reach up to
four degrees cooler than average in some areas. Weak warm anomalies continue across parts
of the column depth in the far west of the equatorial Pacific.
Weekly Temperatures Mean and Anomalies Monthly Temperatures Anomalies
Bureau of Meteorology Sea Temperature Analy-
sis: http://www.bom.gov.au/marine/sst.shtml
TAO/TRITON Data Display: http://www.pmel.noaa.gov/tao/jsdisplay/
12 | Monthly Climate BulletinOCEAN CONDITIONS
CORAL BLEACHING
The daily Coral Bleaching Alert for 05th December 2021 shows 'Alert Level 2' for parts of northern
PNG mainland while 'Alert Level 1' for other parts of northern and southeast PNG, Palau and FSM.
'Warning' for southern Solomon Islands. 'No Stress or Watch' for the rest of COSPPac partner
countries. The four weeks Coral Bleaching Outlook to 26th December shows 'Alert Level 2' for
parts of northern and southern PNG. 'Alert Level 1' for southern FSM. 'Watch' and 'Warning' for
Palau, most of FSM, other parts of PNG, Solomon Islands, New Caledonia, Vanuatu, Fiji, Tuvalu,
Tonga, Tokelau, Samoa, Niue and southern Cook Islands.
Daily Coral Bleaching Alert
(Source: Pacific Community COSPPac Ocean Porta Coral Bleaching)
4-Weeks Coral Bleaching Outlook
(Source: Pacific Community COSPPac Ocean Portal)
13 | Monthly Climate BulletinOCEAN CONDITIONS
OCEAN SURFACE CURRENTS AND SEA LEVEL
OCEAN SURFACE CURRENTS AND SEA LEVEL
Sea level was above normal for most of the COSPPac countries. The highest anomalies above +300mm
were observed for Palau and FSM. Other COSPPac countries recorded between +100mm to +250mm
above normal sea level. Patches of near normal to below normal sea levels were observed east of 170° E
along the equator.
Monthly Sea Level Anomalies
Source: Pacific Community COSPPac Ocean Portal
14 | Monthly Climate BulletinMEAN SEA LEVEL PRESSURE
The November mean sea level pressure (MSLP) anomaly map shows positive anomalies over
west of New Caledonia towards New Zealand. Negative anomalies were present over the eastern
equatorial Pacific around 10°N and 17°N and 154°E.
Areas of above (below) average MSLP usually coincide with areas of suppressed (enhanced) con-
vection and rain throughout the month.
Mean
Anomalous
Bureau of Meteorology South Pacific Circulation Patterns: http://www.bom.gov.au/cgi-bin/
climate/cmb.cgi?variable=mslp&area=spac&map=anomaly&time=latest
15 | Monthly Climate BulletinSEASONAL RAINFALL OUTLOOK
December 2021—February 2022
The ACCESS-S model forecast for December 2021 is very likely to be below normal rainfall for northern PNG, Nau-
ru, Kiribati, Tuvalu, Tokelau, the northern Cook Islands, northern and central French Polynesia. Above normal rain-
fall is very likely for FSM, central CNMI, southern RMI, southeastern PNG, Solomon Islands, Vanuatu, New Caledo-
nia, Fiji, Tonga, Niue and parts of southern Cook Islands and French Polynesia.
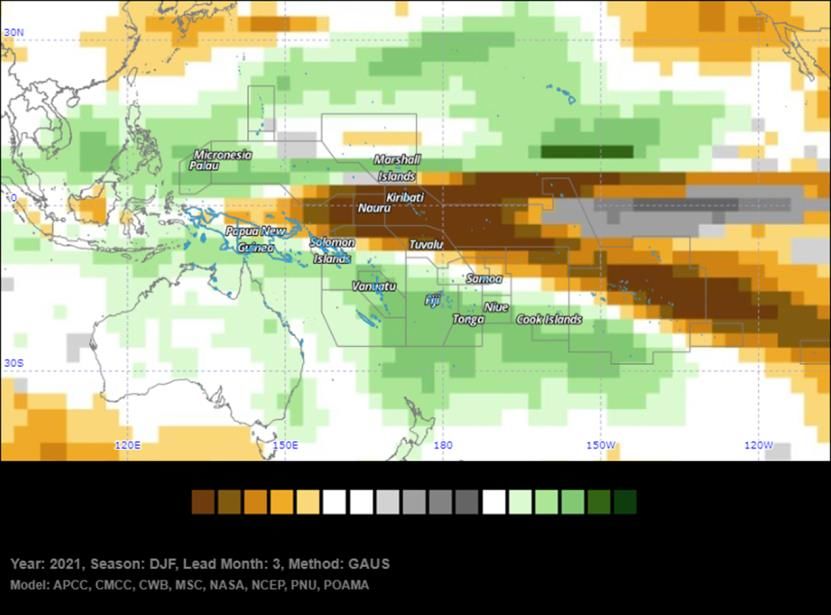
The three-month rainfall outlook (December 2021-February 2022) shows a strong dry signal very likely to affect
northern PNG, northern Solomon Islands, Nauru, Kiribati, Tuvalu, Tokelau, Samoa, American Samoa, northern and
central Cook Islands, northern and central French Polynesia and Pitcairn Island. In contrast, the models show an
increased chance of wetter very likely in Palau, Guam, CNMI, FSM, southern RMI, southeast PNG, Solomon Is-
lands, New Caledonia, Vanuatu, Fiji, Tonga, Niue, southern Cook Islands and French Polynesia. Above normal max-
imum and minimum temperatures are very likely for most COSPPac countries, except for some areas east of 160°E,
namely Nauru, Kiribati, northern Tuvalu, Tokelau, northeastern Cook Islands, and northern French Polynesia, where
near-normal to below normal temperatures are favoured.
Monthly ACCESS-S Maps
The Copernicus multi-model outlook for December 2021-February 2022 is very likely to be below normal rainfall for
the northeastern PNG Islands, western and northern Solomon Islands, Nauru, Kiribati, Tuvalu, Tokelau, northern
and central Cook Islands, French Polynesia, and Pitcairn Island. Above normal rainfall is very likely for Palau, FSM,
Guam, CNMI, southern Marshall Islands, western and southeastern PNG, central and eastern Solomon Islands,
New Caledonia, Vanuatu, Fiji, Tonga, Niue and southern Cook Islands.
The SCOPIC statistical model forecast for December 2021-February 2022 is very likely to be above normal rainfall
for most of the COSPPac countries except for northern PNG, Kiribati, northern Tuvalu, and northern Cook Islands
very likely to have normal to below normal rainfall.
The APEC Climate Centre multi-model for December 2021-February 2022 forecast is very likely to be below normal
rainfall for northern and southern Marshall Islands, northern PNG, northern Solomon Islands, Nauru, Kiribati, Tuvalu,
Tokelau, northern Cook Islands, and central to northern French Polynesia. Above normal rainfall is very likely for
Palau, most of FSM, western and southeastern PNG, most of Solomon Islands, New Caledonia, Vanuatu, Fiji, Ton-
ga, Niue, southern Cook Islands and southern French Polynesia.
For December 2021-February 2022, the dynamical models (including SCOPIC) agree on above normal rainfall for
Palau, Guam, CNMI, FSM, southern RMI, southeastern PNG, most of Solomon Islands, New Caledonia, Vanuatu,
Fiji, Tonga, Niue, southern Cook Islands and southern French Polynesia. The models also agree on below normal
rainfall for northern PNG, northern RMI, northern Solomon Islands, Nauru, Kiribati, Tuvalu, Tokelau, northern and
16 | Monthly
central Climate and
Cook Islands, Bulletin
the northern and central French Polynesia.SEASONAL TEMPERATURE OUTLOOK
December 2021—February 2022
Monthly Tmax and Tmin ACCESS-S Maps
17 | Monthly Climate BulletinSEASONAL RAINFALL OUTLOOK
December 2021—February 2022
Seasonal ACCESS-S maps
SCOPIC
‘About SCOPIC’ www.pacificmet.net/project/climate-
and-ocean-support-program-pacific-cosppac
18 | Monthly Climate BulletinSEASONAL RAINFALL OUTLOOK
December 2021—February 2022
Copernicus (C3S multi-system)-Rainfall
Copernicus Rainfall:https://climate.copernicus.eu/charts/
APEC Climate Information Toolkit for the Pacific: http://clikp.sprep.org/
19 | Monthly Climate BulletinTROPICAL CYCLONE 2021/2022 Season The cyclone activities in the western north Pacific occurs year around with near normal to below normal numbers of TCs an- ticipated. So far in 2021, there have been 24 typhoons in the western North Pacific. There were 4 tropical depressions, 13 ACCESS-S Weekly Forecasts –Northwest Pacific tropical storms, 4 typhoons and 3 super typhoons affection Palau, FSM, RMI, Guam, Saipan and CNMI. In the southwest Pacific, the tropical cyclone season 2021-22 started on the 01 November, 2021. The outlook for the season is enhanced risk for tropical cyclone activity in the western part of the basin over November to April. In the central part of the region, cyclone risks are generally near normal, with reduced chances farther east. Its important to remember that it does not take a severe cy- clone to produce severe impacts. Coastal and river flooding rainfall can occur with a distant, weak or former cyclone. Com- munities should remain vigilant, and follow forecast information provided by their National Meteorological and Hydrological Service (NMHS). The weekly tropical cyclone forecast from the ACCESS-S model shows significant increased risk in the weeks beginning 12 December and ending 25 December 2021 for the northwest Pacific, especially in areas around Philippines. There is also increased risks for the southwest Pacific region especially for PNG, Solomon Islands, New Caledonia, Vanuatu, Fiji and New ACCESS-S Weekly Forecasts –Southwest Pacific Zealand for weeks beginning 12 December and ending 18 De- cember. Individual Model Links UKMO Global long-range model probability maps: http:// www.metoffice.gov.uk/research/climate/seasonal-to-decadal/gpc-outlooks/ glob-seas-prob ECMWF Rain (Public charts) - Long range forecast: http://www.ecmwf.int/en/ forecasts/charts/seasonal/rain-public-charts-long-range-forecast POAMA Pacific Seasonal Prediction Portal: http://poama.bom.gov.au/ experimental/pasap/index.shtml APEC Climate Center (APCC): http://www.apcc21.org/eng/service/6mon/ps/ japcc030703.jsp NASA GMAO GEOS-5:http://gmao.gsfc.nasa.gov/research/ocean/ NOAA CFSv2:http://www.cpc.ncep.noaa.gov/products/CFSv2/ CFSv2seasonal.shtml IRI for Climate and Society: http://iri.columbia.edu/our-expertise/climate/ forecasts/seasonal-climate-forecasts/ 20 | Monthly Climate Bulletin
OTHER INFORMATION

   Southern Oscillation Index

   The Southern Oscillation Index, or SOI, gives an indication of the development and intensity of El Niño and
   La Niña events across the Pacific Basin. The SOI is calculated using the difference in air pressure between
   Tahiti and Darwin. Sustained negative values of the SOI below −7 often indicate El Niño episodes. These
   negative values are usually accompanied by sustained warming of the central and/or eastern tropical Pacific
   Ocean, and a decrease in the strength of the Pacific Trade Winds. Sustained positive values of the SOI
   greater than +7 are typical of La Niña episodes. They are associated with stronger Pacific Trade Winds and
   sustained cooling of the central and eastern tropical Pacific Ocean. In contrast, ocean temperatures to the
   north of Australia usually become warmer than normal.

    Multivariate ENSO Index (MEI)

    The Climate Diagnostics Center Multivariate ENSO Index (MEI) is derived from a number of parameters
    typically associated with El Niño and La Niña. Sustained negative values indicate La Niña, and sustained
    positive values indicate El Niño.

    20 degrees Celsius Isotherm Depth

    The 20°C Isotherm Depth is the depth at which the water temperature is 20°C. This measurement is im-
    portant, as the 20°C isotherm usually occurs close to the thermocline, the region of most rapid change of
    temperature with depth, or the division between the mixed surface layer and deep ocean. A 20°C isotherm
    that is deeper than normal (positive anomaly) implies a greater heat content in the upper ocean, while a
    shallower 20°C isotherm (negative anomaly) implies a lower-than- normal heat content in the upper ocean.

   Regions

   SST measurements may refer to the NINO1, 2, 1+2, 3, 3.4 or 4 regions. These descriptions simply
   refer to the spatially averaged SST for the region described. The NINO regions (shown in the figure
   below) cover the following areas:

    Region    Latitude      Longitude
    NINO1      5-10°S       80-90°W
    NINO2       0-5°S       80-90°W
    NINO3     5°N to 5°S    150-90°W
   NINO3.4    5°N to 5°S   120-170°W

    NINO4     5°N to 5°S 160°E to 150°W
                                                      NOTE: NINO1+2 is the combined areas 1 and 2
21 | Monthly Climate Bulletin
You can also read