Moving Byron Discussion and Data - DD1 - DRAFT Moving Byron 2022-2042
←
→
Page content transcription
If your browser does not render page correctly, please read the page content below

DRAFT Moving Byron 2022-2042

        Moving Byron
                    Discussion and Data

DD1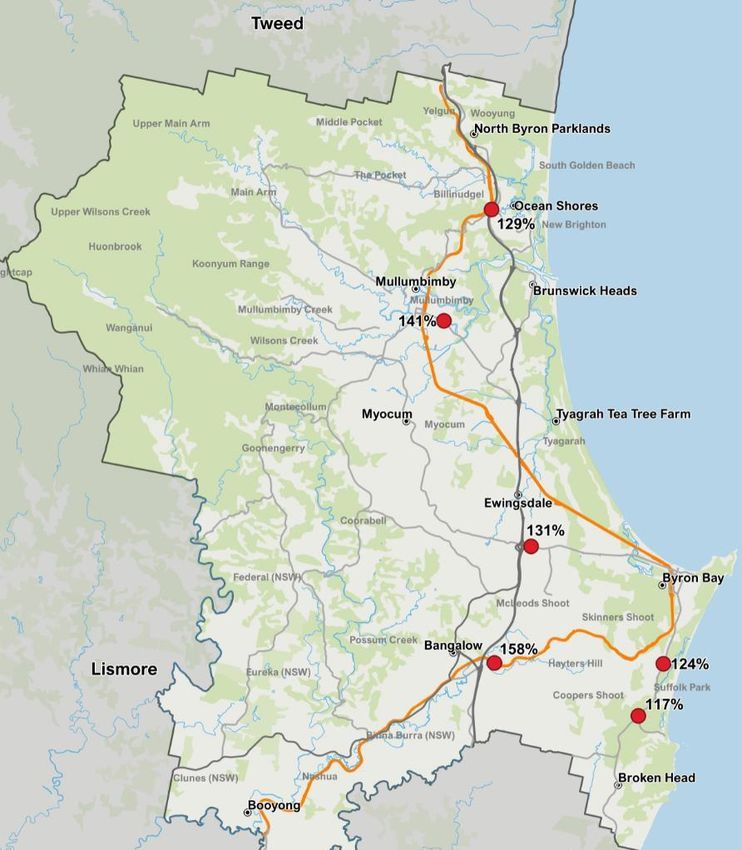
DRAFT Moving Byron 2022-2042

Table of Contents
  A1: Why is Moving Byron needed? ......................................................................... 3
  A2: List of Council’s movement and access policies............................................... 5
  A3: Social and Economic Indicators ....................................................................... 6
  A4: Our Regional and Local Transport Networks ................................................... 9
  A5: Public Transport Case Studies ....................................................................... 16
  A6: Road Safety.................................................................................................... 24
  A7: Action Priorities .............................................................................................. 27
  A8: Transport Options........................................................................................... 28
  A9: Sustainability .................................................................................................. 30
  A10: Community needs, expectations and aspirations ......................................... 31
  A11: Movement Patterns in the Shire .................................................................. 34
  A12: Key Transport Projects ................................................................................. 38
  A13: Sustainability (Assets) .................................................................................. 43

DD2
DRAFT Moving Byron 2022-2042

A1: Why is Moving Byron needed?
Residents and visitors to Byron Shire already experience the transport challenges
that come with rapid growth, very high levels of visitation, congested coastal town
and hinterland road networks struggling to cope, poor public transport and
inadequate walking and cycling links limit movement options.

There is nothing new about this situation. These trends have been building for
decades with the current failings of the transport network being predicted by the
Sydney-Brisbane Corridor Study (DOTARS 2006). The study noted that growth
along the ‘coastal side of the corridor’ is likely to lead to ‘congestion, capacity, safety
and traffic issues’ that ‘will challenge the performance and adequacy of the transport
system’ in a ‘number of key regional locations’ including ‘the Gold Coast and
Northern NSW down to Byron Bay’ (page 28.). This assessment was made prior to
the opening of the Yelgun to Ewingsdale section of the Motorway and Ewingsdale
interchange was completed. Yet these costly upgrades have led to increasing
problems rather than relieving them.

The development and expansion of a national route without sufficient planning, co-
ordination, and funding of regional and local road networks by the three levels of
government responsible has played its part in this getting to this point. In particular
while roads and population have expanded, a critical missing element has been
planning for a diversified transport network offering alternatives to car-based road
movement.

In summary, the financial cost of providing movement corridors for people and goods
are significant and the choices made now can have substantial environmental,
financial and social benefits (or impacts) over time. Clearly it is in the community
interest to make well informed choices now and into the future. Moving Byron takes a
fresh look at how our transport network functions and identifies alternatives
approaches that involve expansion of active, shared and public transport as part of a
connected, diversified and more sustainable movement network.

How has Moving Byron been developed?
The work of bringing the Strategy together has been led by Council’s Transport and
Infrastructure Advisory Committee consisting of community representatives,
Councillors, and staff.

While Federal and NSW transport strategies, policies and regulations are important
considerations in the development of a local strategy, its clear the lack of co-
ordination has not always delivered expected outcomes. It is also the case that the
objectives of State and Federal policies do not always align with the needs and
aspirations of our community, as demonstrated by the conflicts between the
operation of the M1 and sustainability of our local road network. Similarly State
funding programs can conflict and even hinder highly rated values such as access
and safety.

DD3

DRAFT Moving Byron 2022-2042

As such it is important that Moving Byron does not simply replicate the stated aims of
State and Federal policy. To avoid this, Moving Byron has approached the situation
primarily from our community’s viewpoint in three keyways:
   • Transport networks and their operation are critically considered ‘with our
       eyes’. That is an ‘on ground’ assessment of the current situation and
       emerging issues without the policy filters of other levels of government.
   • Critical analysis is informed by our community’s needs and aspirations as
       expressed in the Community Strategic Plan and other data obtained through
       extensive consultation and engagement with community, such as the
       Community Solutions Panel, the Transport and Infrastructure Advisory
       Committee amongst others.
   • The above approaches have identified a disconnect between NSW policy
       characterisations and context of local networks and the way our community
       sees the ‘on ground’ situation. A key insight is the observation that local and
       regional travel is concentrated into two movement corridors and ‘trunk’ routes
       within each of these corridors. This challenges the language of a ‘dispersed’
       and ‘isolated’ population in various NSW policy and opens new and exciting
       possibilities for diversified, better connected and sustainable transport.

These fresh viewpoints have helped to inform the structure of the document and
accordingly, Moving Byron aims to:
   • Describe movement challenges – locally and regional
   • Reflect the aims and aspirations of the Byron Shire community
   • Develop strategic directions to support the paramount objective
   • Identify policy and planning initiatives
   • Identify transport actions and options

As noted, the following NSW policies are critically considered and at times
challenged:
   • Northern Rivers Regional Transport Plan, Transport for NSW, 2013
   • Regional NSW Services and Infrastructure Plan, Transport for NSW, 2018
   • North Coast Regional Plan, Department of Planning and Environment 2017.

In addition, there is an extensive list of Council’s movement polices, plans and
strategies that help to inform and support Moving Byron. Where required, the
strategy identifies new policy and or revisions to existing policy.

DD4
DRAFT Moving Byron 2022-2042

A2: List of Council’s movement and access policies
   •   Byron Shire Community Strategic Plan
   •   Draft Byron Shire Residential Strategy
   •   Byron Shire Business and Industrial Lands Strategy
   •   Byron Shire Rural Land Use Strategy
   •   Byron Shire Open Space and Recreation Needs Assessment and Action Plan
       2017-2036
   •   Byron Shire Pedestrian Access and Mobility Plan 2019
   •   Byron Shire Bike Plan
   •   Strategic Transport Statement (Transport Policy) 2019
   •   Multi Use Rail Corridor Feasibility Study
   •   Byron Bay Town Centre Masterplan
   •   Byron Arts & Industrial Estate Precinct Plan
   •   Bangalow Village Plan
   •   Our Mullumbimby Masterplan
   •   Sustainable Visitation Strategy
   •   Net Zero Emissions Strategy
   •   Biodiversity Conservation Strategy
   •   Business and Industrial Lands Strategy
   •   Economic Development Strategy
   •   Electric Vehicle Strategy
   •   Development Control Plans and LEP’s
   •   Car share policy
   •   Paid parking
   •   Transport Asset Management Plan
   •   Strategic Asset Management Plan 2016-2026
   •   Delivery Program 2017-2021 and Operational Plan 2019-2020.

The Delivery Program 2017-2021 and Operational Plan 2019-2020 bring together
Council’s strategies, plans and budgets to provide services and infrastructure, and to
ensure future sustainability.

The Delivery Program turns the goals set out in the Community Strategic Plan into
broad actions over the medium term while the Operational Plan drills down to
specific projects and activities for the year ahead.

DD5
DRAFT Moving Byron 2022-2042

A3: Social and Economic Indicators
This section provides a range of demographic and social determinants to assist in
identifying current and future movement needs, as well as, assisting to identify
barriers to transport access and the reasons for transport disadvantage.

Population and Housing
It is forecast that there will be an increase in Byron Shire’s population of around 10
percent to 37,950 by 2036, anticipating a need for an additional 3,150 dwellings. Not
all homes will be delivered in the urban areas, with over 400 new dwellings expected
in our rural areas. Population growth will primarily occur in Bayside, Brunswick
Heads, Mullumbimby, and West Byron.

Table A3.1: Population Projection for Local Council Areas

        LGA                    2016                 2041                % Change

         Lismore              44,122               42,944                 -3%
          Byron               33,399               37,955                 14%

         Ballina              42,993               47,092                 10%
         Tweed                93,742               111,531                19%

       Gold Coast             576,918              943,686                64%

Byron Shire is expecting a 14% population increase from 2016 to 2041 with similarly
strong growth expected in coastal areas. Regionally, the most significant growth is in
the northern border at Tweed and adjacent, Gold Coast in Queensland. The latter’s
population is expected to grow by 64% in the same period. This will generate
increasing social, economic, and cultural links that in turn will see continuing and
substantial people and goods movements between the Gold Coast and Byron Shire.
While population is not expected to increase in Lismore City over the period, its
status as a regional service centre and source of employment opportunities is likely
to continue to drive a two-way growth in people and goods movement in the East-
West corridor.

Fig A3.1 shows a breakdown of the age structure with the Byron Shire population
compared to regional NSW. In 2016 our population was tilted towards middle age
brackets (35-65) with younger and older people less represented. This pattern is
consistent with previous census data and highlights difficulties faced by younger
people in accessing education, employment and training who leave the local area for
opportunities elsewhere. Poor transport connections are regularly cited as a difficulty
facing young people as they seek to move to higher education and employment in
the Shire and across the region.

DD6
DRAFT Moving Byron 2022-2042

                 Figure A3.1: Byron Shire Age Structure (2016)

Ageing Population
As can be observed in Figure A3.2, the percentage of people over 65 years of age is
expected to noticeably increase in the future, going from 16% in 2016 to a projected
28%. It is expected that there will be greater demand for healthcare and recreational
travel as the population gets older. As of now, the trip purpose is 34% health care
related. The demand for modes of transport will also need to adjust with more shared
transport, specialist vehicles and services likely to be needed.

                30%

                25%

                20%

                15%

                10%

                5%

                0%
                2016      2021    2026       2031    2036     2041
                                  Projection years
      Figure A3.2: Byron Shire ageing population trend and future forecast

DD7
DRAFT Moving Byron 2022-2042

Unemployment
According to a Council demographics review in 2017, Byron has an unemployment
rate of 8.5% as opposed to the NSW average of 6.1% and National average of 5.6%.
The youth unemployment is also high at a 15.5% with 11.8% of the youth unengaged
in any work or studies. With a high turnover and a strong tourism industry, the region
has a significantly higher percentage of part-time employment at 47%, with the NSW
average at 32%.

Income
In the same review, the reported median income of $1,143 per week in Byron is also
lower than the NSW average of $1,500. Despite the lower income Byron property
prices on average are higher than the NSW average by $125,000.

Travel Disadvantage
While Byron Shire is often seen as a holiday and tourist destination with limited
diversity in non-tourist industries, the Shire does have parts of the community which
are socially and economically disadvantaged. The relationship between socio-
economic disadvantage and travel disadvantage is often circular in that each can
exacerbate and entrench the other. For example, lack of access to a car can limit
employment and education opportunities with a consequent drop in income that
reduces the ability to overcome transport barriers.

Socio-Economic Deprivation
The Socio-Economic Indexes for Areas (SEIFA) Index of Disadvantage measures
the relative level of socio-economic disadvantage based on a range of Census
characteristics.9 The coastal areas and Lismore are regarded as socially advantage
compared to the rest of the region, however, there are rarely any areas that can be
considered the most advantaged. The most deprived areas are generally at local
centres such as Lismore and Tweed Heads, with Byron Shire being the exception to
this observation. Details of the individual areas can be seen in Figure A3.3, taken
from the Australian Bureau of Statistics.

DD8
DRAFT Moving Byron 2022-2042

      Figure A3.3 Byron Shire ageing population trend and future forecast
A4: Our Regional and Local Transport Networks

This section takes an on-ground view of our transport networks, their operation and
emerging issues to:

DD9
DRAFT Moving Byron 2022-2042 • Describe movement challenges – locally and regional • Reflect the aims and aspirations of the Byron Shire community • Develop strategic directions to reduce car dependence • Identify policy and planning initiatives • Identify transport actions and options. Roads rate as the most important issue for Byron Shire residents and there is much community discussion on the subject for good reason given the services the road network provides. Whether we drive, use shared transport, ride a bike or walk, virtually all our movement in the Shire is by road. Public transport, access and safety issues also rate highly. How the Shire’s transport network connects with the region and beyond has a major influence on movement patterns. Topography, climate and historical construction of our roads add to challenges of providing a safe and accessible network. For these reasons it is important to beginning by consider the wider context. Byron Shire is located on the North Coast of New South Wales (NSW), approximately 800 kilometres north of Sydney and 200 kilometres south of Brisbane, with shared boundaries with the Tweed, Lismore and Ballina Local Government Areas, within the broader Northern Rivers Region a region known as the Northern Rivers. Byron Shire is connected to the region along two key movement corridors. North-South Movement Corridor Byron Shire is bisected by the M1 Motorway, running north-south in a Coastal Corridor. The catchment for this national route extends beyond the coastal shires and includes most of the Northern Rivers. The Mt Warning caldera and Bother Ranges preclude the development of alternative cross border routes and as such traffic will continue to increase long the Coastal Corridor. The M1 is the primary link connecting the major population centres in the Shire as well as the primary link for travel between coastal regions to the south, the Gold Coast and Brisbane. There is a significant daily commuter and visitor movement between the north and south of the Shire. While the old Pacific Highway alignment provides diversion routes within the north-south corridor, connections between them remain via the M1. The M1 is the primary route for the significant numbers of tourist visitors to Byron Shire. A key driver of the growth in visitor numbers moving within the north south corridor is the ongoing expansion of Gold Coast Airport on the Queensland border and to a lesser degree, the Byron-Ballina Airport to the south at Ballina. An alternative diversion route in the south of the Shire is Bangalow/Broken Head Road (‘coast road’) that links Byron Bay, Suffolk Park and Broken Head to Lennox Head and connecting with the M1 at Ballina. There are currently poor shared transport links connecting the northern and southern ends of the corridor. The rail corridor is part of the movement corridor connecting the town centres of Mullumbimby, Byron Bay, Bangalow and Billinudgel (Ocean Shores) within the Shire. Covid induced periods of border closures and restricted movements have emphasised the increasingly important social and economic links between Byron DD10
DRAFT Moving Byron 2022-2042

Shire and South East Queensland. Visitors and travellers join significant numbers of
daily commuters, people accessing services such as healthcare and goods
supplying and supporting a range of key industries such as agriculture and
construction.

Emerging issues

M1 Interchange at Ewingsdale
Taken together the above characteristics are combining to induce significant traffic
congestion including back up on the Motorway around the Ewingsdale interchange at
peak commuting and holiday times. This is affecting the operation of the motorway
and increasing safety risks.
To date proposed solutions would in part shift the congestion into the east-west
corridor that intersects with north-south corridor at the interchange. This impacts
would exacerbate the impacts of increased vehicle numbers on Ewingsdale Road.
An alternative approach is to diversify transport options and utilise the rail corridor to
mode shift from cars to active and shared transport and reduce growth in demand for
road space. As such issues are emerging at other interchange locations, notably
Gulgan North and Bangalow, planning to activate the rail corridor in the Shire can get
a head start on tackling the problem.

Safe, access and movement
As a high-speed Motorway, the M1 significantly limits access, especially for active
movements. There are only six opportunities to cross from the hinterland road
network to the west of the M1 to the east. Only one of these, at Billinudgel, is a
pedestrian crossover. The other five all involve the negotiation of roundabouts with
heightened risks to cyclists and pedestrians. Ewingsdale interchange is not
accessible for foot traffic and unacceptable unsafe for cyclists.
There needs to be safe access infrastructure in place at Motorway crossings, both to
ensure unrestricted movement and to encourage active movement choices for
residents and visitors in hinterland locations.

East-West (Bruxner) Corridor
This corridor extends from Byron Bay to Lismore and further west along the Bruxner
corridor terminating at Tenterfield where it links with the New England Highway.
Movement is concentrated along the Ewingsdale Road/Hinterland Way route
connecting at Bangalow with the Lismore-Bangalow Road. The Nightcap range and
Wilson River have shaped links and settlement patterns along this route that
connects key regional populations in Lismore, Casino, Grafton and Kyogle
There are significant commuter and visitor movements within this corridor. Daily
movements by Shire residents to neighbouring LGAs is higher in this corridor with
traffic growth at Bangalow exceeding growth at Ewingsdale and Gulgan Road
interchanges. The intersection with the Coastal Corridor is at the Ewingsdale
interchange, exacerbating the congestion, access and safety issues discussed
above.
Trip drivers to and from the regional centre of LIsmore include University, TAFE and
school students, Lismore Base and St Vincents hospitals, government services and
retail. There are also significant movements of workers between Lismore and
centres in Byron Shire. Together this results in a high number of commuter vehicle
movements in both directions during AM/PM peaks.

DD11
DRAFT Moving Byron 2022-2042

There are currently poor public transport links within the East-West corridor that are
unable to meet the needs of many of these daily commuters. The rail corridor runs
within this movement corridor and connects the town centres of Byron Bay,
Bangalow, Lismore and Casino.

Key features of regional corridors
As noted, geography has played a key role in the development of and concentration
of the Coastal and Bruxner corridors both for movement and settlement.
Apart from very local movement, travel within and beyond each corridor involves
using minor roads to feed onto key trunk routes, being the Pacific
Highway/Hinterland Way and the Coast Road in the Coastal Corridor and
Ewingsdale Road/Lismore-Bangalow Road in the Bruxner. These trunk routes have
to be used for all modes of travel. As such people and vehicles are concentrated
onto these key roads.
It is also the case that these roads link the key population centres within the Shire
and across the Region in a linear fashion.
These features challenge the language of a ‘dispersed’ or ‘scattered’ resident
population especially in relation to the provision of shared transport as key
catchments are linked by these truck routes. Movement patterns rather than location
of population centres shows concentrated, as opposed to dispersed, movement. In
addition, high visitation adds to concentration of movement, sometimes beyond the
capacity of existing road networks. Together the concentration of movement within
corridors suggests there is scope to improve public transport links along trunk routes.
While larger towns and population centres within both corridors are serviced by
shared transport such as buses, there are significantly fewer services connecting
towns along the regional trunk routes. In the past, such services were provided by
rail operating on the Casino-Murwillumbah line that runs in tandem with the key trunk
routes in both corridors.

Rail Corridor
The Casino to Murwillumbah Rail Corridor is a 130 kilometre rail corridor that was
opened in 1894. It was built to move goods and people between towns located in
these corridors, heavily influencing regional settlement patterns. Today eight of the
ten largest population centres in the Northern Rivers are linked by rail and retain rail
stations at their heart. When the line was connected to a state wide network
following construction of the Clarence River crossing at Grafton, the focus of the line
began to change.
During the post war boom that bought better roads and a rapid uptake in car use,
local services were discontinued in favour of long distance intercity services.
Although less frequent, for many decades these services continued to provide a daily
return link across the region until 1990 when this was replaced by an overnight
express to Sydney. This was discontinued in 2004 and the line closed despite many
years of community advocacy for a return of local services able to meet the daily
needs of commuters and visitors.
The corridor is strategically located within regional corridors and there are a number
of opportunities to use the corridor to support the goals of Moving Byron.
Mode shift with active and shared transport in the rail corridor
Utilise as key alternative to car use within the Ewingsdale Road Corridor as part of
integrated strategy incorporating park and ride, active and shared movement options
and town centre parking management.

DD12
DRAFT Moving Byron 2022-2042

Improve public transport connections, regularity and convenience
Provide opportunities for visitors to arrive and move about without car use as part of
well connected public, shared and active networks.
Council has undertaken a Multi-Use Rail Corridor Study (MURC) and is pressing
activation of the corridor as a central plank of a sustainable, diversified and
connected transport network.

Urban roads
All urban road networks in the Shire are serviced by the two key movement corridors
with the greater proportion located in the coastal zone. Mullumbimby and Bangalow
being the two larger centres located to the west of the M1 Motorway.
There is variation in the layout of urban networks from older grid layouts dominating
in Byron Bay and Mullumbimby to widespread cut de sac layouts in Ocean Shores.
These different layouts are a key influence on movement behaviours and
constraints, often favouring cars over active movement or making access difficult for
shared and active transport.
Like many regional areas, the cores of townships in Byron Shire are centred around
main streets which have become vehicle centric. These types of main streets lend
themselves to conflict, seeking to serve both a ‘movement’ function (in terms of
movement of goods and people, often by vehicles) and ‘place’ function where people
feel comfortable to spend time and shop, dine or socialise. Such conflicts have
increased with popularity and high visitation in coastal towns and are now apparent
in hinterland villages such as Federal.
The various town and village masterplans have identified a preference for people
centred places that are not dominated by cars and traffic.
Safe, accessible and connected pedestrian infrastructure is often lacking in many
parts of the urban road network, although Council with the assistance of TIAC has
adopted Bike and PAMP plans is rolling out projects in many parts of the urban road
network.
There is a need to improve the provision of well connected and safe pedestrian
access both within some of the existing urban areas and in new urban releases.
Development Control Plans (DCPs) need to be reviewed to ensure that development
is laid out so as to prioritise convenient active and public/shared transport links that
encourage reduced car use.

Hinterland and Coastal Roads
Hinterland roads primarily refer to the networks to the west of the M! Motorway.
Coastal roads outside towns are less extensive and generally service small
populations though some such as Broken Head Road and Seven Mile Beach Road
that experience significant pressure from visitors.
Hinterland road networks in Byron Shire are necessarily extensive due to topography
with ‘no through road’ access into valleys and connection to a key trunk road being
common features. Travel between towns in Byron Shire is via the two primary roads
in the Coastal and Bruxner movement corridors.
As is the case elsewhere hinterland roads provide a number of services to
communities. Cyclists and walkers need safe access alongside motorists, as do
school children catching buses. Delivery of goods, post and roadside collection of
waste are other services dependent on access to a safe road network.
Hinterland road networks are largely built on original formations and are susceptible
to significant damage at times due to a combination of slope, soils and climate.

DD13
DRAFT Moving Byron 2022-2042

Heavy rainfall events can lead to land slips that can limit or even cut off access
completely. In 2013, Cyclone Oswald delivered 11 major land slips overnight, the
most serious cut road access for the community of Upper Coopers Creek for many
months.
Narrower pavements and lack of shoulders can make it unsafe for residents to
consider active transport and create conflicts between the various services that the
network has to provide. Without a safe and accessible rural road network, rights of
movement may be compromised. As such there is a need to balance the needs of all
road users and services. Due to funding and topographical constraints the most cost
effective solution is to take a more considered approach to safety and access on
rural roads and where necessary reduce speed limits. A safe and accessible network
is essential to the support of aim of reducing car and increasing active movement
especially while public transport is not regular or in many instances, even available.

DD14
DRAFT Moving Byron 2022-2042

Traffic Growth
From local traffic count sites shown in Figure 2.15, there is an observed growth in
traffic amongst the various town centres and accesses to state highway or motorway
(35). Daily traffic on Ewingsdale Road to the M1 Motorway is an indicative measure
of traffic going in and out of Byron Bay to other regional areas. From 2006 to 2016,
the daily traffic grew from 16,600 to 21,700, which is a 31% increase.
Further north at Mullumbimby Road, which is the main entrance from the M1 to
Mullumbimby, from 2006 to 2019, there was 41% traffic growth to an average daily
estimate of 12,350. The highest growth of 58% has occurred at Bangalow indicating
the importance of the east-west corridor. Other count sites at Ocean Shores and
Suffolk Park had increases in traffic between 24% and 29%.
Overall, the traffic volumes in the Byron Shire have all increased significantly;
indicating demand for regional travel between the centres is growing and placing
more pressure on the road network.

                Figure A4.8 – Sample Traffic Counter Locations

DD15
DRAFT Moving Byron 2022-2042 A5: Public Transport Case Studies Public transport is a term that needs to be carefully considered as publicly accessible transport is often provided by privately owned operators. In one sense all transport is public as road, rail and other infrastructure is invariably a public asset or subsidised by public funding. For example, privately owned cars are driven on public roads. Similarly public transport services are often a mix of private operators and public funding as is the case with bus services in Byron Shire and the Northern Rivers. In this discussion, public transport generally refers to bus and rail services, however funded. However, it is worth considering the broader range of shared transport options as part of a publicly accessible transport network. Taxis, Ubers and car share services are increasingly part of the mix of shared options that can help to reduce the use of private motor vehicles and can link with public and active transport to increase the number and convenience of travel options. Considering the public funding of roads and active links, the distinction between public and private is only relevant to a distinction between a private vehicle and a shared conveyance. Public transport in Byron Shire and surrounding region is primarily delivered by private bus operators coordinated and funded by TfNSW. In addition to routed services, there is a significant school bus network deployed twice daily during term times that transports around 10,000 students. A privately funded solar powered rail service operates between Byron Bay and North Beach, a distance of 3 km. The services are primarily targeted towards tourists and demonstrates the potential of the rail corridor to further reduce the number of cars entering the Byron Bay town centre. There are several private bus operators providing airport transfers, servicing Coolangatta and Byron-Ballina Airports. These services help to reduce the number of vehicle movements, particularly in the north-south corridor and the Byron Bay town centre. Skybus, an operator of large express airport transfers, has recently commenced operations in Byron Shire. See Skybus Case Study below. Community Transport provides several critical services to travel disadvantaged people on low incomes including medical and other appointments as well as social and shopping bus runs under a Community Transport Program and Community Home Support Program. There is more demand than can be catered to, in part due to the lack of general shared transport options. Community Transport is an NDIS provider of transport services for NDIS participants. Public transport is not widely used, with existing services limited in coverage and irregular. Bus services are largely planned around school services, limiting public transport options to key services for commuters. There is also little timetable and service integration, and this provides further disincentives to use public transport. Public transport development and policy has been hindered by poor rationale based around a “low resident population” and a failure to acknowledge the very significant numbers of tourist visitors moving around the region on our strained transport networks. DD16
DRAFT Moving Byron 2022-2042

Case Study 1 – Public Transport (Buses) between Mullumbimby and Byron
Bay
The following is a case study on how someone can plan to travel from Mullumbimby
to Byron Bay Bus Interchange.
 Route              Connections     Evenings/Week Frequency            Comment
DRAFT Moving Byron 2022-2042

Route             Connections   Evenings/Week Frequency        Comment
DRAFT Moving Byron 2022-2042

Route               Connections        Evenings/Week Frequency               Comment
DRAFT Moving Byron 2022-2042

that might otherwise be able to provide better public transport integration at other
times.

DD20
DRAFT Moving Byron 2022-2042

Case Study 3 - Skybus: Connection, Convenience, Integration, Success

Skybus operates express coach services to and from a number of airports in
Australia and New Zealand. The ‘flagship’ service operates between Melbourne
Airport and the city centre, growing from modest beginnings in 1978 to now carry
over 2 million passengers per year and 8.3% of all Melbourne Airport passengers.
Success is built on the operation’s connectivity, convenience and integration.

Connection
  • Door to door pick up and set down at Terminals 1 and 3, pickup at Terminal 4
     and short pedestrian link of Terminals 2 and 4 to 3.
  • Express service between Melbourne Airport and city centre (Southern Cross
     Station).
  • Transfer hub at Southern Cross connects with multiple hotel and airport
     transfers to and from suburbs.
  • Hub is located within the rail station with easy access to City Circle,
     metropolitan and regional rail services.
  • At the front door of the station step out onto the footpath and catch a tram or
     taxi.

Convenience
  • Easiest option to access with Skybus stops, ticket booths and attendants
     located right outside the arrivals door.
  • Attendants on hand to assist with luggage and boarding.
  • Service operates 24 hours every 10 minutes, 365 days a year between 6:00
     am and midnight and between 15 and 30 minutes outside these hours. Since
     2015, services have averaged 350 per day and a 5 minute frequency has
     been achieved during peak periods.
  • 20 minute door to door service making it competitive with taxis on access, trip
     time and fares (currently an on line ticket is $15).
  • Additional value with free wi-fi and tourist information on board.
  • Undercover transfer hub at Southern Cross connecting with transfer and rail
     services within the station, tram and pedestrian networks at the front door.
     Airport bound similarly convenient.

Integration
    • In 2002 the Victorian Government partnered with Skybus to improve the then
      service. This included updating the fleet as well as improvements to the
      Tullamarine Freeway to give Skybus priority in traffic.
    • Proposals to turn emergency lanes into bus lanes on the freeway and Bolte
      Bridge as well as include Skybus on a Myki fare (cheaper tap and go ticketing
      for public transport) were challenged by the operator of the Citylink toll road
      and Melbourne Airport as likely to reduce toll revenue and car parking profits.
    • Skybus integration frees up significant road space. Travel times for all
      vehicles between the city and airport continue to extend out during congested
      peak periods. Compared to the estimated 7000 taxi trips on the freeway each
      day, the Skybus fleet is able to move people faster and using less road space.
      Recently the fleet has been extended with high capacity double decker buses
      that use no more fuel.

DD21
DRAFT Moving Byron 2022-2042
• Connectivity to other services and transport modes such as rail help further
reduce car use to and from the city centre and airport.
Skybus has continued to grow and now operates similar services at a number of
other airports including Hobart, Auckland, Avalon and since 2017, Gold Coast. The
range of services has expanded to hotel transfers (eg Gold Coast), urban and
regional airport transfers.
The key features of all are fast express services with minimal stops at major transfer
points, convenience, connectivity and competitive pricing.
In 2018, Skybus introduced an express connection between Byron Bay and Gold
Coast Airport.
Public transport as central element of movement networks.
A regular and consistent public transport network would improve community
connectivity, provide convenient access to employment, health, education, and many
services as well as improve safety for commuters. The benefits to community
resilience by ensuring the opportunity for residents to fully participate in the social,
economic, and cultural life of the community are extensive, as are the costs of
limiting access. As such a shift in focus is required so that public transport is seen as
a core element of transport networks, rather than a need addressed only at the
margins. The latter approach highlights the lack of connectivity and tends to
perpetuate the problem by targeting limited funding towards isolated projects on the
periphery of movement networks.
Public transport that is well connected to active links and integrated with other
shared transport, such as car share, can help reduce the number of cars on our
roads and reduce demand for parking. Such an integrated network could also be
attractive to tourists for getting about the Shire and region and could encourage
tourists to not rely on private vehicles for entry to the Shire.
In addition to regular connected services, achieving a significant mode shift towards
public and other shared transport needs to be well located, accessible and
affordable. In a word convenient. The relative convenience between modes of
transport, particularly compared to private cars, is a key factor in transport choices.
There are several measures that can be taken to help make public and shared
transport more convenient including.
• Planning for centrally located public transport interchanges.
• Review planning controls so that future development ensures active and
public transport links are located to maximise convenience and reflect the
movement hierarchies adopted by the various village and town centre
masterplans.
• Ensure that proponents are required to include active and public transport
infrastructure when developing subdivisions.
• Economic incentives that reflect the costs of driving.
• Parking management including park and ride.
• Prioritise active and public transport access. Bus lanes, rail corridor.
DD22DRAFT Moving Byron 2022-2042
Convenience
As an example of comparative convenience, the public transport network from the
Byron Bay town centre only provides access within 30 minutes to Suffolk Park to the
south and the North Beach / Arts and Industry Precinct to the west. On the other
hand, car accessibility from Byron Bay covers most of the townships in the Local
Government Area and while driving a car, covers access further north into the Tweed
Local Government Area and south into the Ballina Local Government Area. This
would suggest that relative convenience using public transport would need to
combine express transit with efficient connection to active, shared and private (i.e.
park and ride) transport links.
In the case study above, the significant service gaps between the northern and
southern parts of the Shire could be addressed by connecting the existing northern
town centre bus service in Mullumbimby with an express service direct to the Byron
Bay town centre. One way of overcoming the ‘time penalty’ would be to use the rail
corridor to avoid traffic at the M1 interchange and in the Ewingsdale corridor.
Convenience would be maximised at peak times and could appeal to commuters,
locals, and day tripper tourists, particularly when combined with measures referred to
above. Use of hi rail provides an opportunity for neighbourhood pickup without the
need for transfer, a door-to-door service.
Regional transport integration
Transport for NSW are working with stakeholders in both NSW and Queensland on
improving transport connections between the North Coast and the Gold Coast,
including investigating:
• Extension of light rail from Gold Coast airport to Tweed Heads.
• Corridor protection for higher speed connections along the east coast.
• Bus and coach improvements to improve connectivity.
• New servicing patterns and infrastructure to enable better connections and
day return opportunities for regional communities.
• Integrating and harmonising fares for cross border regions.
• Harmonising cross border licencing, registration and regulatory requirements.
• Jointly prioritising infrastructure investment on either side of the state border.
Planning for diversified transport connections with South East Queensland
With the current and future growth in the Shire and broader region expected to put
increasing demands on transport networks that will struggle to improve levels of
service regardless of the level of upgrades, it is increasingly apparent that the region
needs to plan for a diversified transport network incorporating better public transport
infrastructure including rail. Queensland has been expanding capacity on the
Southern Rail line and developing light rail. Increasingly there is a need to plan for
infrastructure and services in Northern NSW. The border is not a relevant or rational
reason not to plan for connection to the Queensland rail system. Continued reliance
solely on road-based networks dominated by cars, is not financially, socially or
environmentally sustainable.
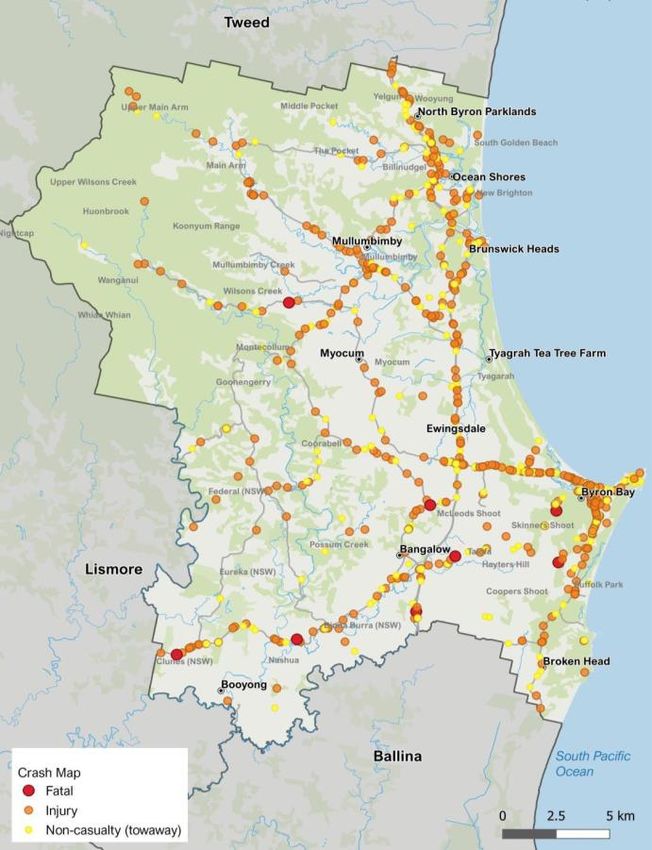
DD23DRAFT Moving Byron 2022-2042 A6: Road Safety Context Road safety forms part of the Premier’s Priorities relating to Safer Communities, with most road fatalities occurring in rural areas. The intent is to reduce road fatalities by at least 30 per cent between 2011-2021. The 2021 Road Safety Plan outlines a number of priority actions including creating liveable and safe urban communities; this includes the expansion of 40km/h high pedestrian activity areas, safety upgrades at intersections and safety integration in bicycle network programs. A Safe Systems approach has been adopted which looks at safe roads (and intersections), safe speeds, safe vehicles and safe people. Whilst this moves away from the traditional crash cluster analysis to identify specific crash issues, an understanding of historical road crashes provides an understanding of prevalent types of crashes within the Shire. A crash map of Byron Shire for a five-year history from 2014 to 2018 is shown in Figure A6. A total of 818 crashes were recorded in the Shire during this period. Detailed analysis of the crash history of the Shire indicates that the most frequent location for crashes is along major roads including Bangalow Road with three fatal crashes, and the Pacific Highway and Hinterland Way with 1 fatal crashes likely related to high traffic speed. There were no fatal crashes in Byron Bay, Mullumbimby and other town centres between 2014 to 2018, although the number of injury crashes are substantial. Approximately 12% of crashes involved cyclists and pedestrians within the Shire and more than 92% of the crashes involved cars with 8 fatal crashes. DD24
DRAFT Moving Byron 2022-2042

  Figure A6 - A crash map of Byron Shire for a five-year history from 2014 to
                                    2018

The Safe Systems approach is not reflected uniformly in road funding as has been
demonstrated through a number of State funded ‘road safety upgrades’ where the
focus has been on ‘vehicular’ traffic and identified risks to pedestrians and cyclists
are unable to be funded under program guidelines. In addition, much of the safety
‘infrastructure’ can be seen to reduce safety for pedestrians and cyclists. These
issues are exacerbated on the Shire’s network due to topography, original formations
that do not meet current standards and narrow pavement widths

Viewing safety from one user perspective is reducing safety and access on
hinterland roads for other road users and services such as buses. Under this
approach rural roads are viewed solely as ‘movement’ corridors for ‘vehicular’ traffic,
when there are still significant numbers of ‘place’ features along rural roads.
    • Cyclists
    • Pedestrians
    • Buses - on hinterland roads this is mostly school bus
    • School children and others waiting, getting on and getting off busses, mostly
       along route rather than at centralised bus stops.
    • Rubbish removal services.
    • Property access.
    • Delivery services including floating of large machinery.
    • Road and tree maintenance workers.

The crash statistics above highlight speed as a key contributing factor and it can be
noted that all fatal crashes occurred on hinterland trunk routes or regional arteries
within the two movement corridors. Yet addressing speed is not a central feature of
the program. The funding of ‘safety upgrades’ is mostly consumed in infrastructure
aimed at mitigating the impacts of speed rather than reducing speed and as noted
none is able to fund identified risks to other road users. It is the placement of hard
infrastructure along pavement shoulders of topographically challenging and narrow
roads that introduces new hazards for cyclists, pedestrians, and services. This also
can signal to vehicular traffic that the road is regulated solely for their benefit and can
lead to a reduced awareness of other road users.

Acknowledging that historical formations and topography can often constrain
prospects of creating separated infrastructure for pedestrians and cyclists, an
equitable and affordable approach would be to reduce speed on these sections and
work with community to raise awareness of the many road users and services
dependent on these movement corridors through place.

Access and safety are fundamental values to be considered in the ongoing
management of hinterland roads. Ensuring equitable access and safety also aligns
with the aim of achieving a mode shift towards active and shared movement.

DD25
DRAFT Moving Byron 2022-2042
Hinterland Roads Actions
• Road funding needs to better support safety and access of all road users and
identified place features.
• Council needs to review and develop new policy and future capital works to
ensure equitable safe access for all road users and services.
• Moderation of speed on constrained hinterland roads be given paramount
consideration to ensure equitable, safe access for all road users.
• Council to advocate for change within external funding programs and
regulatory frameworks that better support an equitable, safe access for all
road users and services.
• Acknowledge ‘place’ features of hinterland network.
Road Access and Safety Principles (RASPs)
In response to increasing community concerns regarding access and safety, Council
has resolved to adopt a series of Road Access and Safety Principles and to
incorporate the principles within key infrastructure and maintenance policies to
ensure a more equitable approach to safe, accessible active movement on our road
networks. Provision of active infrastructure as part of new, renewed and upgraded
roads will be expanded in future works.
The recommendation to reduce speed on constrained hinterland roads as an
equitable measure to enhance access and safety of all road users on hinterland
roads where retro fitted active infrastructure is neither practical or feasible is an
example of a pragmatic application of RASPs that supports the goals of Moving
Byron, specifically mode shift, increased active movement and improved safety and
access for all road users.
DD26DRAFT Moving Byron 2022-2042
A7: Action Priorities
A number of measurable achievable actions have been identified in this report. To
help identify the most effective and priority projects Council has adopted a decision-
making process:
• Prioritise actions that can be included within existing or upcoming projects.
• Prioritise actions that can be achieved under an existing budget item.
• Prioritise actions that tick multiple goals and strategic directions.
The table below adopts a sample Action to demonstrate how Actions within the
Strategy will be assessed annually to identity priority projects for the year ahead.
Action 2: 6 month trial of a driverless EV shuttle bus in collaboration with
SCU
Connected Smart Byron M&P Sustainable
Byron Byron
Movement ✓
choices
Integrated ✓
network
Disadvantaged
Transport hubs
Trials ✓ ✓ ✓
Parking systems
Partnerships ✓ ✓
Technology ✓ ✓
Road Safety
Policy
Documents
Planning Studies
Byron Brand ✓
Climate ✓ ✓ ✓ ✓
Mitigation
Asset
management
Resilient
Future Proof ✓ ✓ ✓ ✓
DD27DRAFT Moving Byron 2022-2042 A8: Transport Options Active Transport According to ABS data, the active transport mode share for going to work is 9% in the Shire. The supply of cycling facilities in the Byron area is limited, while cycling is permitted on the M1 Motorway, this is dangerous with heavy vehicles and other private vehicles travelling at high speeds. On a local level, only sections of major centres have any form of cycle paths. Given the distance between the centres in Byron Shire, travelling by active transport is challenging, through there are some connections that are easily covered by a cycle, especially with more e-bikes becoming common. Safety and access however remain significant barriers to inter town or hinterland cycling. Council has adopted Bike and PAMP plans and is expanding active networks in line with the priorities set out in the plans. One significant example is the Byron Bay to Suffolk Park cycleway, while planning is underway for a cycleway between Mullumbimby and Brunswick Heads. Further expansion of active links in and around towns will prioritise safety, access and connectivity to shared and public transport options. In the Northern Rivers Regional Transport Plan, there has been provisions to support the introduction of new cycle facilities, which includes converting disused rail tracks into cycle trails for the region. In Byron Shire, Council has adopted a multi-use strategy for both active and shared movement. Cars For a range of reasons, people are very much reliant on cars for mobility in Byron Shire - almost nine in ten residents drive a car to work and three-quarters of tourists self-drive. Local residents are owning more private vehicles, with growing numbers of two or three-car households and fewer households with no vehicles. Some roads (particularly in and around townships) become congested at peak times on weekday mornings and afternoons, as well as during tourist periods including weekends, holidays and large events. Higher traffic volumes cause increases, or greater variability, in travel times. For example, a trip on Ewingsdale Road might take 10 minutes on one day, but 20 minutes on the next. Cars require large amounts of usually public areas to be used for parking and this adds to the demand for infrastructure as well as detracting from people focused town centres. In some locations, notably the M1 interchange at Ewingsdale, infrastructure is unable to meet current demands with little prospect that upgrades will do little other than induce greater car numbers and or shift the burden on to other parts of the network such as on Ewingsdale Road. The substantial financial, social and environmental costs of business-as-usual demand alternatives be considered that can slow the growth in car numbers and help generate a mode shift to active and shared movement. Cars are considered essential by most residents for many reasons that are unlikely to substantially change in the near term. However reduced car use may be more likely among certain cohorts where convenience or a set arrival time is less important DD28
DRAFT Moving Byron 2022-2042

such as tourist visitors where the experience is key. Others may be induced to shift
some or all trips to active or shared movement where convenient, regular and
connected services exist. In particular, shorter trips in and around town and village
centres can be avoided with safe connected infrastructure that encourages active
movement. A strategy to reduce car use needs to address the following:
   • Well-connected active links connected to public and shared transport options
      in and around town centres.
   • Prioritise active and public/share infrastructure for access to town centres.
   • Improve pedestrian access to ensure safety and connectivity.
   • Improved public transport between town centres and hinterland villages.
   • Parking management that includes park and ride, peripheral parking and
      staggered pricing mechanisms that reflect the true cost of parking in the town
      centre.
   • Improving safety and access for all road users on hinterland roads.

DD29
DRAFT Moving Byron 2022-2042 A9: Sustainability Byron Shire enjoys many beautiful natural features, including its beaches, waterways, bushland and forests. The community is very conscious of protecting and conserving this natural beauty. Ensuring the conservation of these features goes beyond physical maintenance, and strategies for behaviour change, innovation and sustainable initiatives should be encouraged to ensure the natural beauty of Byron Shire can be enjoyed by the community in years to come. Weather events impacting the transport network affect connectivity and can have significant social and economic costs for regional communities and businesses. Regional and remote areas face significant resilience challenges. Increased resilience in the transport system will improve access and reduce isolation for communities affected by severe weather events and avoid service disruptions and associated negative impacts on business costs and the regional economy. In 2018, Council declared a state of climate emergency. Road transport accounts for 30 per cent of the Byron Shire community’s greenhouse gas emissions. Switching to more sustainable ways of travel can go some way to protecting and preserving the precious environment. DD30
DRAFT Moving Byron 2022-2042

A10: Community needs, expectations and aspirations

In this section, we look at community needs, expectations and aspirations identified
through engagement and consultation to guide the importance of emerging issues
and assist in the identification of strategic directions and actions.

Community Strategic Plan
The Community Strategic Plan is developed with the Community and is Council’s
guiding document for the delivery of infrastructure and services. The first priority
listed is:

1.1     Provide a road network which is safe, accessible and maintained to an
        acceptable level of service

While this objective can ensure key safety, access and levels of service principles
are considered, there are a number of countervailing constraints that can limit the
potential to achieve the goal such as:
   • Funding guidelines for NSW and Federal agencies that do not align with or
       only partly align with the safety and access priorities determined by the
       community.
   • Limited financial resources of Council.
   • Inconsistent or conflicting Council Policy.

One approach to access is to ensure there are safe alternatives for those that do not
drive, as reflected in priority 1.3:

      1.3 Support, through partnership, a network of integrated sustainable transport
          options

It could be argued that an integrated sustainable transport network is a higher order
strategic priority as it can encompass the objective of a safe and accessible road
network as part of broader connected transport options. As such, it may be possible
to better overcome constraints such as limited financial resources by investing in
infrastructure that shifts movement demand off road or away from car movement. By
scaling back growth in demand, it may be possible to better manage the delivery
timeframes for road network upgrades that are financially more sustainable and help
to overcome the ‘infrastructure backlog’. A result of doing so would be to meet
community expectations for improved active and public transport as well as
supporting efforts to reduce carbon emissions. Perhaps of greatest importance is
that it can ensure that human movement options are maximised.

It is worth noting that a strategic approach to achieving this goal can incorporate
additional or expanded funding streams such as paid parking revenue. There is also
scope to better align forward planning with the priorities reflected in the Community
Survey.

DD31
DRAFT Moving Byron 2022-2042
Community Survey
Each year Council conducts a community survey as part of the Community Strategic
Plan process. There is clear evidence of a mismatch between expectations and
satisfaction of community priorities regarding transport. Most notably on local roads
and public transport.
In the context of limited resources, the maintenance of local roads often suffers due
to the demand for upgrades and maintenance of higher order roads to deal with the
pressures of growth and tourism. This can be exacerbated following natural disasters
such as floods. There appears to be an opportunity to improve levels of service for
local roads as a benefit of a more financially sustainable strategy to reduce growth in
demand for access by car in key movement corridors as described above.
Another feature is the importance of cycleways and walkways that is higher in Byron
Shire compared to other communities. A shift towards a sustainable and connected
movement network would align with this expectation.
Although ‘public transport’, perhaps better described as shared transport, has
traditionally been seen not to be a responsibility of local government, the fact that the
issue is consistently raised by the community reflects the high importance placed on
access to safe sustainable transport. This should not be surprising given the
potential that shared transport has to overcome restricted movement options that
limit access to essential services. Experience suggests that Council could achieve
more by taking a more active leadership role in developing a network of sustainable
transport options.
Community Solutions Panel
To help Council overcome some of the dilemmas associated with meeting
community expectations, understanding priorities, an infrastructure backlog and
limited funding, community representatives were asked through a deliberative
democracy process to provide guidance on the following key question.
“What infrastructure spending should we prioritise and how should we fund
these priorities if the rates alone are not enough?”
The panel were provided with extensive information and full access to senior staff to
seek clarification and information. While the panel considered the question for all
types of infrastructure, not just transport, their conclusions provide excellent
guidance on transport issues from a well-informed community.
‘The panel came up with a set of considerations, values, a decision-making
framework and infrastructure categories weighted by values to inform Council’s
priorities. The panel also outlined potential revenue options and how the community
should continue to be involved in Council activities and decisions.’ (Delivery Program
17-21/Operational Plan 20/21, page 9)
DD32You can also read