Nardus grasslands and wet heaths are affected differently
←
→
Page content transcription
If your browser does not render page correctly, please read the page content below
Tuexenia 41: 227–252. Göttingen 2021.
doi: 10.14471/2021.41.010, available online at www.tuexenia.de

 Nardus grasslands and wet heaths are affected differently
   by reintroduction of management and pH recovery
        Borstgrasrasen und Feuchtheiden reagieren unterschiedlich
    auf die Wiederaufnahme von Nutzung und sich erholende pH-Werte

        Leonie Mazalla1          *
                                     , Gerhard Ludwig2 & Cord Peppler-Lisbach3

              Vegetation Ecology and Conservation Biology, Institute of Ecology, FB 2,
              1

                   University of Bremen, Leobener Str. 5, 28359 Bremen,Germany;
               2
                 Bundesamt für Naturschutz, Konstantinstr. 110, 53179 Bonn, Germany;
       3
         Department of Biology, Earth and Environmental Sciences, Landscape Ecology Group,
                        University of Oldenburg, 26111 Oldenburg, Germany
                      *Corresponding author, e-mail: mazalla@uni-bremen.de

                                               Abstract
    Semi-natural habitats in temperate regions are local hotspots of biodiversity, but multiple stressors
such as land-use change and atmospheric deposition pose a threat to the existence and functioning of
these ecosystems. We conducted a resurvey of Nardus grasslands and wet heaths in the Eifel mountains
to monitor the development of these habitats under the influence of a long-term management regime
and the above-mentioned stressors. Surveys of 50 plots of Nardus grasslands and 14 of wet heaths from
1986 were repeated in 2018. Prior to the first survey, the meadows had lain fallow for approx. 30 years.
Shortly afterwards, they were re-entered into a management program with annual mowing from mid-
July. We found significantly increased soil pH values from an average of 3.9 up to 4.6 since the 1980s,
following the reduction in SO2-depositions. Ellenberg indicator values for soil reaction and nutrients
increased significantly in the wet heaths but stayed relatively stable in the Nardus grasslands. All
meadows that were Nardus grasslands in 1986 could still be identified as such, with high total species
numbers and a high proportion of character species. However, cover sums of these declined, while
more species typical of agricultural grasslands and small sedge fens occurred. Low-competitive species
(e.g. Carex pilulifera, Pedicularis sylvatica) profited, while species that can gain dominance in fallow
situations (esp. Molinia caerulea) were pushed back. The consistent management of the sites contribut-
ed essentially to this outcome by effectively counteracting eutrophication. The relatively early date of
mowing enabled a successful removal of nutrients and resulted in a characteristic structure and species
composition. However, some quantitative changes indicate a risk of eutrophication and that continuing
management will be crucial for a sustained conservation of Nardus grasslands. The same management,
however, was not equally able to preserve wet heaths, which have largely been transformed into wet
varieties of Nardus grasslands, small sedge-dominated swards or wet meadows with signs of eutrophi-
cation. Other management strategies (e.g. periodic top soil removal, possibly combined with extensive
grazing) should be considered. In any case, we recommend further monitoring to secure the survival of
these important remnants of historical land use.
Keywords: Eifel, eutrophication, long-term vegetation change, nitrogen deposition, resurvey, sulphur
deposition
Erweiterte deutsche Zusammenfassung am Ende des Artikels

Manuscript received 16 December 2020, accepted 22 June 2021
Published online 31 October 2021
Co-ordinating Editor: Thomas Becker                                                                 227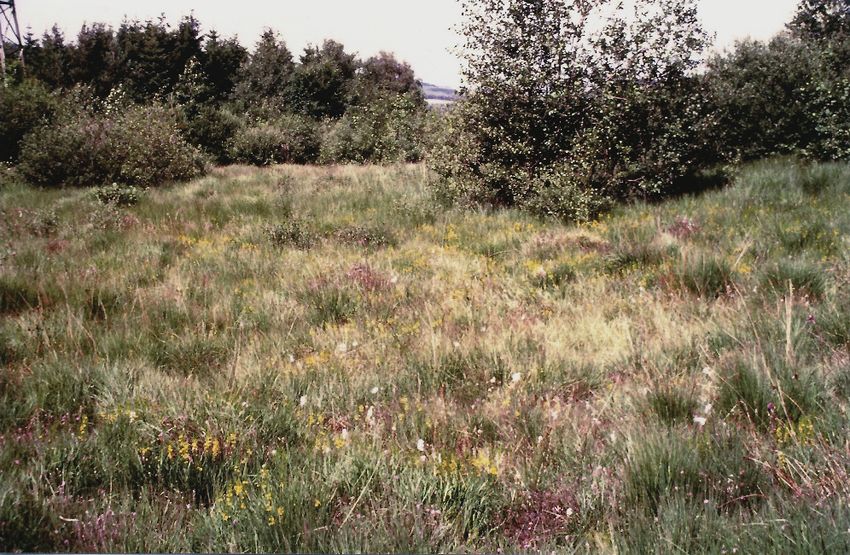
1. Introduction
    Semi-natural habitats are local hotspots of biodiversity in temperate regions whose land-
scapes are severely affected by species loss (HABEL et al. 2013, DENGLER et al. 2014). They
offer rare refuges for specialised species of nutrient-poor sites. Multiple stressors pose
a threat to the existence and functioning of these habitats. Changed land-use practices have
considerably reduced the extent of semi-natural and nutrient-poor ecosystems over the last
century (LEUSCHNER & ELLENBERG 2017). The usage of suitable areas has been intensified
by fertilising and drainage, while most less productive sites were abandoned or afforested
(POSCHLOD et al. 2005). Global warming and atmospheric depositions, recently especially of
nitrogen and in the past also of sulphur oxide, are additional drivers of vegetation change
(SALA et al. 2000).
    The habitats considered in this study are species-rich Nardus grasslands (Nardetalia
strictae Preising 1950) and wet heaths (Ericion tetralicis Schwickerath 1933 and Oxycocco-
Ericion Nordhagen 1936). They are protected under European law as FFH habitat types
(No. 6230, prioritary, “Species-rich Nardus grasslands” and No. 4010, “Northern Atlantic
wet heaths with Erica tetralix”). Their conservation status in Germany is stated as “unfa-
vourable – bad” with a worsening trend (BFN 2019). Out of 105 species listed by ELLEN-
BERG et al. (1992) as character species of Nardus grasslands and wet heaths, 64% are cur-
rently included as threatened in the Red List of Germany (METZING et al. 2018).
    To our knowledge there are few long-term studies on current vegetation changes of Nar-
dus grasslands, and even fewer for wet heaths. The available studies originate from different
regions in Europe, but with a strong focus on the UK, and cover different time spans
between the middle of the 20th century and the early 2000s. Some general trends were
described in the majority of long-term resurvey studies: The diversity of the habitats was
commonly described as degrading, with a decrease in the number of characteristic species
and an increase in Ellenberg indicator values for nutrients (DUPRÈ et al. 2010, MCGOVERN et
al. 2011, BRITTON et al. 2017, PEPPLER-LISBACH et al. 2020). In some cases, graminoid spe-
cies have increased at the expense of forbs (DUPRÉ et al. 2010, MCGOVERN et al. 2011); in
other cases, generalist and more competitive species have increased (BRITTON et al. 2017,
PEPPLER-LISBACH et al. 2020). The main drivers of community changes were reported to be
nitrogen and sulphur depositions, as well as the reduction of management intensity.
    Deposited nitrogen levels currently exceed the threshold for critical loads from atmos-
pheric deposition (10-20 kg N ha-1 a-1 for Nardus grasslands and wet heaths), in most parts of
Europe (BOBBINK & HETTELINGH 2011). Typical effects of reactive nitrogen deposition are
known to be a general loss of biodiversity, an increased graminoid: forb ratio (STEVENS et al.
2006, FIELD et al. 2014), a decrease in evenness, and an increase in more nutrient-demanding
species of agricultural grasslands (DE GRAAF et al. 2009, BOBBINK et al. 2010, STEVENS et al.
2010, 2011, SOUTHON et al. 2013). As nitrogen-induced eutrophication facilitates higher
productivity, species that are able to react to increased nutrient availability with high growth
rates outcompete those adapted to nutrient-poor environments (BOBBINK et al. 1998, ROEM
& BERENDSE 2000, DE GRAAF et al. 2009). Another effect of nitrogen deposition is acidifica-
tion, especially due to ammonium (NH4+). As a consequence, rare species, which are often
typical of intermediate pH values, decline, in favour of acid-resistant species that are more
often grasses (BOBBINK et al. 1998, KLEIJN et al. 2008, MASKELL et al. 2010).
    In contrast to nitrogen deposition, which persists on a high level, sulphur oxide emissions
have been significantly reduced in the last decades due to effective air pollution policies
(UBA 2019). As a consequence, pH levels have recently been found to be recovering (KIRK

228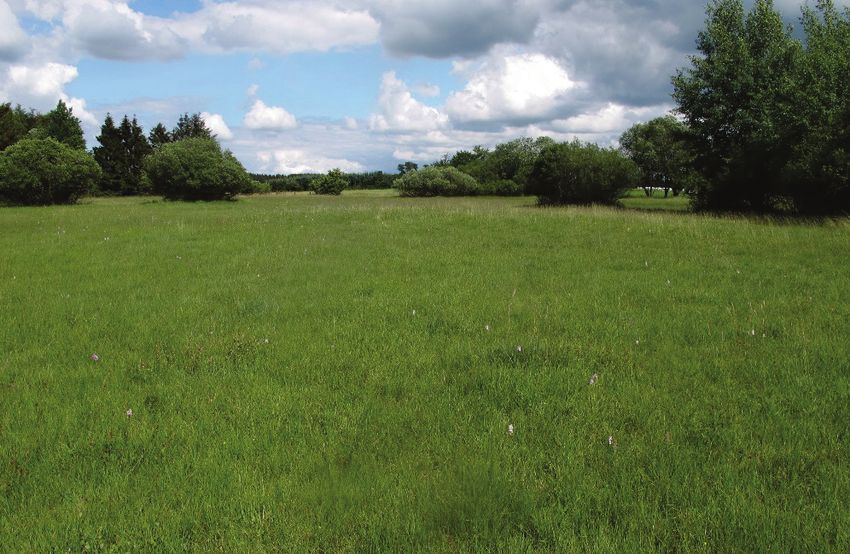
et al. 2010, MCGOVERN et al. 2011, MITCHELL et al. 2018, PEPPLER-LISBACH et al. 2020).
MCGOVERN et al. (2011) found that the vegetation response to recovery from acidification is
lagging behind by decades, as soil parameters such as exchangeable cations still reflect an
earlier, more acid, state. The more recent studies by BRITTON et al. (2017) and PEPPLER-
LISBACH et al. (2020), however, found a significant increase of acid-sensitive species.
    Here, we present the results of a resurvey of both the vegetation and the soil chemistry of
plots first surveyed in 1986 in Nardus grasslands and wet heaths in the Eifel mountains in
West-Germany. All of the study sites were mown for the last 30 years, with one cut from
mid-July. The local conditions of the sites are very well controlled, with a strict conservation
status, no drainage or fertilising, and a management regime in place that aims to maintain the
typical vegetation structure and diversity. However, global and regional influences cannot be
controlled. This study offers an opportunity to explore the long-term effects of well-planned
and -conducted conservation practices in valuable habitats under the stress of global and
regional drivers.
    We expect a shift in species composition indicating eutrophication and less acidic condi-
tions due to (1) recovery of pH values as a result of sulphur emissions that were high in
the past but have been reduced for decades, and (2) eutrophication caused by ongoing high
N-depositions. We further expect that (3) the implemented management regime of regular
mowing has generally preserved the typical structure and species composition of vegetation.

                                  2. Materials and Methods

                                             2.1 Study area
     The study area is located in the west of Germany in the Eifel Mountains, approx. 50 km south-west
of the city of Bonn. It presents the northernmost part of the Rhenish Slate Mountains with predominant-
ly siliceous bedrock (sandstone, clay shales, greywacke). These substrates weather to nutrient-poor soils
with low pH values containing a water-retaining soil horizon due to their high clay content (MEYNEN &
SCHMITTHÜSEN 1953). The altitude of the study plots varies from 500 to 605 m a.s.l. The climate is of
a sub-oceanic character, with a mean annual precipitation of 800–900 mm and a mean annual air tem-
perature of 7.7 °C (DWD CDC 2018). Individual relevés were from nine different meadow sites dis-
persed over an extent of approx. 18 km × 5 km and isolated from each other in the landscape. The size
of the single sites ranges from 0.4 to 4.8 ha. All study sites are protected under federal law as nature
reserves, and most of them additionally under European law as Natura 2000 sites (KREIS EUSKIRCHEN
2003, 2005). Except for one site, there is no intensive agricultural use taking place in the direct vicinity
i.e. there is no or no strong input of fertiliser from agricultural sites and a low chance of species of
intensively used grasslands to invade the swards. In most cases, the sites were surrounded by coniferous
forest. At the time of the initial survey in 1986, the meadows had been abandoned for approx. 30 years
(LUDWIG 1987). Soon afterwards, all sites were entered into a management program with contractual
nature conservation, and have since been mown once a year from mid-July (SCHUMACHER et al. 2007,
BIOSTATION 2019b). Additionally, two EU-funded projects for the maintenance of heaths and Nardus
grasslands were conducted in the area (BIOSTATION 2018, 2019a). They comprised measures such as
clearing shrubs and blocking off ditches to restore a more natural water regime. The reactive nitrogen
deposition level, currently 11–12 kg N ha-1 a-1 (UBA 2020), lies in the range of critical loads that have
been described for acid grassland and wet heath.

                                                                                                       229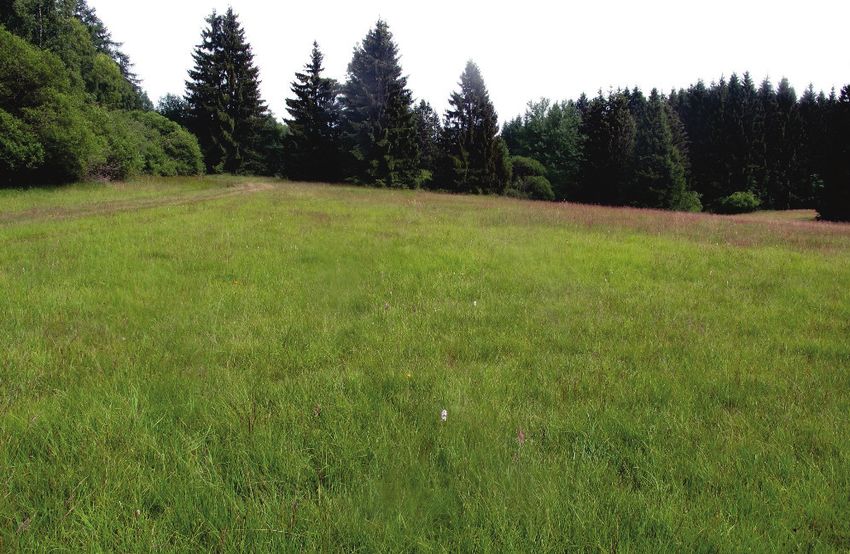
2.2 Data sampling
     The resurvey is based on relevés made in 1986 by Gerhard Ludwig (LUDWIG 1987). This data basis
was very well suited for a revisitation study. The methods of the original study were well documented
and the author could be won as co-author for the resurvey study. In 2018, 50 relevés of Nardus grass-
lands (Violion caninae Schwickerath 1944: Violenion caninae Peppler-Lisbach & Petersen 2001, Jun-
cenion squarrosi Peppler-Lisbach & Petersen 2001 and Galium-saxatile-Nardus-stricta community,
Peppler-Lisbach & Petersen 2001) and 14 plots of groundwater-influenced wet heaths (Ericion te-
tralicis Schwickerath 1933 and Oxycocco-Ericion Nordhagen ex Tx.1937) were resampled. Precisely
drawn maps with a thorough documentation of plot locations were used (scale 1:5000, pseudo-
permanent following KAPFER et al. 2017). These were geo-referenced with ArcGIS (ESRI 2012). The
resulting coordinates were located in the field using a differential GPS with an accuracy of up to 2 cm.
While resampling, we avoided small-scale heterogeneity created by vehicle lanes or small depressions,
to obtain homogeneous plots (as this has been done in the initial study in the same way). In the case of
five plots overgrown by shrubs, the original location was shifted by a few meters. The plots sampled in
2018 were permanently marked by magnets in two diagonal corners. The plot size was 20 m². Species
cover values were estimated using a modified Braun-Blanquet scale in which the lower classes "r", "+",
and "1" were classified based only on percent cover and not on number of individuals (LUDWIG 1987).
     Mixed soil samples from 1–10 cm depth were taken from every plot and soil pH was measured in
deionised water. Additional data on ortho-phosphate were available for 22 plots. In 1986, these had
been measured directly in soil water extracted by suction cups. Direct extraction of soil water was not
possible in 2018 due to dry weather conditions; we therefore created an equilibrium soil solution from
soil samples as a substitute (RICHARDS 1954, BLUME et al. 2011). Ortho-phosphate was measured with
a photometer, with a measuring range of 15–1000 μg P l-1 after filtering the soil solution with a mesh
width of 0.45 μm.

                                          2.3 Data analysis
     All data was organised with Turboveg (HENNEKENS & SCHAMINÉE 2001), the analyses were
conducted with R and Rstudio (RSTUDIO TEAM 2016, R CORE TEAM 2020), including the packages
vegdata (JANSEN & DENGLER 2010), vegan (OKSANEN et al. 2019), hier.part (NALLY & WALSH 2004),
exactRankTests (HOTHORN & HORNIK 2019), car (FOX & WEISBERG 2019), nortest (GROSS & LIGGES
2015), ggplot2 (WICKHAM 2016) and reshape2 (WICKHAM 2007). All species names were harmonised
according to the GermanSL1.3 (JANSEN & DENGLER 2008, 2010). A few taxa that were identified to
different levels in the two surveys were merged to aggregates: Festuca rubra agg., Centaurea jacea
agg. and Dactylorhiza maculata agg.
     To account for initial floristic differences between plots in 1986, which might have influenced sub-
sequent changes, we classified the plots into Nardus grassland (syntaxon N) and wet heath (syntaxon
WH).
     For all relevés, mean presence-absence based and community weighted (after square root transfor-
mation of cover) Ellenberg indicator values for temperature (mT), soil moisture (mF), soil reaction
(mR), and soil nitrogen (mN) were calculated (ELLENBERG et al. 1992).
     We classified species into seven groups according to their habitat preference (Supplement E1), fol-
lowing ELLENBERG et al. (1992) and for moss species DIERSSEN (1982) unless indicated otherwise:
1. NardG, character species of Nardus grasslands (class Calluno-Ulicetea Br.-Bl. et Tüxen 1943 ex
Klika et Hadač 1944, according to PEPPLER-LISBACH & PETERSEN 2001); 2. WetH, character species
of wet heaths (Oxycocco-Sphagnetea Br.-Bl. & Tx. ex Westhoff et al. 1946); 3. SSF, character species
of small sedge fens (Scheuchzerio-Caricetea nigrae Tx. 1937); 4. AgriG, species of agricultural grass-
lands (Molinio-Arrhenatheretea Tx. 1937, with N.EIV values > 3); 5. PoorG, other species of nutrient-
poor grasslands with N.EIV values
Variable changes were calculated as ∆variable = var2018 – var1986. Tests on the significance of
parameter changes (e.g., ∆pH, ∆cover sums of character species) were conducted using a Wilcoxon
signed rank test. Changes of individual species (abundance and cover) were also tested for significance,
with p-values corrected for the number of species considered (controlling the false discovery rate, fdr)
(BENJAMINI & HOCHBERG 1995). Only species that occurred at least 10 times in the dataset were in-
cluded.
    Species “gain” and “loss”, as indices for species turnover, were calculated with:
    gain = newspec / specnum2018 and      loss = lostspec / specnum1986,

where newspec is the number of species in a 2018 relevé that were not present in the corresponding plot
in 1986 and lostspec is the number of species in a 1986 relevé that were no longer found in the corre-
sponding plot in 2018. Specnum is the total number of species in the respective years. Evenness was
calculated as a measure for the dominance structure of species in the relevés (PIELOU 1966). Sørensen
dissimilarities based on presence/absence data, as well as cover values, were also computed (BORCARD
et al. 2018). A fallow index for each plot was calculated as a sum of square-root transformed cover
values of all fallow indicator species (species group Aban) and Molinia caerulea as a species gaining
dominance in abandoned meadows.
     A DCA of all relevés from 1986 and 2018 was performed with the function “decorana” (package
vegan) from presence/absence data, without down-weighting of rare species. We calculated the best
multiple linear regression models for changes in species richness (total, vascular, and bryophytes),
Sørensen dissimilarity (quantitative and qualitative), ∆mR and ∆mN, as well as changes in frequency
and cover sums of the species groups NardG, SSF, AgriG and PoorG as dependent variables. Explain-
ing variables included in the full model were: pH1986, ∆pH, fallow-index1986, and site. Models for ∆mR
and ∆mN also included mF1986 and ∆mF as a surrogate for soil moisture. F- and R- or N-values of the
present species were not correlated, i.e. species of wetter sites did not have higher or lower R- or
N-values. Interaction terms with syntaxon (wet heath/Nardus grassland) were included for all variables
except site. Nitrogen or sulphur-oxide deposition were not included as predictor variables, because they
are largely uniform across the study region and therefore cannot explain local differences. The same
applies to the management regime. Variables were selected by stepwise elimination with the “step”-
function based on Bayes Information Criterion (BIC). Dependent variables of models whose residuals
did not follow a normal distribution were rank-transformed (∆SSF.pa, ∆specnum.bryo). Models for
∆mR and ∆mN showed an outlier outside the “Cook’s distance” metric of 0.5, which has an extreme
∆pH of 2.4 that might be a measurement error, and in one case the influence of one single species with
very high N-value (Epilobium angustifolium, n = 8). This outlier data point was removed for the final
model.
     To examine variable effects on overall vegetation change, we conducted a Permanova based on Eu-
clidean distances of a matrix of species differences between the years. For this, we used the rda function
of the package vegan, including permutation testing, as it offers automatic variable selection. To obtain
the species-differences matrix, square-root transformed cover values of species per plot in 1986 were
subtracted from the respective values in 2018. The same procedure was used for presence/absence data.

                                             3. Results

                          3.1 Soil variables and mean indicator values
    Across all sites, between 1986 and 2018, the mean pH value showed a significant in-
crease from 3.87 to 4.62 (Fig. 1). The range in which aluminium toxicity plays a role
(pH < 4.5, SCHEFFER & SCHACHTSCHABEL 2010) was reached for 98% of the plots in 1986,
while this was only the case for 22% in 2018. The change in pH values was negatively de-
pendent on initial pH values (estimate: -0.72, R2: 0.33, p < 0.001), i.e. the more acid the soils
were in 1986, the more the pH values increased until 2018. Additionally, increasing soil

                                                                                                     231
Fig. 1. Changes (Δ) of pH and presence/absence-based Ellenberg indicator values for temperature
(mT), soil moisture (mF), soil reaction (mR) and soil nutrients (mN). Significance symbols
(*** p < 0.001; ** p < 0.01; * p < 0.05; n.s. p > 0.05) indicate differences in indicator values between
1986 and 2018. Out-written p values give the significance of differences between Nardus grasslands
and wet heaths. Tests: Wilcoxon signed rank test.
Abb. 1. Veränderung (Δ) von pH-Wert und ungewichteten Ellenberg-Zeigerwerten für Temperatur
(mT), Bodenfeuchte (mF), Bodenreaktion (mR) und Nährstoffe (mN). Sternchen (*** p < 0,001;
** p < 0,01; * p < 0,05; n.s. p > 0,05) geben das Signifikanz-Niveau von Unterschieden der Zeigerwerte
zwischen 1986 und 2018 an. Ausgeschriebene p-Werte geben die Signifikanz von Unterschieden in der
Veränderung zwischen Borstgrasrasen und Feuchtheiden an. Tests: Wilcoxon-Vorzeichen-Rang-Tests.

moisture, estimated as difference in mean mF, had a positive effect on the change in pH
values (estimate: 0.23, R2: 0.13, p = 0.002). Wet heaths had lower pH values than Nardus
grasslands in both survey years but the increase in pH did not differ between the syntaxa.
mN and mR values showed significant differences between both community types in 1986,
but not in 2018 (Supplement E2). Mean ortho-phosphate levels in soil water decreased sig-
nificantly over time. Over all sites, they were on average 154 µg P l-1 in 1986. In 2018,
10 out of the 22 samples were under the detection limit of 15 µg P l-1, the remaining 12 sam-
ples having an average of 27 µg P l-1.
    Mean unweighted indicator values for soil reaction and nutrients showed significant
increases in the wet heath plots, while those of Nardus grassland remained comparatively
stable over the study period (Fig. 1). The increases in mR and mN in Nardus grasslands were
only significant for cover-weighted indicators (Supplement E3). Although the increase in pH
values did not differ significantly between the syntaxa, the increase in mR and mN was
significantly higher in the wet heath plots (Fig. 1). Mean unweighted indicator values for
temperature and moisture showed significant increases across all plots, from a mean
mF1986 = 5.8 to a mean mF2018 = 6.1, and a mean mT1986 = 4.2 to a mean mT2018 = 4.5.

                           3.2 Biodiversity and vegetation structure
    All Nardus grasslands from 1986 were still typical Nardus grasslands in 2018, with high
total species numbers (mean 34.3 / 20 m2), and a high proportion of character species (on
average 40% of total species, with 31% share of total cover). Total species numbers did not
change significantly (Fig. 2). Broken down into vascular plants and bryophytes, vascular

232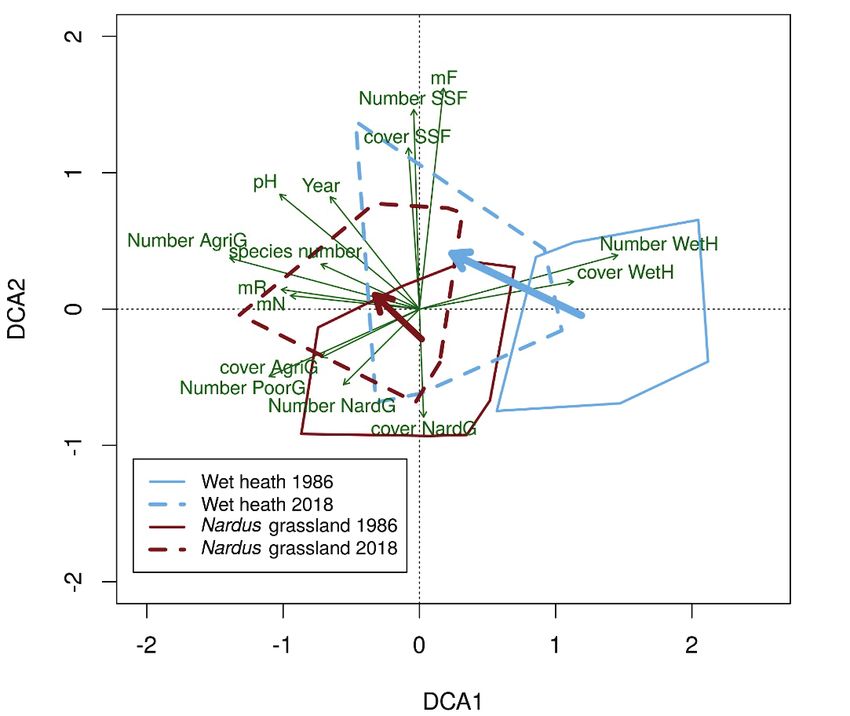
Fig. 2. Changes (∆) in parameters describing biodiversity and structure between 1986 and 2018. Signif-
icance symbols (*** p < 0.001; ** p < 0.01; * p < 0.05; n.s. p > 0.05) indicate differences in variables
between 1986 and 2018. Out-written p values give the significance of differences between Nardus
grasslands and wet heaths. Tests: Wilcoxon signed rank test.
Abb. 2. Veränderungen (∆) in Parametern betreffend Biodiversität und Struktur zwischen 1986 und
2018. Sternchen (*** p < 0,001; ** p < 0,01; * p < 0,05; n.s. p > 0,05) geben das Signifikanz-Niveau
von Unterschieden der Variablen zwischen 1986 und 2018 an. Ausgeschriebene p-Werte geben die
Signifikanz von Unterschieden zwischen Borstgrasrasen und Feuchtheiden an. Tests: Wilcoxon-
Vorzeichen-Rang-Tests.

plant richness increased by on average 4.1 species per plot, while bryophytes declined by on
average 3.3 species per plot. However, there was a gradual shift to more nutrient-demanding,
mesophilous species. Floristic changes were much greater in the plots that originally con-
tained wet heaths. In 1986, 15% of all species were character species of wet heaths, with
a share of cover of 34% per plot. In 2018, these shares amounted to only 3% typical species,
with a mean share of cover of 4%. Here, total species numbers rose from mean1986 = 24.6 to
mean2018 = 36.6 species per plot, with vascular plant numbers increasing on average by 12.8
species and bryophytes decreasing by 0.7 species per plot. Species turnover was significantly
higher in the wet heaths, with a mean gain of 0.62 and a mean loss of 0.45, meaning that
62% of the species in the relevés of 2018 were not present in 1986, and 45% of species in
the relevés of 1986 were lost in 2018. For the Nardus grasslands, these numbers amounted to
a gain of 0.38 and a loss of 0.37.
    Between 1986 and 2018, evenness increased slightly in Nardus grasslands but not in wet
heaths, while the fallow index decreased slightly (Fig. 2). The graminoids:forbs ratio showed
no significant change across all plots. The number and cover of dwarf shrubs in wet heaths
was significantly reduced from on average 2.8 species with a cover sum of 21% in 1986, to
1.6 species with a cover sum of 13% in 2018.

                      3.3 Species groups according to habitat preference
    The number of Nardetalia character species (NardG) was unchanged in Nardus grass-
lands (Fig. 3), though their cover sums decreased significantly (Supplement E4). More spe-
cies of agricultural grasslands (AgriG), nutrient-poor grasslands (PoorG) and small sedge
fens (SSF) appeared in the relevés in 2018 compared to 1986, but cover sums only increased
significantly for the SSF-group. The species composition of wet heaths in the study area

                                                                                                   233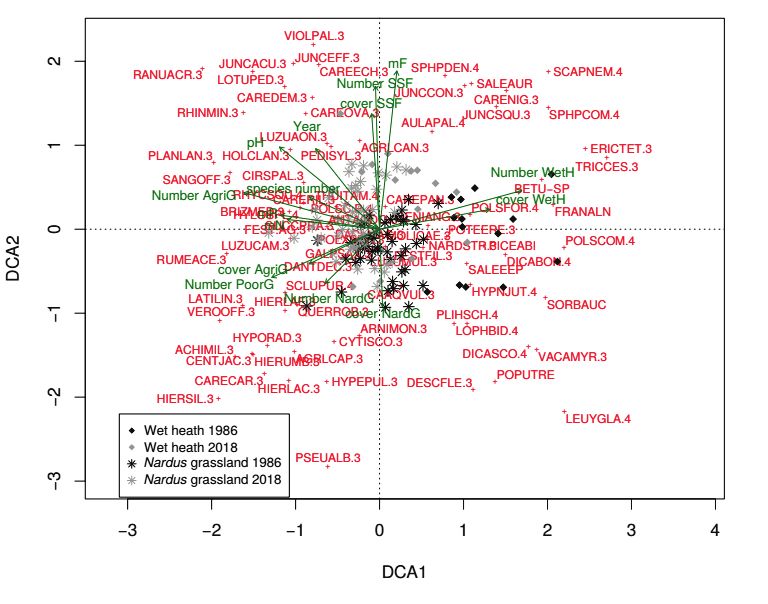
Fig. 3. Changes (∆) in species numbers of several species groups: NardG = character species of Nardus
grasslands; WetH = character species of wet heaths; SSF = character species of small sedge fens;
AgriG = species of agricultural grasslands; PoorG = other species of nutrient-poor grasslands;
Aban = fallow indicators. Significance symbols (*** p < 0.001; ** p < 0.01; * p 0.05)
indicate differences in species numbers between 1986 and 2018. Out-written p values give the signifi-
cance of differences between Nardus grasslands and wet heaths. Tests: Wilcoxon signed rank test.
Abb. 3. Veränderung in der Frequenz von Arten der jeweiligen Artengruppen: NardG = Charakterarten
der Borstgrasrasen; WetH = Charakterarten der Feuchtheiden; SSF = Charakterarten der Kleinseggen-
riede; AgriG = Arten des Wirtschaftsgrünlands; PoorG = andere Arten mageren Grünlands;
Aban = Brachezeiger. Sternchen (*** p < 0,001; ** p < 0,01; * p < 0,05; n.s. p > 0,05) geben das Signi-
fikanz-Niveau von Unterschieden der Artenzahlen zwischen 1986 und 2018 an. Ausgeschriebene
p-Werte geben die Signifikanz von Unterschieden zwischen Borstgrasrasen und Feuchtheiden an. Tests:
Wilcoxon-Vorzeichen-Rang-Tests.

changed more drastically. The number and cover sums of wet heath character species
(WetH) decreased in every relevé. The groups SSF, AgriG, PoorG and Aban increased sig-
nificantly in numbers, and the groups SSF as well as AgriG also in cover.

                                      3.4 Individual species
    Comparisons of the prevalence of individual species showed that in Nardus grasslands,
10 species had significantly increased in either frequency or cover, or both (Supplement E5).
Two small sedge species (Carex pilulifera and C. echinata) and the two hemiparasites
Pedicularis sylvatica and Rhinanthus minor showed the strongest increases. Rhytidiadelphus
squarrosus increased most in cover. Not reflected in the list of significantly increasing spe-
cies are a number of agricultural grassland species (n = 11) that have only recently appeared
in the sites, but are still very rare (e.g. Cerastium holosteoides, Trifolium pratense, Vicia
cracca). Eleven species significantly decreased, more than half of which were mosses. Of
the decreasing species, 55% belong to the Nardetalia character species group (NardG). The
frequency of Arnica montana decreased from 74% to 52% of all plots, while its mean cover
values declined by 80%. Nardus stricta showed the strongest decline in cover, but no change
in frequency. The cover of Molinia caerulea decreased by on average 35%, however, this
was not significant.
    In the 14 wet heath sites, only two species (Rhytidiadelphus squarrosus and Agrostis ca-
nina) showed significant increases, while Erica tetralix decreased significantly in cover
(Supplement E6).

234
Mean indicator values for temperature, soil moisture, soil reaction, and nutrients did not
differ significantly between increasing and decreasing species of both initial syntaxa. The
number of vascular plant species included in the Red List of Germany (METZING et al. 2018)
increased from 29 to 32 over all plots, with more than half of the endangered species in 2018
being characteristic species of Nardus grasslands and wet heaths.
3.5 Multivariate analysis
The DCA containing all monitored plots from 1986 and 2018 supports the result that in
the study period, wet heaths have changed more drastically than Nardus grasslands (Fig. 4).
While the contours outlining all Nardus grassland plots in 1986 and 2018 show a considera-
ble overlap, the contours surrounding the wet heath plots in 1986 and 2018 only overlap
slightly. The first axis of the DCA represents a nutrient/pH-gradient, with typical species of
agricultural grasslands increasingly occurring in the negative part of the axis, together with
higher mR- and mN-values, pH, and total species numbers. The second axis describes a soil
moisture gradient, being closely positively correlated with mF indicator values and character
species of small sedge fens, and negatively correlated with typical species of Nardus grass-
lands. Both contours have shifted towards more moist and nutrient-rich conditions. In addi-
tion, floristically, plots of wet heath and Nardus grassland have become more similar: In
1986, contours outlining the separate syntaxa did not overlap, while they share about a third
of their area in 2018.
3.6 Influence of site conditions on vegetation change
The results of the linear regression models showed which environmental variables had
a significant effect on the changes in vegetation composition. Site and syntaxon were also
included in the models, to account for local conditions and for initial differences between
Nardus grasslands and wet heaths (see Supplement E7–9 for detailed model coefficients).
For most dependent variables, the largest part of explained variance was accounted for by
the differences between syntaxa or between sites. Increases of pH positively influenced
cover-weighted changes in mN (Table 1), and were related to a higher presence/absence-
based Sørensen-dissimilarity, increasing numbers of total vascular species, agricultural
grasslands species, and small sedge sward species, but not their respective cover sums (Ta-
ble 2). The rise in pH had a negative effect on the cover sums of Nardetalia character spe-
cies which were, additionally, positively influenced by the fallow-index in 1986. A higher
fallow index in 1986 also led to a higher qualitative Sørensen-dissimilarity, while numbers
of bryophytes were reduced more strongly.
Variable selection in RDA revealed changes in pH, mF, and site as important variables
influencing presence/absence-based vegetation change, with a total of 29% explained vari-
ance (Supplement E10). Individually, changes in pH explained only 3% of the total variance
in the dataset of species differences, while 22% could be attributed to differences between
the nine sampling sites. For differences in species cover values, changes in pH had no signif-
icant effect in the RDA. Changes in mF, the fallow-index1986, syntaxon, and site together
explained 42% of total variance, with the majority (22%) again accounted for by differences
between sites. The syntaxon explained 5% of the total variance. No interaction terms
between syntaxon and other variables were significant.
235Fig. 4. DCA of all plots in 1986 and 2018, based on species presence/absence data. Red contours out- line Nardus grasslands and blue contours wet heaths, with continuous outlines being the 1986 plots and dotted outlines the 2018 plots. Environmental variables included are significantly correlated to one of the DCA axes (p < 0.05) and with R² ≥ 0.15. mF, mR, mN: Presence/absence-based Ellenberg indicator values for soil moisture, soil reaction, and nutrients; Species numbers (Number) and cover sums (cover) of following species groups: NardG = Nardetalia character species, WetH = wet heath character spe- cies, SSF = species of small sedge fens, AgriG = agricultural grassland species, and PoorG = species of other poor grasslands; Axis length is 3.45 for axis 1 and 2.31 for axis 2. A representation with species and single plots can be found in the Supplement E11. Abb. 4. DCA aller Aufnahmen in 1986 und 2018, basierend auf Präsenz/Absenz-Daten. Rote Um- risse umfassen alle Aufnahmen von Borstgrasasen und blaue Umrisse umfassen alle Aufnahmen von Feuchtheiden. Dabei stellen durchgängige Linien die Aufnahmen von 1986 dar und gestrichelte Li- nien die Aufnahmen von 2018. Dargestellte Umweltvariablen sind signifikant mit einer der beiden DCA-Achsen korreliert (p < 0,05), mit R² ≥ 0,15. mF, mR, mN: Präsenz/Absenz-basierte Ellenberg- Zahlen für Bodenfeuchte, Bodenreaktion und Nährstoffe; Artenzahl (Number) und Deckungssummen (cover) der Artengruppen: NardG = Charakterarten der Borstgrasrasen, WetH = Charakterarten der Feuchtheiden, SSF = Charakterarten der Kleinseggenriede, AgriG = Arten des Wirtschaftsgrünlands, PoorG = Arten anderer nährstoffarmer Wiesen. Achsenlänge ist 3,45 für Achse 1 und 2,31 für Achse 2. Eine Darstellung mit Arten und einzelnen Plots findet sich im Anhang E11. 236
Table 1. Coefficients (arrow pointing up: positive, arrow pointing down: negative) of multiple linear
models for differences in presence/absence-based (p/a) and cover weighted Ellenberg indicator values
for soil acidity (mR) and nutrients (mN) between 1986 and 2018. pH 1986, Fallow index 1986, mF
1986: pH, fallow index, and mF as measured in 1986. ∆pH, ∆mF: Changes of pH and mF between 1986
and 2018. Wet heath: syntaxon as compared to reference category Nardus grasslands. Site: all 8 sites as
compared to reference category site 1.
Tabelle 1. Koeffizienten (Pfeil nach oben: positiv, Pfeil nach unten: negativ) der multiplen linearen
Modelle für Differenzen von Präsenz/Absenz-basierten (p/a) und Deckungsgrad-gewichteten (cover)
Ellenberg-Zeigerwerten für Bodenreaktion (mR) und Nährstoffe (mN) zwischen 1986 und 2018. pH
1986, Fallow index 1986, mF 1986: pH, Bracheindex und mF von 1986. ∆pH, ∆mF: Differenz der pH-
Werte und mF zwischen 1986 und 2018. Wet heath: Syntaxon Feuchtheide im Verhältnis zur Be-
zugskategorie Borstgrasrasen. Site: Alle 8 Gebiete im Verhältnis zur Bezugskategorie Gebiet 1.

               R²      pH     ∆pH    Fallow    mF    ∆mF WH: mF WH:         WH: pH Wet          Site
                      1986            index   1986        1986  ∆mF          1986  heath
                                      1986
∆mR p/a     0.38***                                                                    ↑***
∆mR cover   0.24***     ↑                      ↑*                              ↑**      ↓**
∆mN p/a     0.44***                            ↓       ↓      ↑*      ↓*                 ↓     ↓↑***
∆mN cover   0.08***            ↑*

                                         4. Discussion
    Our results indicate an overall trend of pH recovery, but different levels of vegetation
response between Nardus grasslands and wet heaths.

                                    4.1 Soil reaction recovery
     The results confirm the expected rise in pH values, as previously reported by KIRK et al.
(2010), MCGOVERN et al. (2011), MITCHELL et al. (2018) (all UK) and PEPPLER-LISBACH et
al. (2020) from central Germany. It is commonly thought that this is the effect of strongly
reduced SO2 emissions since the 1990s. TIPPING et al. (2021) assume that pH recovery large-
ly contributed to recent increases in plant species richness in the UK. This process apparent-
ly completely overrides the simultaneous further acidification through ammonium deposi-
tion.
     Fifty years after the peak of SO2 emissions (MCGOVERN et al. 2011, MITCHELL et al.
2018), this is an exciting opportunity to observe the rates of recovery from acidification,
which are not yet well known (KIRK et al. 2010). In acid soils as surveyed in this study,
silicate mineral weathering is the main acid-buffering process. It is considered to be a slowly
operating buffering system (KIRK et al. 2010, SCHEFFER & SCHACHTSCHABEL 2010). A pH
increase of 0.75 on average, equivalent to an 82 % reduction in H+-concentrations over
32 years, is therefore unexpectedly strong. However, weathering rates increase logarithmi-
cally with declining pH values (SCHEFFER & SCHACHTSCHABEL 2010). This may offer an
explanation as to why soils with initially lower pH values show larger increases in pH. Our
findings confirm the results of a Nardus grassland resurvey study in continental Germany,
which also found stronger pH increases in initially more acid soils (PEPPLER-LISBACH et al.
2020).

                                                                                                  237
Table 2. Coefficients (arrow pointing up: positive, arrow pointing down: negative) of multiple linear
models for differences in species numbers of all species (total), vascular species, and bryophytes, quali-
tative Sørensen dissimilarity, and differences of species group, species numbers (p/a), and cover sums
(cover) between 1986 and 2018. NardG = Nardetalia character species, AgriG = agricultural grassland
species, SSF = species of small sedge fens, PoorG = other species of nutrient-poor grasslands. pH 1986,
Fallow index 1986: pH and fallow index as measured in 1986. ∆pH = Change of pH between 1986 and
2018. Wet heath = syntaxon as compared to reference category Nardus grasslands. Site = all 8 sites as
compared to reference category site 1. Models without significant results are not listed in the table:
Sørensen quantitative, ∆NardG p/a, ∆AgriG cover, ∆SSF cover, ∆PoorG cover.
Tabelle 2. Koeffizienten (Pfeil nach oben: positiv, Pfeil nach unten: negativ) der multiplen linearen
Modelle für Differenzen von Artenzahlen (species numbers) aller Arten (total), der Gefäßpflanzen
(vascular) und der Moosarten (bryophytes), der qualitativen Sørensen-Unähnlichkeit, sowie der Diffe-
renzen von Artenzahlen (p/a) und Deckungssummen (cover) der soziologischen Kennartengruppen.
NardG = Charakterarten der Borstgrasrasen, AgriG =Arten des Wirtschaftsgrünlands, SSF = Charakter-
arten der Kleinseggenriede; PoorG = andere Arten mageren Grünlands. pH 1986, Fallow index
1986 = pH und Bracheindex von 1986. ∆pH = Differenz der pH-Werte zwischen 1986 und 2018. Wet
heath = Syntaxon Feuchtheide im Verhältnis zur Bezugskategorie Borstgrasrasen. Site = Alle 8 Gebiete
im Verhältnis zur Bezugskategorie Gebiet 1. Modelle ohne signifikante Ergebnisse sind nicht in der
Tabelle aufgeführt: Sørensen quantitative, ∆NardG p/a, ∆AgriG cover, ∆SSF cover, ∆PoorG cover.
R² pH 1986 ∆pH Fallow index WH: Wet heath Site
1986 pH 1986
Species Numbers
∆species numbers total 0.28*** ↑***
∆species numbers vascular 0.27*** ↑* ↑***
∆species numbers bryophytes 0.19*** ↓* ↑***
Sørensen qualitative 0.41*** ↑* ↑* ↑** ↑***
Species groups
∆NardG cover 0.47*** ↓* ↑** ↓* ↑↓***
∆AgriG p/a 0.13** ↑* ↑*
∆SSF p/a 0.15** ↑* ↑*
∆PoorG p/a 0.19** ↓* ↑* ↓*
4.2 Changes in soil moisture and temperature
The observed increase in soil moisture as reflected in the mF values can be explained by
clogged ditches in the context of nature conservation projects in the area (BIOSTATION
2018). Precipitation changes, in contrast, cannot be taken as an explanation for increased soil
moisture, as yearly precipitation has slightly decreased since the initial survey (DWD CDC
2018).
The observed significant rise in mT values might be a first manifestation of rising tem-
peratures due to anthropogenic climate change. Indeed, mean annual temperatures in the
survey period 1986–2018 were 1 °C higher than in the preceding 40 years (DWD CDC
2018). However, a more likely explanation is that the increase in mean mT values is influ-
enced both by the reduction of cold-indicating species, which are nearly exclusively mosses,
and by an increase in species with higher mT values that are mainly species of agricultural
grasslands. When only vascular species are included in the calculation of mT, the increase
238remains significant although less pronounced (mean change of mT, vascular plants: 0.08).
The increase or decrease of these species groups is likely determined by factors other than
climate change, e.g. nutrient levels or poor detectability of mosses due to very dry weather.
4.3 Vegetation changes
4.3.1 Changes in Nardus grasslands
Although the sampled Nardus grasslands are exposed to general regional and global
drivers like climate change, pH recovery, and nitrogen deposition in the range of critical
loads, the vegetation response of these Nardus grasslands was not very pronounced. The
observed changes were rather quantitative than qualitative – mR and mN values only
increased significantly when weighted with cover values of species. In contrast to findings
by DUPRÉ et al. (2010) and PEPPLER-LISBACH et al. (2020), Nardetalia character species only
decreased in cover, not in numbers. The rise in vascular plant species richness can be
explained by the decline in Al-toxicity following pH recovery (DE GRAAF et al. 2009). Con-
ditions have become suitable for a larger species pool, now also including acid-sensitive
species that are mainly present in agricultural grasslands. However, these newly appearing
species have not gained any dominance.
Evenness has slightly increased. There are no signs of competitive species like grami-
noids or tall herbs outcompeting small forbs (as in DUPRÉ et al. 2010, MASKELL et al. 2010,
MCGOVERN et al. 2011). On the contrary, low-competitive plants like the hemiparasitic
Rhinanthus minor and Pedicularis sylvatica have profited, along with several small sedge
species. Molinia caerulea and Nardus stricta, as fallow indicators, were pushed back. All
these findings can be attributed to the resumption of regular management after the fallow
phase preceding the initial survey. The annual mowing reduced the advantage of competitive
species, and therefore led to a more homogeneous vegetation structure (Fig. 5). Increased
N-availability may be a reason for the decline of moss species (LEE & CAPORN 1998, CAR-
ROLL et al. 2003). At the same time, the summer of 2018 was exceptionally hot and dry,
probably causing a temporary decline and poor detectability of bryophyte species.
The lack of strong eutrophication signs in Nardus grasslands were possibly caused by
a removal of excess nitrogen by mowing or a limitation of other nutrients, especially phos-
phorous (P) or potassium (K). Mowing has been found to quickly decrease K levels
(MLÁDKOVÁ et al. 2015), while VERHOEVEN et al. (1993) reported a complete withdrawal of
deposited nutrients by yearly mowing of grassland on fen soils in the Netherlands. Other
studies estimate nitrogen removal by mowing to amount to 25–50 kg N ha-1 a-1 for Eifel
grasslands (SCHUMACHER et al. 2013), 41 kg N ha-1 a-1 in continental mountainous grasslands
(MLÁDKOVÁ et al. 2015) or 24–63 kg N ha-1 a-1 in coastal prairie grasslands (MARON & JEF-
FERIES 2001). All these values exceed the current N input by atmospheric deposition
(approx. 11–12 kg N ha-1 a-1, UBA 2020). SCHUMACHER et al. 2013 hypothesised this to be a
major cause for continuously high alpha diversity in managed semi-natural grasslands of the
Eifel mountains. Additionally, the low measured ortho-phosphate concentrations suggest a
phosphorus limitation. Phosphorus concentrations in 1986 and 2018 cannot be compared
directly, due to differing soil-water extraction methods. The reported decrease is neverthe-
less plausible, also due to the fact that the centrifuged equilibrium soil solution used in 2018
would rather have contained more dissolved ions than the soil water used in 1986. As shown
in fertilising experiments, phosphorus limitation can inhibit the uptake of additional nitrogen
(PHOENIX et al. 2003), as well as reduce eutrophication effects, including loss of species
239(CHYTRỲ et al. 2009). To further investigate the nature of nutrient limitation, the plant tissue
N:P ratio could be used (KOERSELMAN & MEULEMAN 1996). This type of analysis was
beyond the scope of the present study.
Another important factor affecting the change in vegetation composition is the availabil-
ity of source populations of species that might be able to invade the present swards (ZOBEL
et al. 2000, FOSTER 2001). The meadows studied are mostly surrounded by coniferous forest
and thus isolated, not only from each other, but also from other types of grassland. A lack of
propagule availability might also explain why more nutrient-demanding species are slow to
colonise the swards, as opposed e.g. to the Rhön mountains, where Nardus swards are most-
ly embedded in agricultural grassland areas.
In summary, the mechanism most likely affecting vegetation response is the management
regime, which requires annual mowing in summer, counteracting eutrophication and the
dominance of single species. However, the current type of management might not be optimal
for all typical Nardus grassland species. Especially Arnica montana, as a flagship-species of
montane meadows, displays significant losses in frequency and cover, most likely due to
a lack of open soil structures for generative reproduction (Fig. 6) (KAHMEN & POSCHLOD
1998, RICHTER 2014). Moreover, the extremely dry season of 2018 might have contributed
to the decreased frequency and cover of Arnica, which is known to be very drought sensitive
(STANIK et al. 2020).
4.3.2 Changes in wet heaths
Although overall conditions, such as pH recovery, atmospheric depositions, and climate
change, affect the sites of wet heaths in the same way as the Nardus grasslands, evidences of
eutrophication in vegetation change were much more pronounced in the wet heath sites. This
is reflected by significant increases in mR and mN indicator values. The former wet heaths
have transformed into wet variants of Nardus grasslands, small sedge-dominated swards or
wet meadows with signs of eutrophication (e.g. presence of Angelica sylvestris and Galium
mollugo agg.) (Fig. 7). This agrees well with findings by BRITTON et al. (2017) from Scottish
wet heaths.
The conditions of wet heaths were more acidic and nutrient-poor in 1986 than those
of the Nardus grasslands, even after a 30-year fallow period preceding the initial survey.
The historical land-use practices that facilitated the formation of heaths, in this case the so-
called “Schiffelwirtschaft” (LUDWIG 1987, BFN 2017) consisted of a shorter arable phase,
prepared by sod-cutting and burning to use the ash for fertilisation, and a longer fallow
phase, with grazing and litter harvesting (BECKER 1970). Therefore, the heaths established
on very poor, undeveloped soils. Additionally, the dominant dwarf shrub species, especially
Erica tetralix and to a lesser extent Calluna vulgaris, may have further acidified the soil by
their use of ammonium as a nitrogen source (BERENDSE 1998). They serve as net accumula-
tors of humus, as their litter has a high lignin content and decomposes only slowly
(LEUSCHNER & ELLENBERG 2017). Thus, after a fallow period of more than 30 years, a con-
siderable humus layer had developed until 1986 (LUDWIG 1987, Tab. 12). The start of annual
mowing since the late 1980s disadvantaged and pushed back the dwarf shrubs as they are
less able to compensate for annual biomass losses than the more regenerative grasses
(LEUSCHNER & ELLENBERG 2017). Once humus accumulation halted, decomposition could
begin, leading to elevated nutrient availability (BERENDSE et al. 1987). Increased pH values
and higher temperatures may have additionally enhanced the rate of humus decomposition
240a)
b)
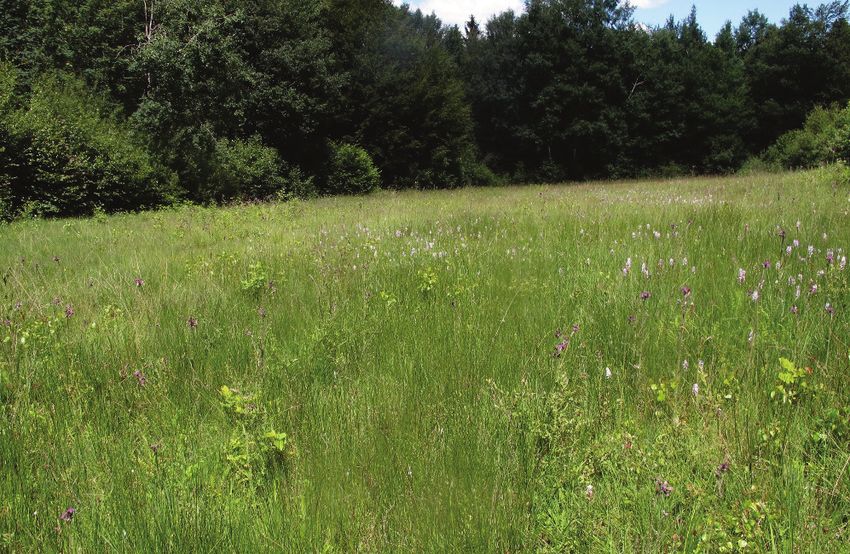
Fig. 5. a) Nardus grassland (Juncenion squarrosi and Galium saxatile-Nardus community) in the
“Mäusenest“ area in the nature reserve “Baasemer Heide“ near Berk (Photo: G. Ludwig, July 1986).
b) Same view of “Mäusenest” in the nature reserve “Baasemer Heide“ in 2018. Nardus grassland (Jun-
cenion squarrosi) with transitions to small sedge swards (Caricetum nigrae Br.-Bl. 1915) (Photo:
L. Mazalla, 15.06.2018).
Abb. 5. a) Borstgrasrasen (Juncenion squarrosi und Galium saxatile-Nardus-Gesellschaft) im „Mäuse-
nest“ im NSG „Baasemer Heide“ bei Berk (Foto: G., Ludwig, Juli 1986). b) Gleiche Ansicht des „Mäu-
senests“ im NSG „Baasemer Heide“ in 2018. Borstgrasrasen (Juncenion squarrosi) mit Übergängen zu
Kleinseggenrieden (Caricetum nigrae Br.-Bl. 1915) (Foto: L. Mazalla, 15.06.2018).
241a)
b)
Fig. 6. a) Nardus grassland (Juncenion squarrosi) with Arnica flowering aspect. “Westlich Ehrend” in
the nature reserve “Baasemer Heide” near Baasem. In the 2000s, this population was considered the
largest in the NRW-part of the Eifel (SCHUMACHER et al. 2007) (Photo: G. Ludwig, June 1987).
b) Same view of “Westlich Ehrend” in the nature reserve “Basemer Heide” in 2018. Nardus grassland
(Juncenion squarrosi) also at the end of the blossoming time of Arnica (Photo: L. Mazalla,
24.06.2018).
Abb. 6. a) Arnica-Aspekt des Borstgrasrasens (Juncenion squarrosi) „Westlich Ehrend“ im NSG
„Baasemer Heide“ bei Baasem. In den 2000er Jahren wurde dieses Vorkommen als das größte im
NRW-Teil der Eifel angesehen (SCHUMACHER et al. 2007) (Foto: G. Ludwig, Juni 1987). b) Gleiche
Fläche in 2018 zum Ende der Blütezeit von Arnica, die aber kaum noch vorhanden war (Foto:
L. Mazalla, 24.06.2018).
242a)
b)
Fig. 7. a) Wet heath (Ericion tetralicis). Nature reserve “Rinner Heide“ near Sötenich (Photo: G. Lud-
wig, July 1985). b) Same view of nature reserve “Rinner Heide“ near Sötenich in 2018. Eutrophic wet
heath (Ericion tetralicis) with nutrient indicators (e.g., Galium mollugo agg., Angelica sylvestris) (Pho-
to: L. Mazalla, 20.06.2018).
Abb. 7. a) Feuchtheide (Ericion tetralicis). NSG „Rinner Heide“ bei Sötenich (Foto: G. Ludwig, Juli
1985). b) Gleiche Ansicht des NSG „Rinner Heide“ bei Sötenich in 2018. Eutrophierte Feuchtheide
(Ericion tetralicis) mit Nährstoffzeigern (z. B. Galium mollugo agg., Angelica sylvestris) (Foto:
L. Mazalla, 20.06.2018).
243(LEUSCHNER & ELLENBERG 2017, PEPPLER-LISBACH & KÖNITZ 2017). The atmospheric
inputs of nitrogen may have additionally given grasses a competitive advantage over dwarf
shrub species (BERENDSE et al. 1987).
Another key species for nutrient cycling is Molinia caerulea, which is able to withhold
nutrients from the community by internal nutrient cycling (BERENDSE et al. 1987). The
observed reduction in cover values of Molinia due to regular and early mowing could have
led to increased nutrient availability for other species.
Considering this background, the question arises, if annual mowing is a suitable man-
agement tool for preserving wet heath vegetation at all. More appropriate ways of managing
and preserving the typical species composition of wet heaths are probably extensive grazing
by sheep and occasional sod cutting.
4.4 Drivers of change
Differences between sites and initial syntaxon identity accounted for most of the
explained variance in the data set. The differences between sites translated to local condi-
tions such as changes in water regime, fragmentation, or the behaviour of single land-users.
Differences between syntaxa represent the differing internal mechanisms that drive the
responses of grasslands and heaths to annual mowing. Additionally, idiosyncrasies of single
plots (e.g. plot-specific management history, disturbance events or pseudo-turnover) might
have contributed to floristic turnover, but were not explicitly quantified. Obviously, changes
in species composition were relatively poorly determined by the environmental factors
investigated in this study, similar to findings reported by PEPPLER-LISBACH & KÖNITZ
(2017). The influence of the drivers did not differ systematically in terms of strength or
direction between wet heaths and Nardus grasslands. The increase in pH values between
1986 and 2018 did show the hypothesised influence on variables like total vascular species
richness, number of agricultural grassland species, and cover of Nardetalia character spe-
cies; its overall effect was, however, limited, as indicated by low proportions of explained
variance in regression models and RDA. We conclude that even though pH recovery clearly
drives some of the change, as previously reported by ROEM & BERENDSE (2000), DUPRÉ et
al. (2010) and PEPPLER-LISBACH et al. (2020), it was not the main driver of overall vegeta-
tion change. It was not possible to directly test the influence of atmospheric deposition, due
to the limited spatial extent of the study with relatively uniform deposition rates over all
sites. The typical effects of elevated N deposition are, however, well described in the litera-
ture. As these are only moderately represented here, we assume that nitrogen deposition is
also not the most crucial driver of vegetation change.
In sum, we think that the initial community type (and the conditions that shaped it),
together with the reintroduction of management after 1986, and other local factors, mainly
determined the changes that occurred since then. Studies from forests also found that man-
agement legacies dictate floristic community responses to global drivers like deposition and
climate change (PERRING et al. 2018).
4.5 Pseudo-turnover
Observer and location bias are sources of uncertainty in all resurvey studies (KAPFER et
al. 2017). However, due to careful study design, we consider it very unlikely that the
consistent directional trends uncovered in the present study should have been decisively
244influenced by pseudo-turnover. We are confident that the general patterns and trends reflect
the true development of vegetation composition in these grasslands and heaths.
5. Conclusions
Since the original survey in 1986, we found the expected increase in soil pH, presumably
due to the reduction of sulphur dioxide emissions. It is likely that the appearance of several
acid-sensitive species can be attributed to the effects of increased pH, i.e. decreased alumini-
um or ammonium toxicity and increased nutrient supply due to increased remineralisation.
The anticipated eutrophication was especially pronounced in the wet heath sites that had
transformed into more mesotrophic vegetation types. In Nardus grasslands, however, species
composition shifts towards eutrophication were relatively weak. This result was somewhat
unexpected, especially compared to other studies from German Nardus grasslands, where
even less pronounced increases in pH were linked to more distinct indications of eutrophica-
tion. We conclude that the regular management applied to the sites contributed essentially to
this outcome by counteracting eutrophication in an effective way. In the surveyed Nardus
grasslands, the relatively early date of mowing (from mid-July) enabled a successful removal
of nutrients and resulted in a characteristic structure and species composition. However,
some quantitative changes (increase in cover-weighted mR and mN, decrease in cover of
character species) indicate a certain risk of eutrophication and loss of specialist species, and
that continuing management will be crucial for a sustained conservation of Nardus grass-
lands. The same management, however, was not able to preserve wet heaths equivalently. By
strongly disadvantaging the dominant dwarf shrubs, regular mowing altered the internal
nutrient cycling of the heaths which led to increased eutrophication effects. Other manage-
ment strategies, e.g. periodic top soil removal, possibly combined with extensive grazing,
should be considered for maintaining the wet heath stands. In any case, we recommend
further monitoring, preferably every five years, to calibrate management plans to secure the
survival of these important remnants of historical land use.
Erweiterte deutsche Zusammenfassung
Einleitung – Halbnatürliche Offenlandvegetation ist in Europa ein Hotspot der Biodiversität
(HABEL et al. 2013, DENGLER et al. 2014). Von der jüngeren Vergangenheit bis in die Gegenwart
stellen Landnutzungsveränderungen, atmosphärische Depositionen, insbesondere von reaktivem Stick-
stoff und Schwefeldioxid, und neuerdings auch der Klimawandel eine Gefahr für die Artenvielfalt
dieser Habitate dar (SALA et al. 2000, POSCHLOD et al. 2005). Die vorliegende Wiederholungsuntersu-
chung der Vegetation von Borstgrasrasen, Pflanzengesellschaft des Jahres 2020 (SCHWABE et al. 2019),
und Feuchtheiden in der Eifel zwischen 1986 und 2018 hatte zum Ziel, die Entwicklung dieser Vegeta-
tionstypen unter dem Einfluss der genannten Stressoren zu untersuchen. Die Landnutzung der Untersu-
chungsflächen bestand im Untersuchungszeitraum aus einem Pflegemanagement durch den Vertragsna-
turschutz; bis kurz vor der Erstaufnahme hatten die Flächen längere Zeit brach gelegen. Gemäß diesen
Rahmenbedingungen erwarteten wir daher, dass (1) das Pflegemanagement mit einschüriger Mahd die
Vegetationstypen zumindest erhalten konnte, (2) der pH-Wert des Bodens durch den Rückgang der
Schwefeldioxid-Emissionen seit den 1980er Jahren wieder angestiegen ist, und (3) dieser pH-Anstieg in
Kombination mit Stickstoff-Emissionen zu einer Eutrophierung der Standorte mit entsprechenden
Veränderungen der Artenzusammensetzung geführt hat.
245You can also read