NASDAQ: GSM Advancing Materials Innovation - Investor Relations ...
←
→
Page content transcription
If your browser does not render page correctly, please read the page content below
Advancing Materials Innovation
        NASDAQ: GSM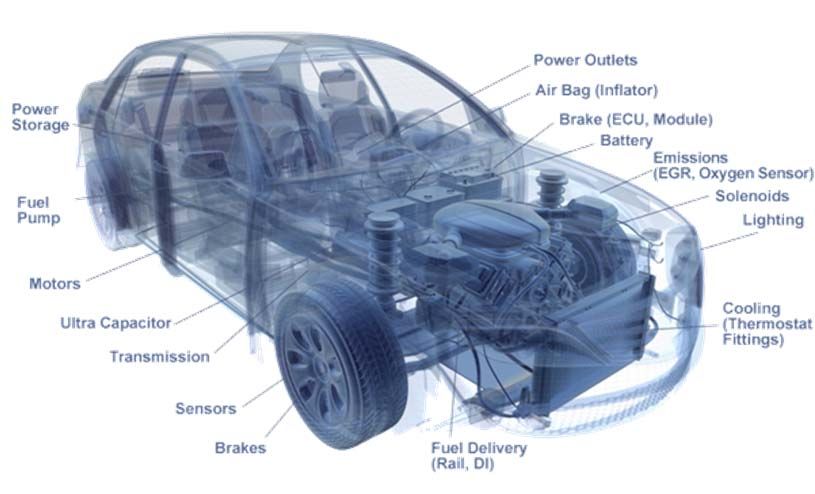
Forward‐Looking Statement
This presentation contains forward‐looking statements within the meaning of Section 27A of the United States Securities Act of 1933, as amended,
and Section 21E of the United States Securities Exchange Act of 1934, as amended. Forward‐looking statements are not historical facts but are
based on certain assumptions of management and describe our future plans, strategies and expectations. Forward‐looking statements can
generally be identified by the use of forward‐looking terminology, including, but not limited to, "may," “could,” “seek,” “guidance,” “predict,”
“potential,” “likely,” "believe," "will," "expect," "anticipate," "estimate," "plan," "intend," "forecast," or variations of these terms and similar
expressions, or the negative of these terms or similar expressions.

Forward‐looking statements contained in this presentation are based on information presently available to us and assumptions that we believe to
be reasonable, but are inherently uncertain. As a result, our actual results, performance or achievements may differ materially from those
expressed or implied by these forward‐looking statements, which are not guarantees of future performance and involve known and unknown
risks, uncertainties and other factors that are, in some cases, beyond our control.

You are cautioned that all such statements involve risks and uncertainties, including without limitation, risks that the businesses of Globe Specialty
Metals Inc. and Grupo FerroAtlántica (together, “we,” “us,” “Ferroglobe,” the “Company”) will not be integrated successfully or that we will not
realize estimated cost savings, value of certain tax assets, synergies and growth, or that such benefits may take longer to realize than expected.
You should carefully consider the foregoing factors and the other risks and uncertainties that affect our business, including those described in the
“Risk Factors” section of our Annual Reports on Form 20‐F, Current Reports on Form 6‐K and other documents we file from time to time with the
United States Securities and Exchange Commission. We do not give any assurance (1) that we will achieve our expectations or (2) concerning any
result or the timing thereof, in each case, with respect to any regulatory action, administrative proceedings, government investigations, litigation,
warning letters, consent decree, cost reductions, business strategies, earnings or revenue trends or future financial results. Forward‐ looking
financial information and other metrics presented herein represent our key goals and are not intended as guidance or projections for the periods
presented herein or any future periods.

We do not undertake or assume any obligation to update publicly any of the forward‐ looking statements in this presentation to reflect actual
results, new information or future events, changes in assumptions or changes in other factors affecting forward‐looking statements. If we update
one or more forward‐looking statements, no inference should be drawn that we will make additional updates with respect to those or other
forward‐looking statements. We caution you not to place undue reliance on any forward‐looking statements, which are made only as of the date
of this presentation.

                                                                                                                                                         1
Ferroglobe PLC ― The Crea on of a Unique, Exciting, Focused and Growing
Industrial Company
Advancing Materials Innovation
Merger closed on December 23, 2015
Ferroglobe PLC trades on NASDAQ (Ticker: GSM)
Current market capitalization: $1.7 billion
2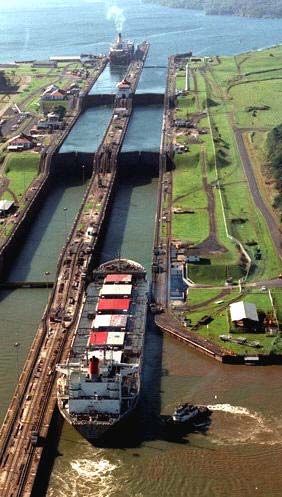
1   Differentiated and unique business profile

2   Positioned for growth through M&A and organically

3   Significant synergies from transaction

                                                        3
1 Strong Business Profile Uniquely Positioned To Deliver Value
― world‐class assets in 5 continents ‐ no operating overlap ‐ significant synergies
― significant industry leading and improved cost position through diversified currency exposure
― establishment of a clear leader in our core markets (Europe + North America)
2 Bécancour, Canada 14 New Castle, South Africa 20 Serrabal, Spain 23 Laudun, France 30 Boo, Spain
Silicon JV 45,000 mt Ferrosilicon 45,000 mt Quartz Mine Silicon 23,000 mt Ferro Manganese 57,000 mt
Globe 51% 23,000 mt Ferrosilicon 35,000 mt Silicomanganese 115,000 tons
15 Police, Poland 21 Hydro Plants, Spain
Dow Corning 49% 22,000 mt
Cored Wire 8 mil meters 12 plants with 192MW combined 24 Polokwane, South Africa
3 capacity 31 Cee, Spain
La Malbaie, Quebec Silicon / Quartz Mine 55,000 mt
Quartz Mine Shizuishan, Ningxia Hui, Ferrosilicon 18,000 mt
16 China (“Yonvey”) 22 Hydro Plants, France 25 eMalahleni, South Africa Ferro Manganese 55,000 mt
4 Niagara Falls, NY Carbon Electrodes 12,000 mt 2 plants with 20MW combined
capacity Silicon 12,000 mt Silicomanganese 37,000 mt
Silicon 27,000 mt
Ferrosilicon 40,000 mt
5 Beverly, OH Inoculants 10,000 mt 32 Dumbria, Spain
Ferrosilicon and Ferrosilicon 61,000 mt
52,000 mt
Foundry Alloys
Silicon 25,000 mt
33 Sabon, Spain
Ferrosilicon 40,000 mt
Silicon 40,000 mt
6 Alloy, WV
Silicon JV 72,000 mt 15
1 34
35 Monzon, Spain
Globe 51% 36,700 mt 39 38
2
22 23 36
Ferro Manganese 80,000 mt
Dow Corning 49% 35,300 mt 3 32 33 37
4 30 34
31
20
17 21 Silicomanganese 80,000 mt
5
7 Corbin, KY (Alden Resources) 8
6
29 18
16
10 7
Specialty Coal & 9 35
2.5 mil tons 11
Pierrefitte, France
Preparation Plant
8 27 Inoculants 14,000 mt
Aurora, IN
Fluorspar
36 Anglefort, France
9 Billingsley, AL 19
22
Silicon 35,000 mt
Quartz Mine 26 Venezuela
10 Ferrosilicon 96,000 mt
Bridgeport, AL 37 Les Clavaux, France
Ferro Manganese 21,000 mt
Ferrosilicon 35,000 mt Silicon 35,000 mt
Silicomanganese 22,000 mt
11 Selma, AL 24
25
Silicon 24,000 mt 17 Sonia, Spain 28 27 Mangshi, China 38 Montricher, France
14
Quartz Mine
12 Silicon 36,000 mt Silicon 33,000 mt
12 Mendoza, Argentina
13
Calcium Silicon, 18 28 SamQuarz, South Africa
21,000 mt Conchitina, Spain
Foundry Alloys 39 Chateau Feuillet, France
Cored Wire 24 mil meters Quartz Mine Quartz Mine
Silicon 23,000 mt
13 Argentina 19 Venezuela 29 Esmeralda, Spain Inoculants 20,000 mt
Hydroelectric Power 12 MW Quartz Mine Quartz Mine Calcium Silicide 15,000 mt
Ferroglobe Operations Ferroglobe Headquarters
4
1 New And Changed Industry Dynamics
Growth in Silicon Consumption Expected to Ferroglobe is Well Positioned within the Global
Accelerate from Historical Levels Silicon Industry
3,500 AMG
Simcoa 3% Total Capacity (Excl. China)
3,000 5% Other 1,134Ktpa
9%
2,500 Wacker
2,000 5% Ferroglobe
KMT
35%
1,500
UC Rusal
1,000
5% Dow
500 Elkem Corning
Rima 14% 18%
0 6%
2007 2008 2009 2010 2011 2012 2013 2014 2015 2016 2017 2018 2019 2020
Western World China
Rising Silicon Demand Expected to Drive Price
Recovery in 2017‐2020 Commentary
4,000
Industry benefits from market demand across a very wide
3,500
range of applications
3,000
2,500 Demand is expected to grow at 6.0% CAGR from 2016 – 2020
$/t
2,000
1,500 CRU forecasts a 2017‐2020 price recovery driven by rising
1,000 silicon demand
500
Non existence of distribution or terminal market inventories
0
2007 2008 2009 2010 2011 2012 2013 2014 2015 2016 2017 2018 2019 2020
contributes to relative resilience
USA Europe Japan
Source: CRU 2015, Ferroglobe
Note: Silicon consumption, pricing, and capacity data are from CRU.
5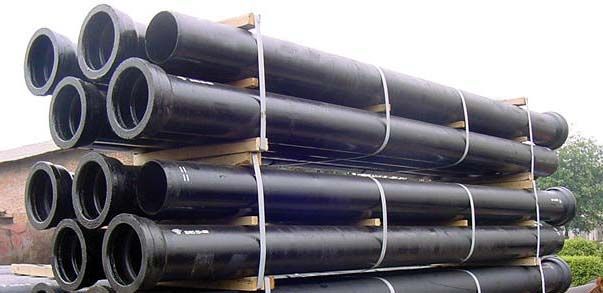
1 Leader In These Exciting, Fast‐Growing End Markets
Aluminum / Auto Chemicals / Silicones Solar
Government mandate on fuel efficiency leading to Improvements in world economies and increased Significant growth potential driven by favorable
light‐weighting discretionary income driving strong chemical mega‐trends
consumer product consumption availability of energy related financing,
Global growth in new automobile sales increasing
battery/storage, and consumer preference for
renewable energy
Weather Dashboard
Stripping Silicon Polysilicon Wafer
Cables
Tires Coatings Solar
Installation Solar Panel Solar Cell
Electronics Steel and Specialty Steel Construction
Strong microprocessor growth driven by demand Long term urbanization trends create substantial Improving economic conditions leading to increase
for computers, tables, smartphones, etc. growth potential in construction and infrastructure build‐out
Paint
Grout
Sealant
6
1 Industry Leading Low‐Cost Structure
Maintaining Key Competitive Advantages in the Global Silicon Landscape
Just‐in‐time delivery of raw materials
and finished goods keeps working
capital low; close proximity to plants
Raw materials a critical differentiator
— Ferroglobe is vertically integrated
Maintain industry leading cost
structure to ensure profitability
Silicon Metal
Silicon Alloys through cycles
Manganese Alloys
Others Exposure to currency related cost
Cored Wire
Electrodes
advantages
Coal & Prep Plant
Slag Conditioners
Quartzite Mine
Power Plants
6 Tons of Raw Materials 1 Ton of Silicon Metal
Power
Specialty Coal Quartz/Gravel Woodchips
(~35% ‐ Raw Materials ) (~40% ‐ Low Cost Power)
7
1 Management Focused On Financial Metrics And Free Cash Flow Generation
And Shareholder Returns
Velocity of working capital — implementation of GSM methods for
rapid cash conversion; industry leader in turning inventory and
collecting receivables
Focus on maintaining industry leading EBITDA margins by managing
costs and focused on margin creation
Management aligned with shareholders — current dividend yield of
3.2%
8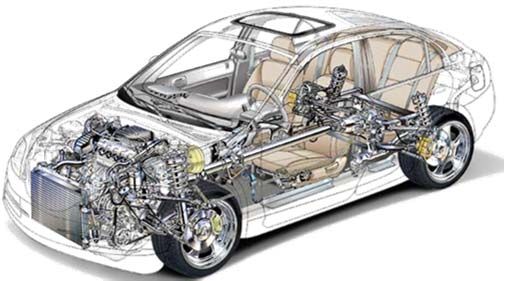
1                            Ferroglobe’s New Cost Position Provides Strong Leverage To Price And, As
                                                 A Result Of The Merger, Leverage To Cost

                                                $1,000
                    Illustrative EBITDA ($mm)

                                                 $800
Leverage to Price

                                                                                                                                                         Price Improvement ($/lb)
                                                 $600

                                                 $400
                                                                   Synergies: $65mm
                                                 $200
                                                         LTM 12/31/15 Adjusted EBITDA: $295mm

                                                   $0
                                                                                                $0   $0.025   $0.05    $0.075   $0.10   $0.125   $0.15       $0.175     $0.20       $0.225

                                                 $200
                    Illustrative EBITDA ($mm)

                                                                                                                                                         Cost Improvement ($/lb)
Leverage to Cost

                                                 $400

                                                 $600

                                                 $800

                                                $1,000

                                                         Implied EBITDA ($mm)              $365      $519     $674     $828     $982    $1,137   $1,291      $1,445    $1,600       $1,754

                                 Note:
                                 1. Incremental EBITDA illustration based on combined capacities across all products                                                                         9
1 Ferroglobe’s New Cost Position Provides Strong Leverage To Price And, As
A Result Of The Merger, Leverage To Cost
Illustrative Impact of Leverage to Price & Cost
Cost Reduction
Price Improvement
Synergies: $65mm
LTM 12/31/15 Adjusted EBITDA: $295mm
Note:
1. Incremental EBITDA illustration based on combined capacities across all products 102 Most Investors Have Lumped The Industrial Sector Into The Same
Bucket
Industrial sector is actually currently split into 2 categories:
Significant liquidity
No looming debt maturities
“Haves” Continue to remain profitable during economic down‐cycle; positive cash flow generation
Capable of remaining focused on growing the business
Limited cash on hand/liquidity concerns
Reviewing portfolio and divesting assets to raise capital
“Have Nots” Stretched balance sheet; risks of refinancing significant amounts of current debt
Unprofitable and using up cash to fund losses
Risks of restructuring/bankruptcy in current market environment
The “haves” are uniquely positioned to leverage their strong positions to continue
executing the business plan and setting the business up for strong growth, as they exploit
current market opportunities at attractive valuations
112 Our Companies Have An Exceptional Track Record and Culture Of Growth
Acquisitions, Divestitures and Selected Investments Over Time
Mendoza Divestiture
Alloy, WV, Alabama and San Luis, of Camargo, Becancour,
Sand & Gravel, AL, and Argentina Brazil and 49% of Alloy Canada
Alloy Power
GSM
Yonvey,
Alden,
China
Selma, AL Divestiture KY
of Alloy Power Siltech,
Niagara, NY South Africa
Beverly, OH Camargo, Core Metals,
Brazil AL and MPM, IN
2015
Merger of
1992 1996 1998 2000 2004 2005 2006 2007 2008 2009 2010 2011 2012 2013 2014 GSM &
Ferro‐
FerroVen SA Pechiney Atlántica
(Puerto Électrométallurgie
Ordaz, Venezuela) (FerroPem & SiliconSmelters)
FerroAtlántica
Cuarzos Rocas, Sinice Silicon Industries
Industriales Arcillas y Minerales (Mangshi), China
SA, Spain (RAMSA)
Hidro Nitro
SamQuarz,
Española Rand Carbide
South Africa
SA, Spain
Alloys Silicon Metal Quartz Coal Electrodes FeSi Silica Fume Power
History of Successfully Acquiring, Integrating, Operating and Growing Businesses while Retaining Targeted Approach
through Successful Asset Divestitures 122 …Particularly During Cyclical Lows And At Distressed Prices…
Previous Previous Current
1,710 Investment Period Investment Period Investment Period
Acquired GMI, Acquisition of Acquisitions of Acquisition of
1,520 including Selma, AL, Mendoza and San Yonvey, China; Core Siltech, South Africa
Niagara, NY, and Luis, Argentina; and Metals, AL; MPM, IN;
Beverly, OH facilities Camargo, Brazil Alden, KY1;
Becancour, Canada2
S&P / TSX Composite Index Metals & Mining
1,330 Subsequent
acquisitions of Alloy, Merger Closed
WV, Alabama Sand &
1,140 Gravel, AL, and Alloy
Power
950
760
570 Acquired FerroVen,
Rocas Arcillas y
Minerales, Pechiney
Électrométallurgie
380 (FerroPem and Silicon
Smelters)
190 Acquired SamQuartz, South
Acquired Rand
Africa
Carbide , South Africa
and Mangshi, China
0
1998 1999 2000 2001 2002 2003 2004 2005 2006 2007 2008 2009 2010 2011 2012 2013 2014 2015 2016 2017 2018
Source: Bloomberg. Market
1 Initial discussions commenced in 3Q10; acquisition announced 2Q11
2 Initial discussions commended 4Q11; DIP financing in Jan. 2012; acquisition announced Apr. 2012 132 …Facilitated by a Strong Balance Sheet and Liquidity
Pro Forma1
($mm) 12/31/2015
Cash on hand2 $117
Net Debt3 $393
Adjusted EBITDA $295
Year-1 Synergies $65
Pro Forma Adjusted EBITDA4 $360
Net Debt / Pro Forma Adjusted EBITDA ~1.1x
Potential Liquidity ~$1,0005
1 Financial results are unaudited, illustrative purposes only
2 Cash on hand includes Globe’s marketable securities
3 Net Debt includes Globe’s marketable securities and includes finance lease obligations
4 Pro Forma Adjusted EBITDA is the LTM Adjusted EBITDA including the year‐1 synergies
5 Based on contemplated refinancing of FerroAtlántica debt
142 Our Experienced Team of R&D Specialists, Dedicated to Advancing
Materials Innovation, Developed Technologies To Fuel Organic Growth
and ‘Next Generation’ Product Growth
Developed potentially disruptive, upgraded
metallurgical grade silicon
Achieves excellent results — 18.5% efficiency
Commercialization
of Solar Grade
Silicon Metal Low capex, low energy consumption, low
environmental impact and low cost relative to
conventional polysilicon technology
Global leader in value added special inoculants and
area of FerroAtlántica expertise
Global specialist in production of customized
Inoculants and nodularizers an area of GSM expertise
Nodularizers
The combination of platforms in these specialized
products allows Ferroglobe to service foundries and
maximize sales
153 Moreover, Merger has $1 Billion in Value Creation Potential Alone!
Run Rate
• Consolidation of management functions
• Elimination of regional offices and redundancies
SG&A / Overhead $10mm
• Reduction in R&D
Illustrative Value Creation
• Industrial planning to optimize plant utilization
and production runs
A Platform Optimization • Optimized production to service closest $30mm
customers; savings on freight an duty EV/EBITDA: ~$520
• Cross‐selling opportunities 8.0x
• Furnace maintenance and improvements to
maximize yield
Best Practices • Procurement/raw material integration
$25mm
Efficiencies1 • Electrode technology
• By‐product recovery process
• Tax savings
• Refinancing of existing debt
+B Financial Synergies $30mm P/E: $450
• Pay‐down of debt from release of working
capital 15.0
• Improved inventory and raw materials Aggregate 3‐Year
+C Working Capital Release management $100
Benefit: $100mm
Total $1,008
Per Share1 $6.23
Source: GSM and FerroAtlántica management estimates
1 Includes raw material integration, electrode technology, by‐products recovery process, research and
development and laboratory technology
16Our Execution Plan…
Key focus area
Organization Already underway —
Operational (Industrial planning) complementary footprint;
1. Integration Sales/Marketing no facility rationalizations
Procurement required
Information Technology
First 90 days First 180 days Day 181 – End of year 1
2. Potential SG&A and overhead Platform optimization (partial) Platform optimization
Financial synergies Best practices efficiencies $1 bn in value crea on ―
Synergies Year End Target: $65mm
Working capital release Continued working capital
Realization release
Review of Alternatives
3. Asset Value
Value unlocking strategy Focus on maximizing
Maximization Working capital un‐lock shareholder value
Optimization of efficiency and productivity
Well defined financial goal
Working capital unlock with proven execution
4. Cash Generation Inventory management
strategy
Payment terms
Long‐History of Disciplined M&A
Uniquely positioned to
Uniquely positioned to exploit stretched balance sheets and
5. External Growth acquire assets low valuations
capitalize on abundant
Management track‐record, operational expertise opportunities
Leveraging Research & Development
Leverage operational,
History of developing industry‐leading processes and techniques that have enhanced our
6. Internal Growth competitive position
technical, and innovation
Development of solar technology expertise
17Seasoned And Proven Executive Leadership Team
Alan Kestenbaum, Executive Chairman
Over 25 years’ experience in metals trading, distribution, finance and manufacturing
Founded leading international metals trader, Marco International, in 1985 and led its expansion into China and the former Soviet Union
Managed a series of successful metals private equity transactions
Began career in metals with Glencore and Philip Brothers in New York
Javier Lopez Madrid, Executive Vice Chairman
CEO of Grupo Villar Mir since 2002
Vice‐Chairman and CEO of Grupo FerrroAtlántica since 1992
Previously engaged in several entrepreneurial endeavors in financial and technological sectors
Began career as investment banker in London with Schroders and Salomon Brothers
Pedro Larrea Paguaga, Chief Executive Officer
Chairman and CEO of Grupo FerroAtlantica since 2011
Chairman and CEO of Endesa Latinoamerica, the biggest power company in Spain and Latin America
Partner in charge of energy sector in PwC consulting division, and consultant in McKinsey & Company
Belonged to various Board of Directors of public companies listed in the U.S.(Enersis, Endese Chile)
Technical and business background: MSc in Mining and Energy, and MBA from INSEAD
Joe Ragan, Chief Financial Officer
CFO of Globe Specialty Metals since 2013
Former CFO of Boart Longyear from 2008‐2013, the world’s largest drilling services contractor for the global mining sector
U.S. Army Military Intelligence Officer
Certified Public Accountant in the Commonwealth of Virginia
18Balance Sheet Summary
Pro Forma
($mm) 12/31/2015
Total Assets $2,406
Net Debt1 $393
Book Equity $1,295
Net Debt1 / Total Assets 16.3%
Net Debt1 / Capital2 23.3%
1 Net Debt includes Globe’s marketable securities and includes finance lease obligations
2 Capital is calculated as book equity plus net debt
19Income Statement Summary (IFRS)
Pro Forma
($mm) 12/31/2015
Sales $2,040
Operating (Loss) Profit ($44)
(Loss) Profit Attributable to the Parent ($97)
Adjusted EBITDA $295
Year-1 Synergies $65
Pro Forma Adjusted EBITDA $360
Adjusted EBITDA Margin 14.5%
20Investment Recap
Differentiated and unique business model
— the leader in the industry, serving fast‐growing end markets
— industry leading low cost structure
— significant leverage to price and costs
Positioned for growth led by experienced management team
— exceptional track record and culture of growth, particularly during cyclical lows
— strong balance sheet and liquidity to support growth strategy
Significant synergies from transaction
— approximately $1 billion in value creation potential
Management focused on shareholder returns
— significant management ownership uniquely aligns management with shareholders
— dividend distributions: current yield is over 4%
21Appendix
Investment Highlights

1   Ferroglobe was created by the merging of the two industry leaders with complementary profiles
                                                  Global Producer

    Leadership positions in exciting, fast‐growing end markets……all while keeping a focus on industry leading
    low cost structure

    Maintaining exceptional, industry leading financial metrics and free cash flow generation

    The merging of two leaders with an exceptional track record and culture for growth…particularly, during
2   cyclical lows and at distressed prices

    Experienced team of R&D specialist developing proprietary solutions, and dedicated to advancing
    materials innovation

    Ferroglobe provides growth potential by creating value, driven by the combined platform’s leverage‐to‐
    price and cost

3   Merger has $1 billion in potential value creation alone

                                                                                                                23
Complementary Management Style and Growth Strategy
Juan Miguel Villar Mir Alan Kestenbaum
Founder and Chairman Founder and Executive Chairman
Grupo Villar‐Mir, SAU is one of the largest privately‐owned European Proven value‐driven investor of industrial assets globally
industrial Groups; founded in 1987 by Juan Miguel Villar Mir
Rescued the predecessor company of GSM from bankruptcy in 2003 and
Currently 57% owner in Ferroglobe (previously owned 100% of built it into a multi‐billion dollar enterprise
FerroAtlántica)
— Excellent track record acquiring, integrating and operating
Strong track record of being a supportive, major shareholder in large businesses methodically grew GSM through a series of 15
public companies acquisitions
History of growing businesses through disciplined acquisitions at
Expertise in distressed investing and structuring to acquire assets at
attractive entry points attractive valuations
Gradually developed a global conglomerate of diversified businesses with
presence in 36 countries across 5 continents Disciplined management philosophy
Combined the group has ~€6 billion in sales and ~$1.3 billion in EBITDA — focus on value creation, acquiring low cost assets, maintaining strong
balance sheet at all times
Publically traded, concession and construction international group ;
presence in 30 countries across 5 continents
18.9% stake in world leader in Toll Roads with 28 concessions and
7,500 km under management; European leader in telecom
infrastructure and broadcasting
98.8% stake in leading fertilizer producer in the EU and the
Mediterranean basin, and one of the main operators in the ammonia
and derivatives market Basin
VM Energia is electricity and gas trading company that supplies 4,600
Million KWh to 26,827 sites and represents 1,953 MW of renewable
energy
Acquired in 2014, is the leading property company of the Euro zone
prime office rental sector; currently owns 24.4%
Real estate companies which own historic buildings, luxury hotels
and commercial buildings in Europe
High quality real estate developers in Spain
24A New, Diversified Platform
Old GSM Ferroglobe
Asia
3%
LatAm LatAm
14% 11%
South Africa
by Geography1
6% South
Capacity
Africa
12% Europe
North
55%
North America North America America
80% 19%
Europe 46%
44%
Note:
1 Based on production capacity; excludes silica fume, by‐products, coal and cored wire production 25Global Silicon Consumption to Grow by ~6% Per Annum
kMT
3,000
2,500
2,000
1,500
1,000
500
0
2005 2006 2007 2008 2009 2010 2011 2012 2013 2014E 2015E 2016E 2017E 2018E
Western World China & CIS
Source: CRU
26Silicon End Uses
Silicones (50% Of Silicon Metal Consumption)
750,000 tons consumed by silicones industry
GDP + 4% growth – NA silicones facilities running at full capacity
Paint
Weather Stripping Dashboard
Cables
Grout Sealants
Tires Coatings
Caulking Shampoo Cosmetics
Note: % of sales figures represent industry estimates of western world consumption, For additional detail on silicones end markets, visit www.silicones.eu
27Silicon End Uses
Aluminum (40% of Silicon Metal Consumption)
Silicon metal required in aluminum as a strengthener and alloying agent to improve castability and minimize shrinking and cracking
Significant growth expected in silicon‐intensive aluminum wheels to meet EPA regulations for the trucking industry (aluminum
wheels average 7.5% silicon content by weight)
Aluminum provides a lighter weight alternative to steel
Aluminum demand has increased at a 5%+ CAGR for the past 20 years
North American Light Vehicle
Global Primary Aluminum Demand Aluminum Content as a Percent of Curb Weight
(000s tons) 14.0% 13.0%
55,000
50,000 12.0%
10.4%
45,000
10.0% ~500
40,000 8.8%
Pounds
35,000 7.8%
8.0% 7.1% 6.9%
30,000 6.4% 343
Pounds
25,000 6.0%
77 4.5%
20,000 Pounds 3.9%
4.0%
15,000
2.1%
2.0%
10,000 Approx. 10kg of silicon metal per car
2.0%
5,000
0 0.0%
2003 2004 2005 2006 2007 2008 2009 2010 2011 2012 2013 2014E 2015E 1970 1975 1980 1985 1990 1995 2000 2005 2010 2015E 2020E
Source: Bloomberg and Street research Source: Ducker Worldwide
Note: Based on 3,600 lbs of curb weight
28Silicon End Uses
Solar (10% of Silicon Metal Consumption)
Continued decreases in solar wafer and module prices stimulating demand
Financing companies such as YieldCos and home installations such as SolarCity driving demand acceleration
Global solar related silicon demand to exceed 500,000 by 2016. An increase of more than 50% since 2014 (representing 20% of world silicon
consumption)
Projections have been consistently beaten by actual growth
Global Solar Demand ― 2008 vs. 2012 Projec ons Solar Installations Continue to Grow Rapidly
MW Silicon Tons MW Silicon Tons
160,000 1,200,000 160,000 1,200,000
140,000 140,000
1,000,000 1,000,000
120,000 120,000
800,000 800,000
100,000 100,000
80,000 600,000 80,000 600,000
60,000 60,000
400,000 400,000
40,000 40,000
200,000 200,000
20,000 20,000
‐ ‐ ‐ ‐
2014 2015E 2016E 2017E 2018E 2019E 2020E
2000
2001
2002
2003
2004
2005
2006
2007
2008
2009
2010
2011
2012
2013
2014
2015
2016
Global Installations Implied Polysilicon Consumption
2008 Estimates (Photon) Actual MW
Implied Silicon Consumption
Actual Silicon (tons) 2012 Estimates MW
2012 Estimates Silicon (Tons)
Source: Credit Suisse, CRU, Photon Consulting, GTM Research, EPIA, HIS, GSM Analysis, and WSJ Source: GTM Research, GSM Analysis
Wafer Solar Solar
Silicon Polysilicon Solar Cell 29
Panel InstallationSilicon End Uses
Semiconductors
Silane gas is an essential material used in the production of semi‐conductors and LCD display panels
The three strongest demand areas for semiconductors will be NAND flash, logic application specific integrated circuits, and
microprocessors
– NAND and ASIC demand will be driven by media tablets and smartphones
– Microprocessor growth will be driven by demand for computers, tablets, and smart phone devices
$400 Semiconductor Revenue ($ in Bn)
$350
$300
$250
$200
2011 2012 2013 2014 2015 2016
Source: IHS
30Silicon End Uses
New Applications & Products
Example: Silicon Anode Lithium‐ion Battery
Greater energy storage capabilities
Allows for smaller sizes batteries for electronic devices and electric cars
Energy storage for renewable energy sources
31Silicon Alloys End Uses
Steel (Electrical Steel)
Technical expertise
Steel
Just‐in‐time delivery
Ferrosilicon Calcium Silicon
(FeSi) (CaSi)
Used in the manufacture
of high grade steel
Produces lump, powder
and cored wire forms
Commodity Specialty
Used in production High grade
of carbon steels, specifications
stainless steels and Requires technical
other steel alloys know‐how
Product/Market:
electrical steel and
motor laminates (auto)
32Silicon Alloys End Uses
Foundry Products
Foundry
Magnesium Ferrosilicon
(MgFeSi)
Ductile Iron Castings Ductile Iron Pipe
Used in applications Water transmission
where strength and
formability are required
‐ Automotive
components
33Manganese Alloys and FeSi at a Glance
Ferroalloys are an essential input for the steel industry
Total Ferroalloys Demand
Ferroalloys are alloys of iron Manganese
Surface critical flat steel Stainless steel, carbon
that contain a significant Ore products steel, and various other
amount of one or more >90% 90%Silica Fume End Markets
Construction, Oil & Gas, Refractory
Collected in bag houses – sold to concrete, oil well and refractory end markets
Key benefits of silica fume:
‐ Physical strength of concrete up to 20,000 psi
‐ Very low permeability to water and chloride intrusion of cement
‐ Extremely high electrical resistivity (up to 100x greater than ordinary concrete)
‐ Increased resistance to chemical attack from acids, nitrates and sulfates
New applications have significantly added to demand and increases in price
GSM’s Silica Fume Used in:
Infrastructure/public works Construction
Oil Wells Refractory
(Panama Canal Expansion) (One World Trade Center)
35You can also read