Neural Signatures of Memory Encoding in Schizophrenia Are Modulated by Antipsychotic Treatment
←
→
Page content transcription
If your browser does not render page correctly, please read the page content below

Research Article

                                                   Neuropsychobiology 2021;80:12–24                               Received: July 29, 2019
                                                                                                                  Accepted after revision: February 7, 2020
                                                   DOI: 10.1159/000506402                                         Published online: April 21, 2020

Neural Signatures of Memory Encoding
in Schizophrenia Are Modulated by
Antipsychotic Treatment
Demet Gurler a David Matthew White a Nina Vanessa Kraguljac a
Lawrence Ver Hoef b Clinton Martin a Blake Tennant a Adrienne Carol Lahti a
a Department of Psychiatry and Behavioral Neurobiology, University of Alabama at Birmingham, Birmingham, AL,
USA; b Department of Neurology, University of Alabama at Birmingham, Birmingham, AL, USA

Keywords                                                                response at baseline with subsequent increase following
Encoding · Retrieval · Hippocampus · Default mode                       treatment. Hippocampal Glx was not different between
network · Glutamate · Antipsychotic treatment · Functional              groups at baseline, but at week 6, hippocampal Glx was sig-
magnetic resonance imaging · Magnetic resonance                         nificantly lower in SZ compared to HC. Finally, in unmedi-
spectroscopy                                                            cated SZ, higher hippocampal Glx predicted less deactiva-
                                                                        tion of the BOLD response in regions of the DMN. Using 2
                                                                        brain imaging modalities allowed us to concurrently investi-
Abstract                                                                gate different mechanisms involved in memory encoding
There is no pharmacological treatment to remediate cogni-               dysfunction in SZ. Hippocampal pathology during memory
tive impairment in schizophrenia (SZ). It is imperative to              encoding stems from decreased hippocampal recruitment
characterize underlying pathologies of memory processing                and faulty deactivation of the DMN, and hippocampal re-
in order to effectively develop new treatments. In this longi-          cruitment during encoding can be modulated by antipsy-
tudinal study, we combined functional magnetic resonance                chotic treatment. High Glx in unmedicated patients predict-
imaging during a memory encoding task with proton MR                    ed less deactivation of the DMN; these results suggest a
spectroscopy to measure hippocampal glutamate + gluta-                  mechanism by which faulty DMN deactivation, a hallmark
mine (Glx). Seventeen SZ were scanned while unmedicated                 of pathological findings in SZ, is achieved.
and after 6 weeks of treatment with risperidone and com-                                                                        © 2020 S. Karger AG, Basel
pared to a group of matched healthy controls (HC) scanned
6 weeks apart. Unmedicated patients showed reduced blood
oxygen level dependent (BOLD) response in several regions,                  Introduction
including the hippocampus, and greater BOLD response in
regions of the default mode network (DMN) during correct                   Approximately 75–85% of schizophrenia (SZ) patients
memory encoding. Post hoc contrasts from significant group              show impairments in cognition with selective deficits in
by time interactions indicated reduced hippocampal BOLD                 learning and memory [1]. Importantly, impairments in

karger@karger.com     © 2020 S. Karger AG, Basel                        Adrienne C. Lahti, MD
www.karger.com/nps                                                      University of Alabama at Birmingham
                                                                        Sparks Center, Room 501
                                                                        1720 7th Ave. S, Birmingham, AL 35233 (USA)
                                                                        alahti @ uabmc.edu
episodic memory are not exclusively explained by overall       (posteromedial cortex) and the intrinsic functional con-
impairments in IQ or executive functioning [2]. Recently,      nectivity of the DMN. Two studies have now identified a
combination of brain imaging techniques has become a           relationship between anterior cingulate cortex glutamate
common practice in research to take advantage of cross-        and the BOLD response in the posterior DMN in healthy
information and improve upon identification of patho-          controls (HC), and this relationship was found to be op-
logical signatures of diseases [3]. Neural correlates of ep-   posite in SZ [33, 34]. There is a need to clarify the neuro-
isodic memory processing in patients with SZ can be            chemistry of DMN hyperactivation in SZ.
studied using appropriate behavioral paradigms along               The vast majority of imaging studies of memory func-
with functional magnetic resonance imaging (fMRI) [4,          tion have enrolled medicated SZ; however, it has been
5]. Proton magnetic resonance spectroscopy (MRS) al-           shown that antipsychotic medications have modulatory
lows for in vivo measurement of brain metabolites such         effects on brain function during rest [35, 36], and during
as glutamate, an amino acid involved in excitatory neuro-      cognitive tasks [37]. Therefore, it is unclear to what extent
transmission [6] and metabolism [7, 8]. Given the role of      these findings are related to antipsychotic treatment rath-
glutamate as the main excitatory neurotransmitter in-          er than intrinsic characteristics of the illness. In addition,
volved in cognition [9] and the role of the hippocampus        although the critical role of antipsychotic medications for
in learning and memory processes, measurement of glu-          symptom relief, such as hallucinations or delusions, is
tamate in the hippocampus could provide insights into          well established, their benefits on cognitive functions are
the pathology of learning and memory impairments in            more controversial [38]. However, studies that included
SZ. Importantly, several groups have now reported ele-         large numbers of subjects such as CATIE [39] and
vated levels of glutamate in medication-naïve or unmed-        EUFEST [40] have shown that treatment with a wide va-
icated SZ in different brain regions [10, 11], including in    riety of both first- and second-generation antipsychotics
the hippocampus [12].                                          is associated with moderate improvements on cognitive
   Cumulative evidence indicates that memory deficits in       tests. Relevant to our aims, recent studies have reported
SZ might be related to impairments in intentional encod-       that antipsychotic medications decrease glutamate levels
ing [13, 14]. Previous studies have shown a positive rela-     [41–43].
tionship between encoding success and hippocampus                  The purpose of the current study was to examine en-
blood oxygen level dependent (BOLD) response, point-           coding-related BOLD response and resting state hippo-
ing to the role of the hippocampus in the integration of       campal glutamate levels in SZ using a longitudinal design
information from different cortical regions [15–17]. It        (before, while unmedicated, and after 6 weeks of antipsy-
has been shown that hippocampus and parahippocampal            chotic treatment) to compare HC and SZ response with-
gyrus activation during encoding is predictive of subse-       out the effect of medication as a confounding factor and
quent retrieval success [18, 19]. Several neuroimaging         investigate the effect of medication on brain responses in
studies reported BOLD signal abnormalities in the hip-         SZ. We hypothesized that in SZ we would replicate find-
pocampus and parahippocampal gyrus both in SZ [20]             ings of reduced BOLD response in regions previously
and in unaffected relatives [21–24]. However, these stud-      found associated with memory processing, and increased
ies have produced discrepant findings, demonstrating           BOLD response in regions of the DMN, as well as chang-
both increased and decreased BOLD response in SZ dur-          es as a result of treatment. Based on prior findings, we
ing memory tasks [25].                                         hypothesized that hippocampal glutamate levels would
   Suppression of default mode network (DMN) regions           be elevated before and reduced after treatment. In addi-
during memory encoding plays an important role in              tion, we explored the relationship between hippocampal
achieving optimum memory performance [26]. The                 glutamate and BOLD response in the DMN before and
DMN is suppressed during cognitive demands but en-             after treatment.
gaged during rest [27]. In SZ, hyperactivation of DMN
during cognitive tasks has been extensively reported [28,
29]. Consistent with the role of glutamate in neuroener-          Materials and Methods
getics [30], Hu et al. [31] reported a positive relationship
between high glutamate concentration in the posterior             Participants
                                                                  Subjects with SZ and schizoaffective disorder (SZ) were recruit-
DMN and reduced DMN deactivation during a working              ed from the outpatient psychiatry clinics and emergency room at
memory task. In addition, Kapogiannis et al. [32] identi-      the University of Alabama at Birmingham to participate in the
fied a relationship between posterior DMN glutamate            study based on being off antipsychotic medication for at least 10

Memory Encoding in SZ                                          Neuropsychobiology 2021;80:12–24                                13
                                                               DOI: 10.1159/000506402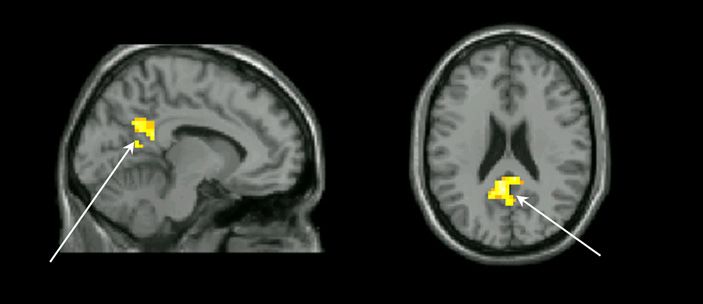
days (medication was not discontinued to meet this criteria).            echo time [TR/TE] 2,100/30 ms, flip angle = 70°, field of view =
Among them, 17 patients completed both encode and retrieval ses-         24 × 24 cm2, 64 × 64 matrix, 4 mm slice thickness, 1 mm gap, 26
sions of the memory paradigm at 2 time points (Baseline/unmed-           axial slices). A high-resolution structural scan was acquired using
icated and week 6). Seventeen HC subjects, without personal or           a T1-weighted magnetization prepared rapid acquisition gradient-
family history in a first-degree relative of significant DSM-IV-TR       echo sequence (TR/TE/inversion time 2,300/ 3.93/ 1,100 ms, flip
Axis I disorders were recruited using advertisement in flyers and        angle = 12°, 256 × 256 matrix, 1 mm isotropic voxels).
the university’s newspaper. Exclusion criteria were major medical            A series of sagittal, coronal, and axial T1-weighted anatomical
conditions, substance abuse or dependence (except for nicotine)          scans serving as MRS-localizers were acquired for spectroscopic
within 6 months of imaging, previous head injury with loss of con-       voxel placement. Slices were aligned to the anatomical midline to
sciousness for > 2 min, and pregnancy. The Institutional Review          control for head tilt. To facilitate voxel placement, the axial im-
Board of the University of Alabama at Birmingham provided ap-            ages were obtained along the long axis of the hippocampus, as
proval for the study, and all subjects gave written informed consent     viewed from the sagittal images. The voxel was placed in the left
prior to participating.                                                  hippocampus such that the amount of gray matter was maximized
    Diagnoses were established using subjects’ medical records and       (voxel size 2.7 × 1.5 × 1 cm3). Manual shimming was performed to
the Diagnostic Interview for Genetic Studies [44]. General cogni-        optimize field homogeneity across the voxel, and chemical shift
tive function for each subject was characterized by the Repeatable       selective pulses were used to suppress the water signal. Spectra
Battery for the Assessment of Neuropsychological Status [45].            were acquired using the point-resolved spectroscopy sequence
    Patients were scanned while unmedicated, and then entered            (TR/TE = 2,000/80 ms to optimize the glutamate signal [49] and
into a 6-week trial with risperidone (flexible dosing regimen), at       minimize macromolecule contribution; 1,200 Hz spectral band-
the end of which they received a second scan. Symptom severity           width; 1,024 points; 640 averages).
was assessed with the Brief Psychiatric Rating Scale [46] and its
positive and negative subscales. Medication compliance was mon-              Statistical Analyses
itored by pill counts. HC were scanned twice at a 6-week interval.           Behavior and Demographics
Prior to each scanning session, all subjects underwent a urine drug          Analyses were conducted using SPSS 20 (IBM SPSS Inc., Chi-
screen.                                                                  cago, IL, USA). Group comparisons were performed using chi-
                                                                         square or analysis of variance, as appropriate. Analyses of response
    Task Design and Behavioral Analysis                                  on encoding trials, reaction time (RT) for correct trials, percentage
    The episodic memory task (see in [4, 47] for details) consisted      of correctly encoded words, and d’ values were analyzed using lin-
of an intentional encoding phase, followed by a recognition mem-         ear mixed models comparing fixed effects of group (HC vs. SZ),
ory phase after a 15-min delay. To maximize retrieval perfor-            time (unmedicated vs. week 6), and interactions. Post hoc analyses
mance, a deep encoding paradigm utilizing an animacy decision            were performed where appropriate with Bonferroni corrections.
was used. During the encoding task, participants saw a series of 60
words, presented one at a time for 300 ms followed by a fixation             MRS Analysis
screen. A 2-s prestimulus cue (“Alive?”) indicated that the partici-         After removing the residual water peak, the MRS data were
pant had to answer by button press whether the upcoming word             quantified in the time domain using the AMARES algorithm [50]
was alive or not alive. Following a 15 min interval, participants        in jMRUI (version 3.0). Prior knowledge derived from in vitro and
performed the retrieval task, where they saw 60 words, including         in vivo metabolite spectra was included in the model [51], which
30 words previously seen (old words) and 30 new words, present-          consisted of peaks for N-acetyl-aspartate, choline, creatine (Cr),
ed one at a time for 300 ms. A 2-s warning stimulus (“Ready?”)           and 3 peaks for glutamate + glutamine (Glx). Amplitude, line
indicated that the participant had to answer by button press wheth-      width, and chemical shift were optimized for each peak. Cramer-
er the upcoming word was “old” or “new.” Depending on partici-           Rao lower bounds [52] were calculated for each peak. Exclusion
pants’ responses, these items were classified as hits, misses, correct   criteria were Cramer-Rao lower bounds >25%. No data were ex-
rejections, and false alarms. An IFIS-SA system (In Vivo Corp.,          cluded on the basis of these criteria. Glx were quantified with re-
Orlando, FL, USA) running E-Prime software (version 1.2; Psy-            spect to Cr. MRS data were missing for 1 SZ, both at baseline and
chology Software Tools, Inc., Pittsburgh, PA, USA) controlled            at week 6, and for 2 HC at baseline and 3 HC at week 6. Differ-
stimulus delivery and recorded responses and reaction times (RT).        ences between groups were tested using independent sample t test
    A word was considered encoded correctly if it was successfully       at baseline and at week 6. The alpha level was set at.05.
retrieved in the subsequent retrieval session. Task engagement was
calculated using button presses during encoding trials. We used              fMRI Analysis
d-prime (d’), calculated based on the information during retrieval           Data analyses were implemented in SPM12 running in MAT-
sessions, as the primary memory performance measure. d’ is a             LAB (version R2013b). Preprocessing of the fMRI data included
measure of sensitivity by calculating the distance between signal        slice timing correction, realignment and reslicing to the mean
and noise in standard deviation units (d’ = z[HITS] – z[FALSE            functional volume, artifact/motion correction (movement > 1
ALARMS]) [48].                                                           mm) using ArtRepair, coregistration to the structural scan, and
                                                                         normalization to Montreal Neurological Institute (MNI) space us-
    Imaging Parameters                                                   ing DARTEL [53] with 6-mm FWHM Gaussian kernel smoothing.
    All imaging data were acquired on a 3T head-only scanner (Sie-       Participants were excluded from further analyses if 33% or more
mens Allegra, Erlangen, Germany), equipped with a circularly po-         of their data were repaired during artifact and motion correction.
larized transmit/receive head coil. fMRI data were acquired using            The subject-level statistical analysis consisted of an event-relat-
a gradient recalled echo-planar imaging sequence (repetition time/       ed GLM with the following regressors: encode main effect, encode

14                      Neuropsychobiology 2021;80:12–24                                         Gurler/White/Kraguljac/Ver Hoef/
                        DOI: 10.1159/000506402                                                   Martin/Tennant/Lahti
Table 1. Demographics and clinical variables the extracted first eigenvariate signal was then plotted at each time
point and for each group. In addition, to explore the relationship
Characteristics HC (n = 17) SZ (n = 17) p value between regions where significant group × time interactions were
identified and memory performance, the extracted first eigenvari-
Age, years 31.77 (8.6) 31.24 (8.96) 0.861 ate was plotted against each participant’s associated d’ prime value.
Gender, male, % 71 82 0.409* To explore the relationship between DMN BOLD and hippo-
SESa 6.00 (4.55) 8.42 (5.55) 0.692* campal Glx, the first eigenvariate of the “encode correct” contrast
Smokingb 0.32 (.51) 0.63 (.48) 0.08 in the DMN ROI was extracted using REX, and we performed a
RBANS totalc 91.29 (10.49) 71.71 (12.08) 0.000 bivariate correlation between the extracted data and hippocampal
BPRS totald NA 48 (10.84) NA Glx measures using SPSS. The relationships between Glx and
BPRS positive NA 9 (2.03) NA BOLD were analyzed by Pearson correlation and were compared
BPRS negative NA 7.24 (2.43) NA using Fisher’s r to Z transform.
Values are presented as mean (SD).
a SES, ranks determined from diagnostic Interview for Genetic Results
Studies (1–18 scale); higher rank (lower numerical value) corre-
sponds to higher socioeconomic status. b Calculated using esti-
mates based on packs per day. c Repeatable Battery for the RBANS; Behavior and Hippocampal Glutamate
d
BPRS, scored on a 1–7 scale; positive subscale (conceptual disor- The groups were well matched in terms of age, gender,
ganization, hallucinatory behavior, and unusual thought content); parental socioeconomic status, and smoking (Table 1).
negative subscale (emotional withdrawal, motor retardation, and Both HC and SZ responded on most encoding trials
blunted affect). p values based on independent sample t test.
* Based on chi-square test. without significant differences between groups (F1, 32 =
HC, healthy control; SZ, patient with schizophrenia; SES, so- 2.778; p = 0.105), time (F1, 32 = 0.001; p = 0.98), or group-
cioeconomic status; RBANS, Assessment of Neuropsychological by-time interaction (F1, 32 = 0.001; p = 0.98). Mean RTs
Status; BPRS, Brief Psychiatric Rating Scale; NA, not applicable. were longer for SZ compared to HC (HC, 1,100 ms; SZ,
1,459 ms; F1, 29 = 11.141; p = 0.002) but a significant effect
of time, or group-by-time interaction (HC baseline, 1,103
ms, week 6, 1,096 ms; SZ baseline, 1,530 ms, week 6, 1,389
correct, and encode incorrect trials. A word was considered cor- ms; F1, 29 = 2.294; p = 0.141), was not observed. There was
rectly encoded if it was successfully retrieved in the subsequent a significant difference between groups in the percentage
retrieval session. All events were modeled using a canonical hemo-
dynamic response function, and data were high-pass filtered (cut- of correctly encoded words (HC, 85%; SZ, 67%; F1, 32 =
off = 256 s). At the group level, statistical parametric maps of the 11.141; p = 0.002) without any significant difference in
BOLD signal during encoding were generated, and comparisons time, or group-by-time interaction (HC baseline, 86%,
between groups were conducted using 2-sample t tests. For mul- week 6, 84%; SZ baseline, 66%, week 6, 67%; F1, 32 = 0.306;
tiple comparison correction, the cluster size threshold was defined p = 0.584).
within SPM12, based on Gaussian random field theory, as the
number of contiguous voxels with p < 0.05 (uncorrected) in order Comparison of d’ values across group and time re-
to accept the false discovery rate of 0.05 [54]. vealed significant main effects for group (HC, 2.1; SZ,
To identify differences between groups specific to the DMN, we 1.44; F1, 32 = 7.02; p = 0.012) but not time, or group-by-
built a combined region of interest (ROI), inclusive of the medial time interaction (HC baseline, 2.14, week 6, 2.07; SZ base-
frontal gyrus, posterior cingulate gyrus, precuneus, hippocampi, line, 1.43, week 6, 1.44; F1, 32 = 0.152; p = 0.699).
and inferior parietal gyri, using automated anatomical labeling at-
las within the Wake Forest University Pick Atlas version 2.4 [55]. Hippocampal Glx levels did not significantly differ be-
The anatomical correlates of the DMN mask were based on Buck- tween groups at baseline, but at week 6, HC hippocampal
ner et al. [56]. Small-volume correction p < 0.05 was used to correct Glx levels were significantly higher than SZ (baseline, t =
for multiple comparisons. 0.425, nHC = 15, nSZ = 16, p = 0.675; week 6, z = 2.46,
To evaluate the effect of medication, we conducted a full facto- nHC = 14, nSZ = 16, p = 0.02).
rial analysis, identifying brain regions sensitive to the interaction
of group × time during encode correct trials. The subject- and pa-
rameter estimates of encode correct trials were entered into a ran- fMRI Results
dom effect analysis using SPM’s “full factorial model.” Factors Baseline Comparisons and Effects of Medication
were time (baseline/unmedicated, week 6) and group (HC, SZ). Whole brain analyses demonstrated that both HC and
For this whole brain analysis, the cluster size threshold for multiple
SZ displayed significant BOLD response bilaterally in the
comparisons was defined by Monte Carlo simulations using a vox-
el level threshold at p = 0.05 with 1,000 simulations. For illustration insula, dorsal and ventral prefrontal and parietal cortices,
purposes, the signal was extracted from significant regions using superior and middle temporal cortex, thalamus and puta-
REX (CIBSR Stanford University, CA, USA) with a 6 mm ROI, and men during encode correct trials. Compared to HC,
Memory Encoding in SZ Neuropsychobiology 2021;80:12–24 15
DOI: 10.1159/000506402a
Color version available online
z = –20 z = –2 z = 10
Hippocampus Insula Rolandic operculum Superior temporal
b
x = –8 z = 24
Fig. 1. Unmedicated baseline between-
group differences during memory encod-
ing. a Whole brain analysis: brain regions
significantly more activated in HCs com-
pared with unmedicated patients with
SZ during correct memory encoding
(pFDR < 0.05). x, y, z refer to MNI space.
b Using a DMN mask, greater BOLD re-
sponse in the precuneus and the posterior
cingulate were observed in SZ compared to
HC. Analysis corrected using small-vol- Posterior cingulate/precuneus Posterior cingulate
ume correction of p < 0.05).
Table 2. Reduced BOLD response in unmedicated patients with SZ compared to controls
Cluster Hema Voxels z value MNI coordinatesb Locationc
x y z
1 R 113 3.42 57 –15 12 Rolandic operculum
148 3.29 39 –3 0 Insula
83 3.26 63 –27 24 Supramarginal
60 3.1 51 9 3 Frontal inferior
37 3.1 63 –9 18 Postcentral
21 2.99 51 –6 6 Heschl
12 2.64 48 0 –30 Temporal middle
15 2.53 51 –6 3 Temporal superior
17 2.36 30 –9 –21 Hippocampus
6 2 36 0 –24 Amygdala
8 1.99 33 6 –24 Temporal pole superior
Cluster level FDR of 0.05 was used to control for multiple comparisons.
a
Hem, hemisphere; R, right. b Reported in MNI coordinates (x, y, and z). c Spatial localization of significant
activation was defined using AAL.
BOLD, blood oxygen level dependent; SZ, schizophrenia; MNI, Montreal Neurological Institute; FDR, false
discovery rate; AAL, automated anatomical labeling.
umedicated SZ revealed reduced BOLD response in the level MNI coordinates: x = 0, y = –63, z = 27, z = 3.07) and
right insula, hippocampus, inferior frontal, and temporal the posterior cingulate (peak voxel-level MNI coordi-
cortex (Table 2, Fig. 1a). Using a DMN mask, greater nates x = –3, y = –51, z = 24, z = 2.89) were observed in
BOLD responses (Fig. 1b) in the precuneus (peak voxel- SZ compared to HC.
16 Neuropsychobiology 2021;80:12–24 Gurler/White/Kraguljac/Ver Hoef/
DOI: 10.1159/000506402 Martin/Tennant/LahtiColor version available online
y = –14 y = –8
Fig. 2. Effects of antipsychotic medication
on patterns of activation during memory
encoding. A full factorial analysis revealed
significant group × time interactions dur-
ing encoding in the temporal and insu-
la cortex (a), and in the parahippocam- Superior temporal cortex Hippocampus
pus, hippocampus, and amygdala (b;
pFDR < 0.05). x, y, z refer to MNI space. a b
Table 3. BOLD response: significant group × time interactions
Cluster Hema Voxels z value MNI coordinatesb Location
x y z
1 L 137 3.59 –48 –18 –3 Temporal superior
2.65 –54 –21 –6 Temporal middle
2.2 –36 –12 6 Insula
2.18 –48 –15 9 Heschl
2 R 128 3.02 18 –6 –21 Parahippocampal
2.98 36 –6 –24 Hippocampus
2.59 33 0 –21 Amygdala
2.33 57 0 –21 Temporal middle
Correction for multiple comparisons were defined by Monte Carlo simulations using a voxel level threshold
at p = 0.05 with 1,000 simulations.
a
Hem, hemisphere; R, right; L, left. b Reported in MNI coordinates (x, y, and z). c Spatial localization of
significant activation was defined using AAL.
BOLD, blood oxygen level dependent; MNI, Montreal Neurological Institute; AAL, automated anatomical
labeling.
A full-factorial analysis revealed significant group × The correlation analysis between activation in these re-
time interaction in the left hemisphere in the superior and gions and d′ was significantly different between HC and
middle temporal cortex, Heschl’s gyrus and insula; in the SZ at baseline but not at week 6 in the amygdala (baseline,
right hemisphere, in the parahippocampal gyrus, hippo- z = 1.75, nHC = 17, nSZ = 17, p = 0.04; week 6, z = –1.36,
campus, amygdala, and middle temporal cortex (Table 3, nHC = 17, nSZ = 17, p = 0.1), and, at a trend level, in
Fig. 2). In those regions, post hoc contrasts revealed re- the parahippocampal gyrus (baseline, z = 1.54, nHC = 17,
duced BOLD response at baseline and subsequent in- nSZ = 17, p = 0.06; week 6, z = –0.43, nHC = 17, nSZ = 17,
crease at week 6 in SZ (Fig. 3a). p = 0.33; Fig. 3b).
To examine if these patterns impacted performance,
we explored the relationship between regions where sig- Relationship between Glutamate and the BOLD
nificant group × time interactions were identified and Signal
memory performance. In HC, but not in SZ, more activa- To explore the relationship between hippocampal
tion in these regions was linked to better performance. Glx and DMN BOLD response, we conducted a correla-
Memory Encoding in SZ Neuropsychobiology 2021;80:12–24 17
DOI: 10.1159/000506402Color version available online
HC HC HC HC
2 2
1.0 SZ SZ SZ SZ
Amygdala BOLD baseline
Amygdala BOLD week 6
1 1
0.5
Amygdala BOLD
0 0
0
–1 –1
–0.5
–2 –2
–1.0
HC HC SZ SZ 0 1 2 3 4 0 1 2 3 4
baseline week 6 baseline week 6
dʹ prime baseline dʹ prime week 6
2 HC HC 2 HC HC
Parahippocampus BOLD baseline
Parahippocampus BOLD baseline
1.0 SZ SZ SZ SZ
Parahippocampus BOLD
1 1
0.5 0 0
–1 –1
0
–2 –2
–3 –3
–0.5
HC HC SZ SZ 0 1 2 3 4 0 1 2 3 4
a baseline week 6 baseline week 6 b dʹ prime baseline dʹ prime week 6
Fig. 3. a In regions where a significant group × time interaction nificantly different between the groups at baseline but not at week
was identified, post hoc contrasts revealed reduced BOLD re- 6 in the amygdala, and, at a trend level, in the parahippocampus
sponse at baseline, and subsequent increase after 6 weeks in pa- gyrus. BOLD, blood oxygen level dependent; HC, healthy controls;
tients with SZ. b Correlations between BOLD response in these SZ, schizophrenia.
regions and memory performance using d-prime (d′) were sig-
tion analysis between these variables. At baseline, in SZ Discussion
but not in HC, there was a significant correlation be-
tween hippocampal Glx and BOLD response measured To our knowledge, this is the first study utilizing a lon-
in the region of the posterior DMN where SZ showed gitudinal design together with a control group to evaluate
increased activation (r = 0.49, n = 16, p = 0.03). The re- the BOLD response during memory encoding and its re-
lationship between the BOLD signal in the regions of lationships with hippocampal glutamate in patients with
the DMN (using the full DMN mask) and hippocampal SZ before (unmedicated) and after a 6-week course of
Glx was significantly different between groups (z = treatment with risperidone. Our findings are: (1) In un-
–1.62, nHC = 15, nSZ = 16, p = 0.05) at baseline (Fig. 4). medicated patients, presence of a reduced BOLD re-
Thus in these regions, higher glutamate levels were re- sponse in several regions, including in the hippocampus,
lated to increased activation of the DMN in SZ. At week and greater BOLD response in regions of the DMN dur-
6, the correlation between hippocampal Glx levels and ing correct memory encoding; (2) a significant BOLD re-
DMN was not significant and was not significantly dif- sponse group by time interaction in temporal cortex, bi-
ferent from HC (z = –0.19, nHC = 14, nSZ = 16, p = 0.42; laterally, including in the right hippocampus; but not in
Fig. 4). regions of the DMN; and (3) an abnormal BOLD mod
ulation of the hippocampus at baseline that appears to
18 Neuropsychobiology 2021;80:12–24 Gurler/White/Kraguljac/Ver Hoef/
DOI: 10.1159/000506402 Martin/Tennant/LahtiColor version available online
Baseline Week 6
1 HC 0.9 HC
SZ SZ
HC HC
SZ 0.8 SZ
0.8
Hippocampus Glx
Hippocampus Glx
0.7
Fig. 4. Correlations between hippocampal 0.6 0.6
Glx and BOLD response in regions of the
DMN (using the full DMN mask). This re- 0.5
0.4
lationship was significantly different be-
tween groups at baseline, but not after week 0.4
6. Glx, glutamate + glutamine; DMN, de-
–3 –2 –1 0 1 2 3 –3 –2 –1 0 1 2
fault mode network; BOLD, blood oxygen-
DMN BOLD DMN BOLD
level dependent; HC, healthy controls; SZ,
schizophrenia.
normalize at week 6; in addition, we found significant quent retrieval success [18, 19]. In a group of unmedi-
group differences in the relationship between hippocam- cated patients overlapping with the present group, we re-
pal BOLD and performance at baseline, but not at week 6. ported significant functional dysconnectivity between the
(4) Hippocampal Glx was not significantly different be- hippocampus and other cortical regions during a resting
tween the groups at baseline, but at week 6, hippocampal state [69], as well as abnormal effective connectivity, mea-
Glx was significantly lower in SZ compared to HC; (5) at sured using Granger causality methods, between bilateral
baseline, higher hippocampal Glx predicted greater acti- hippocampi and prefrontal regions during a memory re-
vation (or less deactivation) of the BOLD response in re- trieval task [4].
gions of the DMN in SZ, but not in HC; there were no Abnormal BOLD response in the frontal and other
group differences in this relationship at week 6. temporal regions in SZ compared to HC has also been
reported [64, 65]. At baseline, greater DMN BOLD re-
Unmedicated Patterns and Effect of Medications on sponse was observed in SZ compared to HC in the poste-
BOLD rior cingulate cortex and the precuneus. Our results are
Hippocampal functioning in SZ has been investigated consistent with previous findings of DMN hyper-activa-
using various imaging techniques, such as PET, SPECT, tion in SZ across a variety of cognitive tasks [70–73].
arterial spin labeling, and fMRI. Abnormalities in region- We identified a significant BOLD response group by
al cerebral blood flow [57–59], volume [60–63], and time interaction in a region encompassing the hippocam-
BOLD signal [64, 65] have been consistently reported. pus, parahippocampus, and amygdala; in those regions,
Given that the majority of studies enrolled medicated pa- post hoc contrasts reveal reduced BOLD response at base-
tients, it was important to evaluate unmedicated subjects. line with subsequent increase at week 6, suggestive of a
Here in a group of unmedicated patients, we observe hy- normalized pattern with treatment. In addition, further
poactivation of the hippocampus during correct memory suggestive of a drug effect in this region, the relationship
encoding and a correlation between hippocampal BOLD between the BOLD response and performance was no
and performance that was significantly different than in longer significantly different than that of HC, like it was
HC. These results are consistent with a majority of studies at baseline. These results are consistent with those of a
reporting decreased hippocampal recruitment during previous PET study where we demonstrated a significant
memory performance in SZ [65–67], including in first modulation of hippocampal regional cerebral blood flow
episode psychosis [68]. This dysfunction has also been by antipsychotic treatment during a resting state and dur-
identified in healthy siblings [23, 24], suggesting it is a ing task performance [58]. In addition, after 1 week of
heritable trait and a good candidate for intermediate phe- antipsychotic treatment, we reported a normalization of
notype. Our results in HC are also consistent with other the abnormal effective connectivity between hippocampi
studies showing that hippocampus and parahippocam- and prefrontal regions seen when patients were unmedi-
pus activation during encoding is predictive of subse- cated [4].
Memory Encoding in SZ Neuropsychobiology 2021;80:12–24 19
DOI: 10.1159/000506402Despite observing a modulation of the BOLD response lowing 4 weeks of treatment with a variety of antipsy-
in the hippocampus, we did not observe significant im- chotic medications [43]. In medication-naïve/minimally
provements in memory scores over time in patients. Oth- treated first episode psychosis patients, Egerton et al. [41]
ers have reported an improvement of both BOLD re- reported a reduction in anterior cingulate cortex gluta-
sponse and cognition with antipsychotic medication. mate after 4 weeks of treatment with amisulpride. In
During a cognitive control task, medicated patients dem- medication-naïve first episode psychosis subjects com-
onstrated higher dorsolateral prefrontal cortex activation pared to HC, de la Fuentes-Sandoval et al. [42] observed
as well as better behavioral performance compared to un- higher baseline striatal glutamate and a significant reduc-
medicated patients [74]. Although in our study the time tion in striatal glutamate after 4 weeks of risperidone
by group interaction did not suggest an effect of medica- treatment. There are thus strong indications that gluta-
tion in regions of the DMN, in a longitudinal study, 8 mate levels are modulated by antipsychotic medications.
weeks of antipsychotic treatment was found to improve We acknowledge that the size of our sample was limited
behavioral performance and modulate the functional con- and that there is a need to address these questions with
nectivity of the DMN in SZ during a working memory task larger sample size.
[75]. It will be important to establish whether the changes
observed in this study are associated with improvement in Glutamate/BOLD Signal
memory processes, as they could provide biomarkers po- At baseline, higher Glx predicted less deactivation of
tentially leading to the identification of novel agents for the BOLD response in regions of the DMN in SZ, but not
the treatment of memory impairments in SZ. in HC; this relationship was not present at week 6. In HC,
How can antipsychotic drugs improve hippocampal Hu et al. [31] reported a positive relationship between
function? Atypical antipsychotic medications have been high glutamate concentration in the posterior DMN and
found to increase levels of synaptic proteins and promote reduced DMN deactivation during a working memory
dendritic growth [76]. One of these proteins, brain-de- task. Also in HC, Kapogiannis found a relationship be-
rived neurotrophic factor (BDNF) which is stored and tween posterior DMN glutamate (posteromedial cortex)
released by glutamatergic neurons, is an important regu- and intrinsic functional connectivity of the DMN [32].
lator of synaptic transmission. BDNF is also essential to Here, we found a correlation between hippocampal Glx
synaptic plasticity and helps protect against apoptosis and BOLD response in region of the DMN, a region out-
[77, 78]. Further evidence demonstrates that BDNF is as- side that of which Glx is measured. While local neuro-
sociated with increases in spine density levels [79]. A large chemical concentrations are bound to affect local neural
meta-analysis that included over 7,000 subjects by Fer- activity, it can also be argued that they are likely to con-
nandes et al. [80] shows that SZ is associated with lower tribute to the activity of distant projections areas; this
levels of BDNF and that these levels increased with anti- likely involves complex synaptic transmission. There
psychotic treatment. There is evidence that atypical anti- now have been a number of studies demonstrating cor-
psychotics in particular help reverse, or at least alleviate, relations between glutamate and the BOLD signal in re-
dendritic apoptosis of the outer layers of the cortex [81]. gions distant from where glutamate was measured [33,
47, 82–84]. Because higher glutamate levels have been
Glutamate consistently found in medication-naïve or unmedicated
At baseline, there was no significant group difference SZ [10–12], one could speculate that higher Glx levels in
in Glx levels. We previously demonstrated elevated hip- unmedicated patients represent a pathological state alter-
pocampal Glx levels in a group of 27 unmedicated pa- ing the local ratio of excitation over inhibition and the
tients compared to a matched group of HC [12]. It is thus tuning of neuronal projections with significant effects on
possible that our study was underpowered to show a the BOLD signal in projection areas. Intriguingly, similar
group difference. After 6 weeks of treatment, we observed to prior studies [82, 85], the abnormal association be-
significantly lower hippocampal Glx in medicated pa- tween BOLD response and Glx in SZ was observed in the
tients compared to HC, but not compared to their un- posterior DMN. The posterior DMN have been consis-
medicated baseline. There are a limited number of longi- tently associated with successful recollection [97]; in ad-
tudinal studies evaluating the effect of short-term anti- dition, it is a major hub region that is densely intercon-
psychotic treatment on glutamatergic metabolites. In nected with other hub regions, together forming a rich
chronic patients who had undergone a medication wash- club [86]. At week 6, in the face of lower Glx levels in SZ,
out, Szulc reported a decrease in temporal lobe Glx fol- this association was not significant anymore.
20 Neuropsychobiology 2021;80:12–24 Gurler/White/Kraguljac/Ver Hoef/
DOI: 10.1159/000506402 Martin/Tennant/LahtiStrengths and Limitations Conclusions
To avoid confounding medication effects and mini-
mize data variance, we only enrolled unmedicated SZ, Cognition is impaired in SZ, and to this day there is no
matched groups on several key factors, and used a rigor- pharmacological treatment to remediate it. It is impera-
ous longitudinal design with a single antipsychotic medi- tive to characterize specific underlying pathologies of
cation. Also, we attempted to control for the effect of time memory processing in the illness in order to effectively
by scanning a HC group 6 weeks apart. First, we acknowl- develop new treatment. Using 2 brain imaging modalities
edge our modest sample size; clearly replication studies allowed us to concurrently investigate different putative
will be important. This combined MRS-fMRI study ob- mechanisms involved in memory encoding dysfunction
tained neurometabolite levels that, given the spectrosco- in SZ. We confirmed that hippocampal pathology during
py sequence in the 3T MRI scanner, were unable to dis- memory encoding stems from decreased hippocampal re-
tinguish the overlapping glutamate, glutamine, and cruitment and faulty deactivation of the DMN and that
GABA peaks from each other. As studies have shown dif- hippocampal recruitment during memory encoding is
ferences in these metabolites in SZ [87, 88], future studies modulated by antipsychotic treatment with subsequent
should attempt to obtain spectroscopy data from MRI normalization of the relationship between BOLD and task
scanners that are able to separate these metabolites. For performance. Finally, we showed that high Glx in unmed-
fMRI analyses, we defined the DMN anatomically based icated patients predicts less deactivation of the DMN;
on the automated anatomical labeling atlas within the these results which need to be replicated with larger groups
Wake Forrest University Pickatlas, an automated method suggest a mechanism by which faulty DMN deactivation,
for neuroanatomic and cytoarchitectonic depiction of a hallmark of pathological findings in SZ, is achieved.
brain areas. The ROI was based on functional studies as
proposed by Buckner et al. [56]. Various methods have Acknowledgments
been used to define the DMN in fMRI studies. For ex-
ample, Keerativittayayut et al. [89] used both ROIs from This work was supported by NIMH grants R01 MH 081014 and
well-established memory-related brain regions from a 102951 (A.C.L.). The funding sources had no role in the study de-
sign, data collection, data analysis, manuscript preparation, or de-
meta-analysis and 224 ROIs across the whole brain de- cision to publish.
rived from a functional atlas [90]. Chai et al. [91] used 4
DMN seeds created around coordinates from the litera-
ture [92] to perform a group level map and identify the Statement of Ethics
peaks of the group level. Perrone-Bertolotti et al. [93] This research complies with the guidelines for human studies
used ROI analysis using a priori ROI masks for 3 DMN and was conducted in accordance with the World Medical Asso-
regions as proposed by [92]. Sneve et al. [94] used the Yeo ciation Declaration of Helsinki.
et al. [95] cortical parcellation to define 17 bilateral net-
works. The only study that used independent compo-
Disclosure Statements
nents analysis to highlight large-scale brain networks is
the study of Santangelo et al. [96]. As can be seen, various The authors have no conflicts of interest to declare.
methods have been used, and no consensus has emerged
as to which method is the best. Furthermore, we per-
Funding Sources
formed analyses in MNI space and used DARTEL for
more accurate intersubject alignment of brain images This work was supported by NIMH grants R01 MH 081014 and
[53], but this technique does not fully account for possible 102951 (A.C.L.). The funding sources had no role in the study de-
individual variations in gray matter that could have af- sign, data collection, data analysis, manuscript preparation, or de-
cision to publish.
fected results. Spectroscopy was done during a resting
state, thus the correlations with the BOLD signal obtained
during task cannot be interpreted as being causal. Further Author Contributions
studies combining fMRI with functional MRS, where
changes in neurometabolites are measured during task A.C.L. designed the study and oversaw all aspects of the proto-
col. D.G. and D.M.W. undertook the data analysis. All authors
performance, might provide a more fine-grained under- contributed to interpretation of data. D.G. wrote the first draft of
standing of the link between metabolites and cognitive the manuscript. All authors contributed to and have approved the
processes. final manuscript.
Memory Encoding in SZ Neuropsychobiology 2021;80:12–24 21
DOI: 10.1159/000506402References
1 Saykin AJ, Gur RC, Gur RE, Mozley PD, 14 Cirillo MA, Seidman LJ. Verbal declarative 27 Raichle ME. The brain’s default mode net-
Mozley LH, Resnick SM, et al. Neuropsycho- memory dysfunction in schizophrenia: from work. Annu Rev Neurosci. 2015 Jul; 38(1):
logical function in schizophrenia. Selective clinical assessment to genetics and brain 433–47.
impairment in memory and learning. Arch mechanisms. Neuropsychol Rev. 2003 Jun; 28 Anticevic A, Repovs G, Barch DM. Work-
Gen Psychiatry. 1991 Jul;48(7):618–24. 13(2):43–77. ing memory encoding and maintenance defi-
2 Kopald BE, Mirra KM, Egan MF, Weinberger 15 Preston AR, Eichenbaum H. Interplay of hip- cits in schizophrenia: neural evidence for ac-
DR, Goldberg TE. Magnitude of impact of ex- pocampus and prefrontal cortex in memory. tivation and deactivation abnormalities.
ecutive functioning and IQ on episodic mem- Curr Biol. 2013 Sep;23(17):R764–73. Schizophr Bull. 2013 Jan;39(1):168–78.
ory in Schizophrenia. Biol Psychiatry. 2012 16 Preston AR, Shohamy D, Tamminga CA, Wag- 29 Whitfield-Gabrieli S, Thermenos HW, Mila-
Mar;71(6):545–51. ner AD. Hippocampal function, declarative novic S, Tsuang MT, Faraone SV, McCarley
3 Sui J, Yu Q, He H, Pearlson GD, Calhoun VD. memory, and schizophrenia: anatomic and RW, et al. Hyperactivity and hyperconnectiv-
A selective review of multimodal fusion functional neuroimaging considerations. Curr ity of the default network in schizophrenia
methods in schizophrenia. Front Hum Neu- Neurol Neurosci Rep. 2005 Jul;5(4):249–56. and in first-degree relatives of persons with
rosci. 2012 Feb;6:27. 17 Shohamy D, Wagner AD. Integrating memo- schizophrenia. Proc Natl Acad Sci USA. 2009
4 Hutcheson NL, Sreenivasan KR, Deshpande ries in the human brain: hippocampal-mid- Jan;106(4):1279–84.
G, Reid MA, Hadley J, White DM, et al. Effec- brain encoding of overlapping events. Neu- 30 Shulman RG, Rothman DL, Behar KL, Hyder
tive connectivity during episodic memory re- ron. 2008 Oct;60(2):378–89. F. Energetic basis of brain activity: implica-
trieval in schizophrenia participants before 18 Brewer JB, Zhao Z, Desmond JE, Glover GH, tions for neuroimaging. Trends Neurosci.
and after antipsychotic medication. Hum Gabrieli JD. Making memories: brain activity 2004 Aug;27(8):489–95.
Brain Mapp. 2015 Apr;36(4):1442–57. that predicts how well visual experience will 31 Hu Y, Chen X, Gu H, Yang Y. Resting-state glu-
5 Ragland JD, Gur RC, Valdez J, Turetsky BI, be remembered. Science. 1998 Aug;281(5380): tamate and GABA concentrations predict task-
Elliott M, Kohler C, et al. Event-related fMRI 1185–7. induced deactivation in the default mode net-
of frontotemporal activity during word en- 19 Jackson O 3rd, Schacter DL. Encoding activ- work. J Neurosci. 2013 Nov;33(47):18566–73.
coding and recognition in schizophrenia. Am ity in anterior medial temporal lobe supports 32 Kapogiannis D, Reiter DA, Willette AA,
J Psychiatry. 2004 Jun;161(6):1004–15. subsequent associative recognition. Neuro- Mattson MP. Posteromedial cortex glutamate
6 Petroff OA. GABA and glutamate in the hu- image. 2004 Jan;21(1):456–62. and GABA predict intrinsic functional con-
man brain. Neuroscientist. 2002 Dec; 8(6): 20 Jessen F, Scheef L, Germeshausen L, Tawo Y, nectivity of the default mode network. Neuro-
562–73. Kockler M, Kuhn KU, et al. Reduced hippo- image. 2013 Jan;64:112–9.
7 Magistretti PJ, Pellerin L. Cellular mecha- campal activation during encoding and rec- 33 Falkenberg LE, Westerhausen R, Craven AR,
nisms of brain energy metabolism. Relevance ognition of words in schizophrenia patients. Johnsen E, Kroken RA, L Berg EM, et al. Im-
to functional brain imaging and to neurode- Am J Psychiatry. 2003 Jul;160(7):1305–12. pact of glutamate levels on neuronal response
generative disorders. Ann N Y Acad Sci. 1996 21 Achim AM, Bertrand MC, Sutton H, Mon- and cognitive abilities in schizophrenia. Neu-
Jan;777(1):380–7. toya A, Czechowska Y, Malla AK, et al. Selec- roimage Clin. 2014 Apr;4:576–84.
8 Moffett JR, Ross B, Arun P, Madhavarao CN, tive abnormal modulation of hippocampal 34 Overbeek G. Relationship between glutamate
Namboodiri AM. N-Acetylaspartate in the activity during memory formation in first-ep- and BOLD Stroop effect in First-Episode
CNS: from neurodiagnostics to neurobiology. isode psychosis. Arch Gen Psychiatry. 2007 schizophrenia. Manuscript Submitted 2018.
Prog Neurobiol. 2007 Feb;81(2):89–131. Sep;64(9):999–1014. 35 Lahti AC, Weiler MA, Holcomb HH, Tam-
9 Robbins TW, Murphy ER. Behavioural phar- 22 Goldberg TE, Torrey EF, Gold JM, Bigelow minga CA, Cropsey KL. Modulation of limbic
macology: 40+ years of progress, with a focus LB, Ragland RD, Taylor E, et al. Genetic risk circuitry predicts treatment response to anti-
on glutamate receptors and cognition. Trends of neuropsychological impairment in schizo- psychotic medication: a functional imaging
Pharmacol Sci. 2006 Mar;27(3):141–8. phrenia: a study of monozygotic twins discor- study in schizophrenia. Neuropsychophar-
10 de la Fuente-Sandoval C, León-Ortiz P, Favila dant and concordant for the disorder. macology. 2009 Dec;34(13):2675–90.
R, Stephano S, Mamo D, Ramírez-Bermúdez Schizophr Res. 1995 Sep;17(1):77–84. 36 Kraguljac NV, White DM, Hadley JA, Viss-
J, et al. Higher levels of glutamate in the asso- 23 Pirnia T, Woods RP, Hamilton LS, Lyden H, cher K, Knight D, ver Hoef L, et al. Abnor-
ciative-striatum of subjects with prodromal Joshi SH, Asarnow RF, et al. Hippocampal malities in large scale functional networks in
symptoms of schizophrenia and patients with dysfunction during declarative memory en- unmedicated patients with schizophrenia and
first-episode psychosis. Neuropsychophar- coding in schizophrenia and effects of genetic effects of risperidone. Neuroimage Clin. 2015
macology. 2011 Aug;36(9):1781–91. liability. Schizophr Res. 2015 Feb; 161(2-3): Nov;10:146–58.
11 Kegeles LS, Mao X, Stanford AD, Girgis R, 357–66. 37 Honey GD, Bullmore ET, Soni W, Varatheesan
Ojeil N, Xu X, et al. Elevated prefrontal cortex 24 Rasetti R, Mattay VS, White MG, Sambataro M, Williams SC, Sharma T. Differences in
γ-aminobutyric acid and glutamate-gluta- F, Podell JE, Zoltick B, et al. Altered hippo- frontal cortical activation by a working mem-
mine levels in schizophrenia measured in vivo campal-parahippocampal function during ory task after substitution of risperidone for
with proton magnetic resonance spectrosco- stimulus encoding: a potential indicator of ge- typical antipsychotic drugs in patients with
py. Arch Gen Psychiatry. 2012 May; 69(5): netic liability for schizophrenia. JAMA Psy- schizophrenia. Proc Natl Acad Sci USA. 1999
449–59. chiatry. 2014 Mar;71(3):236–47. Nov;96(23):13432–7.
12 Kraguljac NV, White DM, Reid MA, Lahti 25 Kraguljac NV, Srivastava A, Lahti AC. Mem- 38 Minzenberg MJ, Carter CS. Developing treat-
AC. Increased hippocampal glutamate and ory deficits in schizophrenia: a selective re- ments for impaired cognition in schizophre-
volumetric deficits in unmedicated patients view of functional magnetic resonance imag- nia. Trends Cogn Sci. 2012 Jan;16(1):35–42.
with schizophrenia. JAMA Psychiatry. 2013 ing (FMRI) studies. Behav Sci (Basel). 2013 39 Keefe RS, Bilder RM, Davis SM, Harvey PD,
Dec;70(12):1294–302. Jun;3(3):330–47. Palmer BW, Gold JM, et al.; CATIE Investiga-
13 Cairo TA, Woodward TS, Ngan ET. De- 26 Anticevic A, Repovs G, Shulman GL, Barch tors; Neurocognitive Working Group. Neu-
creased encoding efficiency in schizophrenia. DM. When less is more: TPJ and default net- rocognitive effects of antipsychotic medica-
Biol Psychiatry. 2006 Apr;59(8):740–6. work deactivation during encoding predicts tions in patients with chronic schizophrenia
working memory performance. Neuroimage. in the CATIE Trial. Arch Gen Psychiatry.
2010 Feb;49(3):2638–48. 2007 Jun;64(6):633–47.
22 Neuropsychobiology 2021;80:12–24 Gurler/White/Kraguljac/Ver Hoef/
DOI: 10.1159/000506402 Martin/Tennant/Lahti40 Davidson M, Galderisi S, Weiser M, Werbe 52 Ratiney H, Coenradie Y, Cavassila S, van Or- 66 Ragland JD, Ranganath C, Harms MP, Barch
loff N, Fleischhacker WW, Keefe RS, et mondt D, Graveron-Demilly D. Time-do- DM, Gold JM, Layher E, et al. Functional and
al. Cognitive effects of antipsychotic drugs main quantitation of 1H short echo-time sig- Neuroanatomic Specificity of Episodic Memo-
in first-episode schizophrenia and schizo- nals: background accommodation. MAGMA. ry Dysfunction in Schizophrenia: A Functional
phreniform disorder: a randomized, open-la- 2004 May;16(6):284–96. Magnetic Resonance Imaging Study of the Re-
bel clinical trial (EUFEST). Am J Psychiatry. 53 Ashburner J. A fast diffeomorphic image reg- lational and Item-Specific Encoding Task.
2009 Jun;166(6):675–82. istration algorithm. Neuroimage. 2007 Oct; JAMA Psychiatry. 2015 Sep;72(9):909–16.
41 Egerton A, Broberg BV, Van Haren N, Mer- 38(1):95–113. 67 Leube DT, Rapp A, Buchkremer G, Bartels M,
ritt K, Barker GJ, Lythgoe DJ, et al. Response 54 Chumbley JR, Friston KJ. False discovery rate Kircher TT, Erb M, et al. Hippocampal dys-
to initial antipsychotic treatment in first epi- revisited: FDR and topological inference us- function during episodic memory encoding
sode psychosis is related to anterior cingulate ing Gaussian random fields. Neuroimage. in patients with schizophrenia-an fMRI
glutamate levels: a multicentre 1H-MRS study 2009 Jan;44(1):62–70. study. Schizophr Res. 2003 Nov;64(1):83–5.
(OPTiMiSE). Mol Psychiatry. 2018 Nov; 55 Maldjian JA, Laurienti PJ, Kraft RA, Burdette 68 Francis MM, Hummer TA, Vohs JL, Yung
23(11):2145–55. JH. An automated method for neuroanatom- MG, Liffick E, Mehdiyoun NF, et al. Func-
42 de la Fuente-Sandoval C, León-Ortiz P, ic and cytoarchitectonic atlas-based interro- tional neuroanatomical correlates of episodic
Azcárraga M, Stephano S, Favila R, Díaz-Gal- gation of fMRI data sets. Neuroimage. 2003 memory impairment in early phase psychosis.
vis L, et al. Glutamate levels in the associative Jul;19(3):1233–9. Brain Imaging Behav. 2016 Mar;10(1):1–11.
striatum before and after 4 weeks of antipsy- 56 Buckner RL, Andrews-Hanna JR, Schacter 69 Kraguljac NV, White DM, Hadley N, Hadley
chotic treatment in first-episode psychosis: a DL. The brain’s default network: anatomy, JA, Ver Hoef L, Davis E, et al. Aberrant Hip-
longitudinal proton magnetic resonance function, and relevance to disease. Ann N Y pocampal Connectivity in Unmedicated Pa-
spectroscopy study. JAMA Psychiatry. 2013 Acad Sci. 2008 Mar;1124(1):1–38. tients With Schizophrenia and Effects of An-
Oct;70(10):1057–66. 57 Heckers S, Rauch SL, Goff D, Savage CR, tipsychotic Medication: A Longitudinal Rest-
43 Szulc A, Galinska B, Tarasow E, Waszkiewicz Schacter DL, Fischman AJ, et al. Impaired re- ing State Functional MRI Study. Schizophr
N, Konarzewska B, Poplawska R, et al. Proton cruitment of the hippocampus during con- Bull. 2016 Jul;42(4):1046–55.
magnetic resonance spectroscopy study of scious recollection in schizophrenia. Nat 70 Garrity AG, Pearlson GD, McKiernan K,
brain metabolite changes after antipsychotic Neurosci. 1998 Aug;1(4):318–23. Lloyd D, Kiehl KA, Calhoun VD. Aberrant
treatment. Pharmacopsychiatry. 2011 Jun; 58 Medoff DR, Holcomb HH, Lahti AC, Tam- “default mode” functional connectivity in
44(4):148–57. minga CA. Probing the human hippocampus schizophrenia. Am J Psychiatry. 2007 Mar;
44 Nurnberger JI Jr, Blehar MC, Kaufmann CA, using rCBF: contrasts in schizophrenia. Hip- 164(3):450–7.
York-Cooler C, Simpson SG, Harkavy-Fried- pocampus. 2001;11(5):543–50. 71 Ongür D, Lundy M, Greenhouse I, Shinn AK,
man J, et al.; NIMH Genetics Initiative. Diag- 59 Pinkham A, Loughead J, Ruparel K, Wu WC, Menon V, Cohen BM, et al. Default mode net-
nostic interview for genetic studies. Rationale, Overton E, Gur R, et al. Resting quantitative work abnormalities in bipolar disorder and
unique features, and training. Arch Gen Psy- cerebral blood flow in schizophrenia mea- schizophrenia. Psychiatry Res. 2010 Jul;
chiatry. 1994 Nov;51(11):849–59. sured by pulsed arterial spin labeling perfu- 183(1):59–68.
45 Randolph C, Tierney MC, Mohr E, Chase TN. sion MRI. Psychiatry Res. 2011 Oct; 194(1): 72 Pomarol-Clotet E, Salvador R, Sarró S, Gomar
The repeatable battery for the assessment of 64–72. J, Vila F, Martínez A, et al. Failure to deacti-
neuropsychological status (RBANS): prelimi- 60 Schobel SA, Lewandowski NM, Corcoran vate in the prefrontal cortex in schizophrenia:
nary clinical validity. J Clin Exp Neuropsy- CM, Moore H, Brown T, Malaspina D, et al. dysfunction of the default mode network?
chol. 1998 Jun;20(3):310–9. Differential targeting of the CA1 subfield of Psychol Med. 2008 Aug;38(8):1185–93.
46 Overall JE, Gorham DE. The Brief Psychiatric the hippocampal formation by schizophrenia 73 Salgado-Pineda P, Fakra E, Delaveau P, Mc
Rating Scale. Psychol Rep. 1962; 10(3): 799– and related psychotic disorders. Arch Gen Kenna PJ, Pomarol-Clotet E, Blin O. Corre-
812. Psychiatry. 2009 Sep;66(9):938–46. lated structural and functional brain abnor-
47 Hutcheson NL, Reid MA, White DM, Kra- 61 Schobel SA, Chaudhury NH, Khan UA, Pani- malities in the default mode network in
guljac NV, Avsar KB, Bolding MS, et al. Mul- agua B, Styner MA, Asllani I, et al. Imaging schizophrenia patients. Schizophr Res. 2011
timodal analysis of the hippocampus in patients with psychosis and a mouse model Feb;125(2-3):101–9.
schizophrenia using proton magnetic reso- establishes a spreading pattern of hippocam- 74 Lesh TA, Tanase C, Geib BR, Niendam TA,
nance spectroscopy and functional magnetic pal dysfunction and implicates glutamate as a Yoon JH, Minzenberg MJ, et al. A multimod-
resonance imaging. Schizophr Res. 2012 Sep; driver. Neuron. 2013 Apr;78(1):81–93. al analysis of antipsychotic effects on brain
140(1-3):136–42. 62 Talati P, Rane S, Kose S, Blackford JU, Gore J, structure and function in first-episode schizo-
48 Stanislaw H, Todorov N. Calculation of signal Donahue MJ, et al. Increased hippocampal phrenia. JAMA Psychiatry. 2015 Mar; 72(3):
detection theory measures. Behav Res Meth- CA1 cerebral blood volume in schizophrenia. 226–34.
ods Instrum Comput. 1999 Feb;31(1):137–49. Neuroimage Clin. 2014 Jul;5:359–64. 75 Sambataro F, Blasi G, Fazio L, Caforio G, Tau-
49 Schubert F, Gallinat J, Seifert F, Rinneberg H. 63 Talati P, Rane S, Skinner J, Gore J, Heckers S. risano P, Romano R, et al. Treatment with
Glutamate concentrations in human brain us- Increased hippocampal blood volume and olanzapine is associated with modulation of
ing single voxel proton magnetic resonance normal blood flow in schizophrenia. Psychia- the default mode network in patients with
spectroscopy at 3 Tesla. Neuroimage. 2004 try Res. 2015 Jun;232(3):219–25. Schizophrenia. Neuropsychopharmacology.
Apr;21(4):1762–71. 64 Ragland JD, Laird AR, Ranganath C, Blumen- 2010 Mar;35(4):904–12.
50 Vanhamme L, van den Boogaart A, Van feld RS, Gonzales SM, Glahn DC. Prefrontal 76 Park SW, Lee CH, Cho HY, Seo MK, Lee JG,
Huffel S. Improved method for accurate and activation deficits during episodic memory in Lee BJ, et al. Effects of antipsychotic drugs on
efficient quantification of MRS data with use schizophrenia. Am J Psychiatry. 2009 Aug; the expression of synaptic proteins and den-
of prior knowledge. J Magn Reson. 1997 Nov; 166(8):863–74. dritic outgrowth in hippocampal neuronal
129(1):35–43. 65 Achim AM, Lepage M. Episodic memory-re- cultures. Synapse. 2013 May;67(5):224–34.
51 Reid MA, Stoeckel LE, White DM, Avsar KB, lated activation in schizophrenia: meta-anal- 77 Kuipers SD, Bramham CR. Brain-derived
Bolding MS, Akella NS, et al. Assessments of ysis. Br J Psychiatry. 2005 Dec;187(6):500–9. neurotrophic factor mechanisms and func-
function and biochemistry of the anterior cin- tion in adult synaptic plasticity: new insights
gulate cortex in schizophrenia. Biol Psychia- and implications for therapy. Curr Opin Drug
try. 2010 Oct;68(7):625–33. Discov Devel. 2006 Sep;9(5):580–6.
Memory Encoding in SZ Neuropsychobiology 2021;80:12–24 23
DOI: 10.1159/000506402You can also read