NEUROIMAGE: CLINICAL CONTENTS LISTS AVAILABLE AT SCIENCEDIRECT - JUSER
←
→
Page content transcription
If your browser does not render page correctly, please read the page content below
NeuroImage: Clinical 30 (2021) 102666
Contents lists available at ScienceDirect
NeuroImage: Clinical
journal homepage: www.elsevier.com/locate/ynicl
Neurobiological substrates of the positive formal thought disorder in
schizophrenia revealed by seed connectome-based predictive modeling
Ji Chen a, b, c, Tobias Wensing d, e, Felix Hoffstaedter b, c, Edna C. Cieslik b, c, Veronika I. Müller b, c,
Kaustubh R. Patil b, c, André Aleman f, Birgit Derntl g, Oliver Gruber h, Renaud Jardri i,
Lydia Kogler g, Iris E. Sommer j, Simon B. Eickhoff b, c, Thomas Nickl-Jockschat k, l, *
a
Department of Psychology and Behavioral Sciences, Zhejiang University, Hangzhou, China
b
Institute of Neuroscience and Medicine, Brain & Behaviour (INM-7), Research Centre Jülich, Jülich, Germany
c
Institute of Systems Neuroscience, Medical Faculty, Heinrich Heine University Düsseldorf, Düsseldorf, Germany
d
Department of Psychiatry, Psychotherapy and Psychosomatics, Medical Faculty, RWTH, Aachen, Germany
e
JARA Translational Brain Medicine, Aachen, Germany
f
Department of Neuroscience, University of Groningen, University Medical Center Groningen, the Netherlands
g
Department of Psychiatry and Psychotherapy, Medical School, University of Tübingen, Germany
h
Section for Experimental Psychopathology and Neuroimaging, Department of General Psychiatry, Heidelberg University, Germany
i
Univ Lille, INSERM U1172, Lille Neuroscience & Cognition Centre, Plasticity &SubjectivitY Team & CHU Lille, Fontan Hospital, CURE Platform, Lille, France
j
Department of Biomedical Science of Cells and Systems, University of Groningen, University Medical Center Groningen, the Netherlands
k
Iowa Neuroscience Institute, Carver College of Medicine, University of Iowa, Iowa City, IA, United States
l
Department of Psychiatry, Carver College of Medicine, University of Iowa, Iowa City, IA, United States
A R T I C L E I N F O A B S T R A C T
Keywords: Formal thought disorder (FTD) is a core symptom cluster of schizophrenia, but its neurobiological substrates
Formal thought disorder remain poorly understood. Here we collected resting-state fMRI data from 276 subjects at seven sites and
Neuroimaging employed machine-learning to investigate the neurobiological correlates of FTD along positive and negative
Machine learning
symptom dimensions in schizophrenia. Three a priori, meta-analytically defined FTD-related brain regions were
used as seeds to generate whole-brain resting-state functional connectivity (rsFC) maps, which were then
compared between schizophrenia patients and controls. A repeated cross-validation procedure was realized
within the patient group to identify clusters whose rsFC patterns to the seeds were repeatedly observed as
significantly associated with specific FTD dimensions. These repeatedly identified clusters (i.e., robust clusters)
were functionally characterized and the rsFC patterns were used for predictive modeling to investigate predictive
capacities for individual FTD dimensional-scores. Compared with controls, differential rsFC was found in patients
in fronto-temporo-thalamic regions. Our cross-validation procedure revealed significant clusters only when
assessing the seed-to-whole-brain rsFC patterns associated with positive-FTD. RsFC patterns of three fronto-
temporal clusters, associated with higher-order cognitive processes (e.g., executive functions), specifically pre
dicted individual positive-FTD scores (p = 0.005), but not other positive symptoms, and the PANSS general
psychopathology subscale (p > 0.05). The prediction of positive-FTD was moreover generalized to an inde
pendent dataset (p = 0.013). Our study has identified neurobiological correlates of positive FTD in schizophrenia
in a network associated with higher-order cognitive functions, suggesting a dysexecutive contribution to FTD in
schizophrenia. We regard our findings as robust, as they allow a prediction of individual-level symptom severity.
1. Introduction incoherent speech and can manifest in various disorders (Andreasen,
1979; DeLisi, 2001). In particular, FTD is a core symptom of schizo
Formal thought disorder (FTD) is characterized by disorganized and phrenia, defined by the DSM-5 as one of the five major diagnostic
* Corresponding author at: Department of Psychiatry, Iowa Neuroscience Institute, University of Iowa, 2312 Pappajohn Biomedical Discovery Building, Iowa City
52242, IA, United States.
E-mail address: thomas-nickl-jockschat@uiowa.edu (T. Nickl-Jockschat).
https://doi.org/10.1016/j.nicl.2021.102666
Received 14 July 2020; Received in revised form 1 April 2021; Accepted 3 April 2021
Available online 30 April 2021
2213-1582/© 2021 Published by Elsevier Inc. This is an open access article under the CC BY-NC-ND license (http://creativecommons.org/licenses/by-nc-nd/4.0/).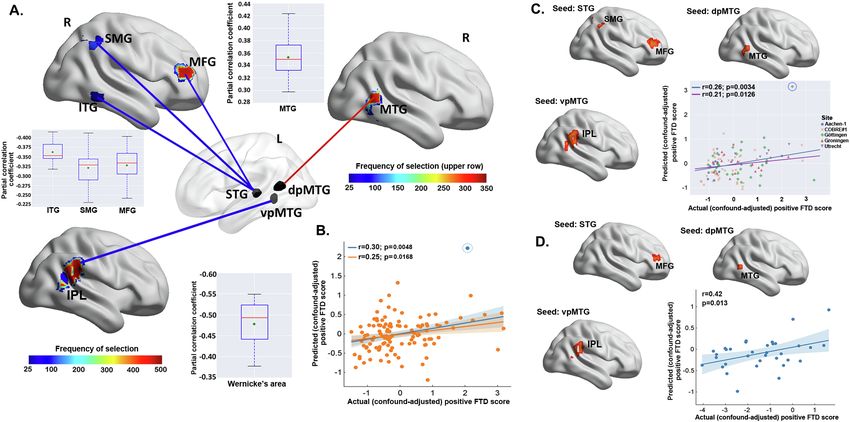
J. Chen et al. NeuroImage: Clinical 30 (2021) 102666
criteria. Critical for the disease trajectory, FTD serves as a robust and (Fox and Raichle, 2007). Importantly, schizophrenia patients show
consistent predictor of transition to psychosis in clinical high-risk sam pronounced neurobiological abnormalities concerning intrinsic con
ples (Hartmann, 2016; DeVylder et al., 2014; Armando et al., 2015). The nectivity patterns between widespread brain regions and networks
clinical presentation of FTD is heterogeneous: impairments as diverse as (Pettersson-Yeo et al., 2011; Uhlhaas, 2013; Dong, 2018). However,
impoverished thinking, disorganized thought processes or lack of rsFC-based studies on FTD in schizophrenia are scarce and previous
spontaneous conversation are usually subsumed under this broad um results remain inconsistent (Liemburg, 2012; Skudlarski, 2010). Also the
brella (Kircher et al., 2018). Given this heterogeneity, researchers have interpretation of prior seed-based rsFC analyses on the revealed circuit-
suggested a dichotomy that relates to the concept of positive and level neural pathophysiology is likewise varying due to the different
negative symptoms in schizophrenia (Andreasen et al., 1990). Following choices of seed regions (Liemburg, 2012; Skudlarski, 2010) In contrast, a
this line of thought, disorganized thinking would be regarded as “posi definition of seeds based on regions identified by meta-analyses as
tive FTD”, while impoverished thought processes would be labeled as showing convergent aberrant activation associated with FTD facilitates
“negative FTD” (Kircher et al., 2018; Andreasen, 1986). This dichotomy the identification of FTD-related circuit-level neural pathophysiology
appears to be clinically highly relevant (Roche et al., 2015), since the with improved functional specificity and therefore interpretability. This
negative FTD dimension has been shown to better predict conversion to is because these regions were identified based on prior task-fMRI
schizophrenia in subjects at risk for psychosis, irrespective of genetic studies, representing robust and the most likely brain locations associ
liability (Ott et al., 2002). Also, these two symptom clusters of FTD ating with FTD across many subjects and variations in paradigm (Laird,
relate to distinct neuropsychological deficits (Nagels, 2016). Moreover, 2009; Eickhoff et al., 2012). Moreover, correlations found in previous
specific FTD dimensions (i.e., negative or positive FTD), rather than studies were based on univariate group-level analyses on small and
overall FTD, were found to be associated with poor outcome in psychotic geographically restricted samples, raising doubts over the reproduc
disorders (Roche et al., 2015; Roche, 2016). Hence, separating FTD into ibility and robustness. Multivariable predictive modeling with cross-
positive and negative dimensions and investigating their respective validation on multi-site data, in contrast, could not only allow for
neurobiological underpinnings is important for understanding identifying a robust neurobiological substrate of FTD, but for assessing
schizophrenia. the predictability of the identified neurobiological patterns for individ
Early functional magnetic resonance imaging (fMRI) studies mainly ual FTD severity.
compared regional neural activations between schizophrenia patients In the present study, we used as seeds the clusters yielded by our
and healthy controls during different language-related tasks and prior meta-analysis (Wensing, 2017). These clusters were identified as
examined FTD symptoms as a single dimension (McGuire et al., 2002; robustly associated with aberrant neural processes engaged during 55
Ragland, 2008; Kircher, 2003; Arcuri et al., 2012; Chen et al., 2014; different, but functionally related experiments across 18 prior task-
Cavelti et al., 2018). While abnormal activations within the traditional based fMRI studies on FTD. Based on these robust clusters, we aimed
temporal language network (Friederici, 2012) were consistently to identify whole-brain dysconnectivity associated with FTD by gener
observed and reported to be correlated with FTD severity in schizo ating seed-to-whole-brain rsFC maps and comparing them between a
phrenia (Cavelti et al., 2018); findings outside this language network multi-site schizophrenia sample and matched healthy subjects. Impor
including prefrontal, postcentral (Kircher, 2001), and fusiform gyri tantly, we realized a cross-validation-based feature selection to derive
(Ragland, 2008; Kircher et al., 2008) were less frequently implicated. A robust rsFC associative patterns for not only the overall FTD, but also the
recent meta-analysis from our lab identified three clusters within the positive and negative FTD dimensions assessed by the items taken from
temporal lobe, mainly associated with language functions, indicating the well-established “Positive and Negative Syndrome Scale” (PANSS)
convergent aberrant neural activations associated with FTD (Wensing, (Kay et al., 1987). Furthermore, the identified robust seed-to-whole-
2017). These results support the notion that abnormalities in language- brain rsFC patterns were employed as features for predictive modeling
processing related brain regions and networks underlie FTD symptoms to assess their predictive capacity for individual FTD severity in out-of-
in schizophrenia (i.e., the “dyssemantic hypothesis”) (Goldberg et al., sample data. Finally, regions with connectivity patterns robustly asso
1998); but do not allow to conclude whether FTD also relates to deficits ciated with FTD were functionally characterized to reveal their neuro-
in circuits involved in higher-order cognitive processes (“dysexecutive cognitive functions (Laird, 2009; Genon et al., 2018). We hypothe
hypothesis”) (Barrera et al., 2005). Furthermore, the use of a generic sized that 1) differential seed-to-whole-brain rsFC patterns are present in
concept of FTD entails pooling over heterogeneous symptoms, while the schizophrenia patients compared to healthy controls; 2) the positive,
relatively small number of fMRI studies, which investigated the neuro negative, and composite FTD symptom dimensions would be associated
biological correlates separately for positive and negative FTD di with differential rsFC patterns in schizophrenia; 3) the identified robust
mensions, suggested distinct pathophysiological processes. neurobiological profile of FTD would allow for out-of-sample prediction
Interestingly, altered neural activation in the inferior frontal cortex of individual FTD dimension scores and involves regions related to
(McGuire et al., 2002; Arcuri et al., 2012; Kircher, 2001); as well as higher-order cognitive functions.
reduced activity and grey matter volume in Wernicke’s area have been
implicated in positive FTD (McGuire et al., 2002; Kircher, 2001a, 2. Materials and methods
2001b). Negative FTD, in turn, was reported to be associated with ab
normalities in dorso-prefrontal and parietal regions involving executive 2.1. Sample
and cognitive control processes (Kircher, 2003; McGuire, 1998; Fuentes-
Claramonte et al., 2020). Nevertheless, neural findings for specific FTD We jointly investigated 276 subjects recruited from seven sites. In
dimensions from these small sample studies require a follow-up in larger detail, a total of 121 DSM-IV diagnosed schizophrenia patients and 121
cohorts of schizophrenia patients. On the other hand, region-based ap healthy controls from five independent medical centers located in
proaches would fall short to detect dysconnection as an important Europe (Aachen-1, Göttingen, Groningen and Utrecht) and the USA
pathophysiological component that presumably underlies schizophrenia (Albuquerque, NM; i.e., the COBRE sample; 80% of the subjects initially
symptomatology (Pettersson-Yeo et al., 2011; Uhlhaas, 2013; Dong, enrolled [COBRE#1]) were included as the main sample (Table 1 &
2018). Connectivity-based analyses might also help to gain further Supplementary material S1). Within each site, patients and controls
insight into the controversy regarding a dyssemantic (Goldberg et al., were matched for age, gender (Supplementary Table 1), and head mo
1998) vs. dysexecutive (Barrera et al., 2005) pathogenesis of FTD tion during scans (root mean-square [RMS] movement and DVARS
symptom dimensions. [temporal derivative of the RMS of the fMRI time series across voxels]39)
Resting-state functional connectivity (rsFC) allows to study brain (all p > 0.05) (Supplementary Table 2). These demographic and
organization at the level of synchronized spontaneous neural activity movement variables did not differ significantly between the two groups
2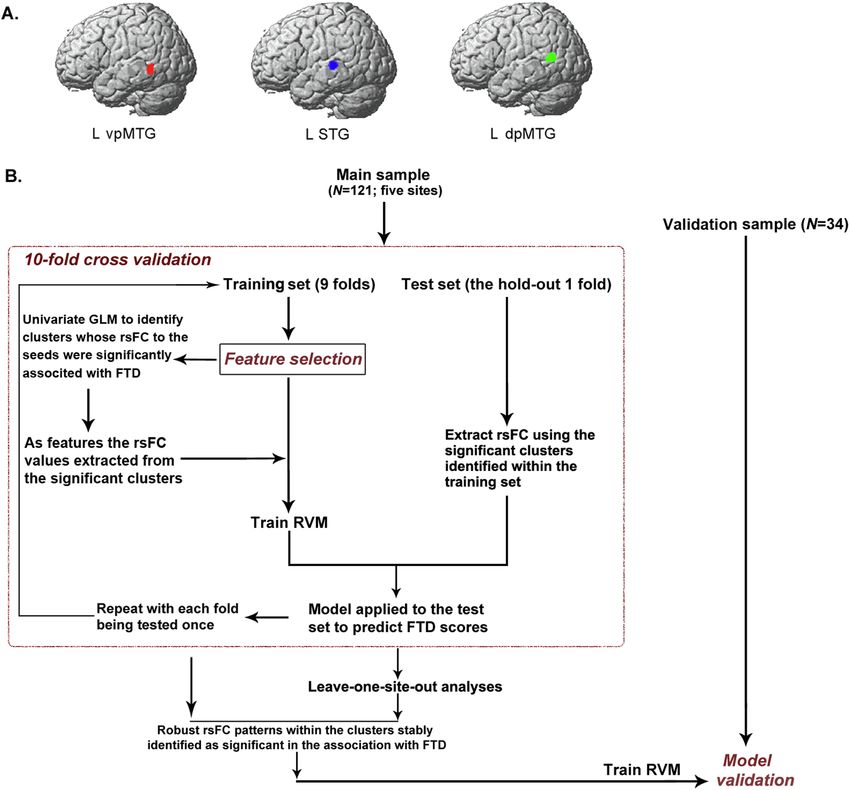
J. Chen et al. NeuroImage: Clinical 30 (2021) 102666
Table 1
Clinical characteristics of schizophrenia patients in the main sample.
Aachen-1 Albuquerque Göttingen Groningen Utrecht Total P-value1
(COBRE#1)
N 13 51 27 20 10 121
Illness duration 8.08 ± 8.66 15.54 ± 12.64 6.67 ± 7.69 9.60 ± 10.46 5.11 ± 5.30 11.03 ± 11.16 0.002
Antipsychotic treatment
FGA 0 3 1 2 1 7
SGA 13 43 19 8 4 87
FGA + SGA 0 2 5 0 0 7
Missing 0 3 2 10 5 20
OZP-equivalent2 21.72 ± 10.05 14.84 ± 10.96 25.06 ± 11.49 14.55 ± 8.31 17.10 ± 12.42 18.81 ± 11.60 0.001
PANSS
FTD composite 4 (4–9) 8 (5–14) 7 (4–14) 6 (4–14) 10 (6–14) 7 (4–14) ≤0.001
FTD positive 1 (1–4) 1 (1–5) 2 (1–5) 1 (1–4) 2 (1–4) 1 (1–5) 0.025
(P2 item)
FTD negative (items N5 + N6 + N7) 3 (3–6) 6 (3–13) 5 (3–9) 4 (3–10) 7 (4–11) 5 (3–13) ≤0.001
Positive 14.54 ± 7.08 14.35 ± 4.45 11.67 ± 3.23 14.74 ± 5.30 17.44 ± 2.96 14.06 ± 4.80 0.016
Negative 9.85 ± 4.04 15.12 ± 5.25 13.04 ± 4.40 13.21 ± 4.45 15.33 ± 4.56 13.78 ± 4.99 0.007
General 24.15 ± 5.66 29.41 ± 8.12 27.81 ± 5.93 27.00 ± 8.97 31.33 ± 8.70 28.26 ± 7.71 0.145
Total 48.54 ± 14.64 58.88 ± 13.36 52.52 ± 10.00 52.11 ± 18.28 64.11 ± 13.82 55.62 ± 14.25 0.019
Note: Data are mean ± SD or median (range). N, number of subjects per research site; FGA, first-generation antipsychotic; SGA, second-generation antipsychotic;
PANSS, Positive and Negative Symptom Scale; FTD, formal thought disorder; OZP, olanzapine. 1Statistical comparison between sites was conducted using either one-
way analysis of variance (ANOVA) or Kruskal-Wallis test where appropriate. 2Dosage in mg/day.
across all sites (p > 0.05). Duration of disease differed significantly be 2.3. Definition of seed regions
tween sites (p = 0.002). An independent dataset (N = 34), including the
COBRE#2 sample (the 20% remaining patients that were not enclosed in We used as seeds three left-lateralized clusters that were identified
the main sample), as well as nine DSM-IV-TR and nine ICD-10 diagnosed by a previous coordinate-based activation likelihood estimation (ALE)
schizophrenia patients from two new sites of Lille and Aachen-2 (Sup (Eickhoff et al., 2012) meta-analysis on functional brain correlates of
plementary Table 3), were used for external validation of the predictive FTD (Wensing, 2017). These clusters were located in the superior tem
models. The main and the validation samples were comparable in de poral gyrus (STG) (110 voxels, volume: 880 mm3), the dorsal posterior
mographic variables (all p > 0.05). For each site, subjects gave fully middle temporal gyrus (dpMTG) (109 voxels; volume: 872 mm3), and
written informed consent and study approval was given by the respec the ventral posterior (vp)MTG (71 voxels; volume: 568 mm3) (Fig. 1A).
tive ethics committees/insitutional review boards. Additional approval
to pool and re-analyze data was provided by the ethics committee of the 2.4. FMRI data acquisition and preprocessing
RWTH Aachen University, Aachen, Germany.
All datasets were scanned (Supplementary Tables 4 & 5) and pre
2.2. Clinical characteristics processed using SPM8 (http://www.fil.ion.ucl.ac.uk/spm) and the
FMRIB’s independent component analysis (ICA)-based X-noiseifier (FIX)
Severity of psychopathology was assessed using the PANSS (Table 1 for denoising the fMRI data (Salimi-Khorshidi et al., 2014; Griffanti
and Supplementary Table 3). Four PANSS items, “conceptual disorga et al., 2014; Liu et al., 2020) (http://fsl.fmrib.ox.ac.uk/fsl/fslwiki/FSL)
nization” (P2), “difficulty in abstract thinking” (N5), “lack of sponta (Supplementary material S2.1). One subject in the control group and
neity and flow of conversation” (N6) and “stereotyped thinking” (N7) two subjects in the patient group (main sample) showed excessive head
were used for assessing the FTD symptoms (Chen et al., 2014; Horn movement of DVARS > 5 and were, hence, excluded from subsequent
et al., 2010; Nagels, 2012). Although no definite consensus exists on the analyses. The threshold of DVARS = 5 is roughly equivalent to a
exact set of PANSS items to assess FTD in schizophrenia, we have chosen framewise displacement of 0.5 mm (Power et al., 2012); which has been
the most consistently selected items from the literature (Chen et al., commonly used in the literature (Power et al., 2015) and was employed
2014; Horn et al., 2010; Nagels, 2012; Tan et al., 2014). Of note, this in our prior work with similar patient cohorts (Chen, 2020, 2021).
choice allowed us to differentiate between the positive and negative Within the patient group, age and duration of disease did not correlate
symptom dimension of FTD, which was a major goal of this study. with any FTD dimension. FTD dimensional-scores did not differ between
Specifically, according to their definitions (i.e., belonging to positive or male and female patients (all p > 0.05). Head motion (DVARS) signifi
negative symptoms in schizophrenia) in the PANSS, the item P2, which cantly differed between sites (p < 0.001, one-way ANOVA), but was not
measures disruption of goal-directed sequencing (manifested as significantly correlated with the scores for any FTD dimensions after
circumstantiality, tangentiality, loose associations, or illogicality), was adjusting for age/gender/site effects (all p-values > 0.09). Nevertheless,
used to assess the severity of positive FTD. The items N5 (impairment in to avoid any (possible) contributions of head motion to the prediction of
the use of the abstract-symbolic mode of thinking), N6 (reduced fluidity individual FTD dimension scores, head motion effects were adjusted in
and productivity of the verbal-interactional process) and N7 (expressed our predictive modeling (Dubois, 2018; Smith and Nichols, 2018). We
as rigid, repetitious, or barren thought content) were subsumed under regressed out white matter and CSF signals from the overall time-series,
“negative FTD” (Horn et al., 2010; Nagels, 2012), defining the FTD di but not the global mean signals, since global signal removal (GSR) is still
mensions as a dichotomous structure as suggested by Andreasen controversial in preprocessing (Murphy and Fox, 2017) and a previous
(Andreasen, 1979). The composite score was calculated as the sum study showed that GSR would obscure an effect predictive of symptoms
scores of the positive and the negative FTD items (i.e., P2, N5, N6, N7). in schizophrenia patients (Yang et al., 2014). Seed to whole-brain rsFC
Patients in the validation dataset showed more severe FTD symptoms maps were generated by calculating the Fisher’s z-transformed linear
than those in the main sample (p < 0.001), which would help to indicate Pearson correlations between the first eigenvariate of the seed time-
the sensitivity of our predictive modeling. Dosages of current antipsy series and the time-series of all other grey matter voxels of the entire
chotic medication were transformed into olanzapine equivalents brain (Kraguljac, 2017).
(Gardner et al., 2010).
3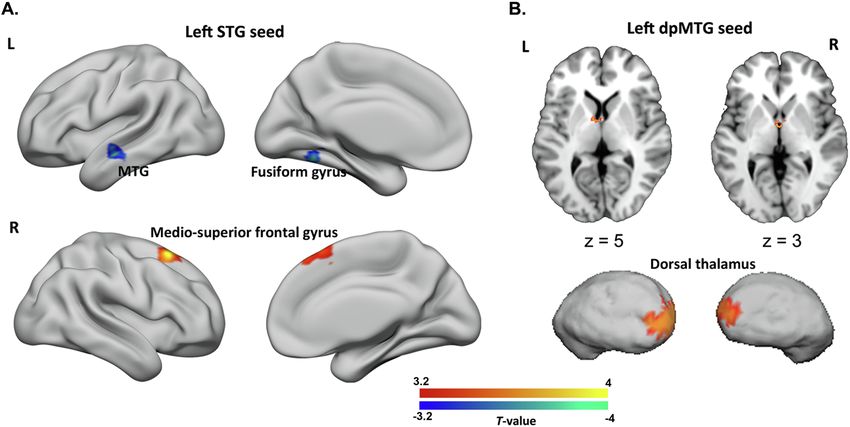
J. Chen et al. NeuroImage: Clinical 30 (2021) 102666
Fig. 1. Seed regions used for functional connectivity map construction and illustration of the overall feature selection and multivariable predictive modeling
procedure. A) We used three clusters as seeds that showed consistently aberrant activation associated with FTD in our previous activation likelihood estimation based
meta-analysis (Wensing, 2017). MNI coordinates: left superior temporal gyrus (STG; − 54, − 28, 4); ventral posterior middle temporal gyrus (vpMTG; − 46, − 50, 22);
and dorsal posterior MTG (dpMTG; − 56, − 56, 12). B) Flowchart illustrates the identification of rsFC patterns that were robustly associated with FTD specific di
mensions, and the use of the identified rsFC as features for predictive modeling. GLM, general linear model; RVM, relevance vector machine; rsFC, resting-state
functional connectivity; FTD, formal thought disorder.
2.5. Between-group comparison of seed-to-whole-brain rsFC predictive modeling to test the predictive capacity of the identified rsFC
patterns for individual FTD dimensional-scores in out-of-sample data.
A general linear model (GLM) was constructed for each of the seed We deliberately chose a supervised feature-extraction procedure in
regions by including group (schizophrenia vs. controls) as a categorical predictive modeling, as the identification of seed-to-whole-brain rsFC
variable to identify voxels that were differentially connected to the seed patterns robustly associated with FTD was our main aim. In each 10-fold
regions in schizophrenia patients compared to healthy controls. Effects process, the original sample was randomly divided into ten equal-sized
of age, gender, site, and head motion (DVARS) were controlled within groups and each of the groups (i.e., the test sample) was predicted once.
the GLMs. The resulting statistical maps were thresholded at cluster- Hence, there were ten training samples with 8/9 patients shared. This
level family-wise error corrected p < 0.05 (cluster-forming threshold resembles a ten times repeated subsampling procedure, during which
p < 0.001) according to the random field theory (RFT). 90% subjects are randomly drawn from the original data without
replacement. Basically, if there are rsFC patterns stably and repeatedly
2.6. Identification of robust rsFC correlates of FTD through repeated detected as significantly associated with FTD irrespective of data
cross-validation and multivariable predictive modeling: Predicting perturbation, these patterns can be reasonably regarded as robust. The
individual FTD dimension scores whole procedure can be parsed into three steps (Fig. 1B):
We, next, implemented a 10-fold cross-validation procedure to i) Identification of rsFC patterns significantly associated with FTD
identify robust seed-to-whole-brain rsFC correlates of FTD (composite, within the training samples
negative, and positive) dimensions and the process was nested within
4
J. Chen et al. NeuroImage: Clinical 30 (2021) 102666
Within each training sample, three univariate GLMs (one for each adjusted) FTD dimensional-scores from the left-out sites and then
seed) were constructed to identify significant clusters with rsFC to the correlated them with the actual (confound-adjusted) scores. Of note, the
seeds significantly associated with FTD dimensional scores after con folds in 10-fold cross-validation and the sites in LOSO analysis were not
trolling for age, gender, site, and head motion effects. Statistical maps independent of each other and, hence, using parametric statistics to
were corrected for multiple comparisons by using the same RFT assess the cross-validated performance is problematic (Noirhomme,
approach described above. This is also critical for predictive modeling to 2014). Here, significance of the 10-fold and LOSO cross-validation-
avoid test-to-training information leakage (Dubois, 2018; Shen, 2017). based correlations against chance was assessed through permutation
testing (Dubois, 2018; Combrisson and Jerbi, 2015) by shuffling the FTD
ii) Feature extraction dimensional scores for 5000 times while keeping everything else exactly
the same (Supplementary material S2.2.3; lowest p = 0.0002, right-
Significant clusters were then used as masks to determine the voxel tailed). We also applied the same permutation testing to the nRMSE
positions where the Fisher’s z-transformed rsFC values were extracted for metric for assessing the significance of cross-validated prediction. The
both the training and the test samples. The extracted voxel-wise rsFC LOSO analysis further allowed to plot prediction accuracy (because the
values were averaged over the voxels within each significant cluster. The Pearson correlation coefficient is sample-size dependent (Yarkoni,
mean rsFC values for all of the detected significant clusters were used as 2009), here we used nRMSE) for each of the left-out sites as a function of
features for predictive modeling. This supervised feature selection sample size (i.e., number of patients).
strategy resembles “connectome-based predictive modeling” (CPM) Finally, we tested the predictability of the robust rsFC patterns
(Shen, 2017); as a long-standing feature selection method described in identified (only) within the main sample for individual FTD
machine learning literature (Guyon and Elisseeff, 2003; Kohavi and dimensional-scores in an independent sample (Supplementary material
John, 1997); which could effectively improve predictive performance S2.2.4) to avoid potential circularity, as discussed previously (Krie
while discarding irrelevant variables (Finn et al., 2015; Beaty et al., geskorte et al., 2009). Briefly, clusters that were repeatedly identified as
2018; Rosenberg et al., 2016). significantly associated with FTD specific dimensions within the main
sample through 10-fold cross-validation and LOSO analyses were used
iii) Predictive modeling as masks to extract the seed-to-cluster rsFC patterns for both the main
and the validation samples. Effects of age, gender, site, and head motion
Since the extracted rsFC values were the original Fisher’s z-trans were adjusted accordingly. Then, the RVM model trained within the
formed values, i.e., not de-confounded, a confound-adjustment pro main sample was applied to the validation sample to derive the pre
cedure was performed prior to predictive modeling to control for dicted FTD dimensional-scores. Prediction performance was evaluated
confounding effects that may contribute to the predictions. More spe as described above. Significance of the correlation was determined by
cifically, in keeping with the recommended strategy (Pervaiz et al., parametric statistical tests.
2020); confounding effects of age, gender, site and head motion In addition, control analyses were performed in predictive modeling
(DVARS) on both the extracted features and the FTD dimensional scores by including olanzapine-equivalent dosage as confounder. To test for the
were adjusted. To avoid data leakage within cross-validation (Dubois, specificity of FTD-associated rsFC patterns in the prediction of FTD di
2018; Snoek et al., 2019), confound-adjustment was conducted by mensions, the model trained based on the rsFC patterns that significantly
learning the confound regression models within the training-set and associated with FTD was used for an analysis to predict other positive
applying the regression weights to both the training and the test sets to symptoms of hallucinations as well as the overall symptom severity (i.e.,
obtain confound-adjusted training and test sets (Dubois, 2018; Snoek total PANSS score). Given the fact that our FIX-based denoising step in
et al., 2019; More et al., 2020). Then, a relevance vector machine (RVM) the preprocessing of the resting-state data has used matching training
(Tipping, 2001) (Supplementary material S2.2.1) was employed to data (i.e., weights) supplied by FIX to classify noise components rather
realize multivariable regression through probabilistic Bayesian learning. than training the weights based on our own samples due to the small
That is, within the training-set, the confound-adjusted rsFC features sample size per site, we repeated our predictive modeling analyses by
were fed into RVM model training with confound-adjusted FTD using rsFC maps generated from the images preprocessed using another
dimension scores as the target variable. Then, RVM weights from the ICA-based approach Automatic Removal of Motion Artifacts (ICA-
trained model were applied to the confound-adjusted rsFC features in AROMA) (Pruim et al., 2015; Ciric et al., 2018; Parkes et al., 2018)
the test-set to obtain the predicted FTD dimensional-scores for out-of- which does not require classifier re-training for denoising (instead of
sample data. ICA-FIX). Finally, an unsupervised approach was applied to supplement
The folds were stratified to ensure the proportion of patients between our supervised feature selection method as elaborated above. In the
sites in each fold was (approximately) equal to that in the entire sample, unsupervised feature selection method, there was no relatedness be
rendering the inclusion of sites in training and test sets balanced. tween the selection of features and the target variable to be predicted,
Holding out each of the ten groups once in the process allowed to where we tested for whether the rsFC between the seeds and their
generate a probability map to denote how many times the significant significantly connected regions could predict the scores of specific FTD
clusters were identified, and to evaluate the prediction performance dimensions out-of-sample (details in Supplementary material S2.2.5).
across the entire data set by computing the Pearson’s correlation coef
ficient and the normalized root-mean-square-error (nRMSE) between
the (confound-adjusted) FTD dimensional-scores and their out-of- 2.7. Functional characterization of the identified brain regions
sample predictions. To ensure a reliable estimation, the 10-fold pro
cess described above was repeated 50 times using random initial splits of To characterize the associated functional properties of the identified
the data. The obtained correlation coefficients and nRMSE values were clusters showing differential rsFC patterns with the three seeds in
averaged over the all repetitions, and the clusters identified as signifi between-group comparisons and the clusters whose rsFC to the seeds
cantly associated with FTD dimensions were accumulated (maximal robustly associated with FTD dimensions in patients, we conducted a
selection number = 500). Clusters with a higher selection number refer functional characterization by implementing quantitative “forward
to more robustly associated given rsFC patterns with FTD. inference” and “reverse inference” (Cieslik, 2012; Clos et al., 2013;
A leave-one-site-out (LOSO) cross-validation analysis was followed Genon, 2017) (Supplementary material S2.3) on the sorted “behavioral
to assess the generalization performance across sites (Supplementary domain” and “paradigm class” meta-data in the BrainMap database
material S2.2.2). The resulting five correlation coefficients and nRMSE (Laird, 2009) (http://brainmap.org/) as collected from prior task-fMRI
values were averaged. We also pooled the predicted (confound- studies.
5
J. Chen et al. NeuroImage: Clinical 30 (2021) 102666
3. Results were discarded due to being regarded as too unstable. Clusters located
in the right dorso-prefrontal region (mainly middle frontal gyrus [MFG])
3.1. Differential rsFC patterns in schizophrenia patients compared to were more frequently detected as significantly associated with the
healthy controls positive-FTD in the repeated 10-fold process than two clusters that were
located in the right inferior temporal cortex and the supramarginal
For the left STG seed, we found decreased rsFC for schizophrenia gyrus. RsFC of these clusters to the left STG seed was co-varying nega
patients compared to healthy controls with one cluster mainly encom tively with the positive-FTD (Fig. 3A). For the left dpMTG seed, clusters
passing the left fusiform gyrus and another one located in the left located in the right MTG were identified as showing significant positive
anterior MTG. Increased rsFC with this seed was found for a cluster in associations with the positive FTD dimension scores. RsFC between the
the right superior medial frontal gyrus (Fig. 2A, Supplementary Table 6). clusters stretching across the right inferior parietal lobule (IPL) and the
For the left dpMTG seed, we found one cluster indicating hyper left vpMTG seed was found to robustly and negatively associate with the
connectivity in schizophrenia patients compared to healthy controls in positive FTD dimension in 491 out of the overall 500 training samples.
the bilateral dorsal thalamus (Fig. 2B, Supplementary Table 6). We did
not find any significant between-group differences for the left vpMTG 3.2.2. Features and predictive modeling
seed. Within each cross-validation, significant rsFC patterns for the three
seeds identified in the training samples were combined to construct the
3.2. Robust rsFC correlates of FTD dimensions and their predictability in feature space for RVM model training within the training samples to
individual FTD dimensional scores predict individual positive FTD scores in the test samples. The predicted
(confound-adjusted) positive FTD scores showed a significant above-
3.2.1. Identification of clusters with rsFC to the seeds that are robustly chance positive correlation with the actual (confound-adjusted) scores
associated with FTD dimensions (r = 0.30, p = 0.0048; nRMSE = 0.97, p = 0.0060; after excluding a
Significant clusters associated with the negative and the composite suspected outlier of predicted score: r = 0.25, p = 0.0168; nRMSE =
FTD scores were too few (i.e., in no>5% of the in total 500 training 0.99, p = 0.0350; Fig. 3B). Outliers (i.e., the unusual predicted FTD
samples within the repeated 10-fold cross-validation) for each seed re scores) were identified first by visual inspection and, second, by calcu
gion to be considered as robust and hence, were not included in subse lating the standardized residuals (Altman and Krzywinski, 2016). For
quent predictive modeling analyses. In contrast, multiple significant the latter approach, predicted scores with a standardized residual > 3 (in
clusters were identified for the positive FTD dimension. For each seed absolute value) were regarded as outliers, based on a commonly used
and each 10-fold cross-validation, significant clusters were accumulated cutoff in literature (Guo et al., 2015; Lehmann, 2013). This approach
to illustrate how robust the rsFC between these clusters and a particular was applied, because outlier values may optimistically bias the estima
seed relates to the severity of positive FTD. Clusters more frequently tion of the correlation between the observed FTD scores and their
detected as significantly associated with positive-FTD in the repeated predictions.
10-fold process were considered as more robust (Fig. 3A). As afore LOSO analysis corroborated the 10-fold results (r = 0.32, averaged
mentioned, clusters identified as significant inJ. Chen et al. NeuroImage: Clinical 30 (2021) 102666
Fig. 3. Cross-validation based feature selection and prediction of individual positive formal thought disorder (FTD) scores from resting-state functional connectivity
(rsFC). A) For each seed region and each 10-fold cross-validation, clusters whose rsFC to the seeds that were significantly associated with positive-FTD were
accumulated. Mean rsFC values extracted within these clusters were used as features. Frequency of the clusters selected in the overall general linear models con
ducted on the 500 training samples is color-coded from blue to red. The three seed regions are displayed on a transparent brain. Blue lines indicate negative as
sociations while the red line indicates positive association. Partial correlation coefficients (adjusted for age, gender, and head motion parameters) between the
identified significant rsFC patterns and the positive FTD scores, derived from the repeated 10-fold cross-validation, were shown in three boxplots separately for the
three seeds (red line depicts the median, green diamond depicts the mean, whiskers represent the 5th and 95th percentiles); B) Scatter shows the Pearson’s cor
relation between the actual (confound-adjusted) positive-FTD scores and their predictions in 10-fold cross-validation within the main sample. The predicted data
were the average predictions for each subject across the repeated 10-fold cross-validation runs. The regression line in blue was fitted with the suspected “outlier” (i.e.,
the circled blue point), while the dark yellow line was fitted after excluding this “outlier”; C) Brain clusters with rsFC to the seeds that were identified as significantly
associated with positive FTD scores in leave-one-site-out cross-validation within the main sample. Scatter plots show the correlation between the actual positive-FTD
scores and their predictions. The data points were colored differently per site. The regression line in blue was fitted with the suspected “outlier” (i.e., the circled blue
point), while the dark yellow line was fitted after excluding this “outlier”; D) Our RVM model, that trained within the main sample based on the rsFC patterns
extracted from the three most robustly identified brain clusters, was applied to the independent sample for validation. Scatter plot shows the correlation between the
actual positive-FTD scores and their predictions in the independent sample. Shaded areas represent 95% confidence intervals. L, left; R, right; FC, functional con
nectivity; AT, abstract thinking; FTD, formal thought disorder; STG, superior temporal gyrus; dpMTG, dorsal posterior middle temporal gyrus; vpMTG, ventral
posterior middle temporal gyrus; MFG, middle frontal gyrus; SMG, supramarginal gyrus; ITG, inferior temporal gyrus; IPL, inferior parietal lobule. (For interpretation
of the references to color in this figure legend, the reader is referred to the web version of this article.)
excluding a suspected outlier of predicted score: r = 0.21; p = 0.0126; patterns. Ten-fold cross-validation revealed that models trained based
nRMSE = 1.01, p = 0.0388]; Fig. 3C). In addition, the prediction accu on the rsFC patterns associated with positive-FTD were not predictive of
racy (nRMSE) did not correlate with the number of subjects in each site hallucinations (r = -0.13, p = 0.86; nRMSE = 1.08, p = 0.61) and overall
(r = 0.29, p = 0.63; Fig. S1). symptom severity (r = 0.05, p = 0.21; nRMSE = 1.07, p = 0.51),
We finally validated the predictability of the identified robust rsFC implying the specificity of the positive-FTD associated rsFC patterns in
patterns for the positive FTD dimension in an independent sample. In the prediction of the positive FTD dimension in schizophrenia. As shown
particular, we focused on the clusters located in the right MFG, MTG, in Fig. S2, using an alternative denoising approach of ICA-AROMA
and IPL. Clusters in these regions were detected as significantly associ largely replicated our main results. Furthermore, through the GLMs
ated with positive FTD in > 60% of the overall 500 10-fold training performed within the main sample implemented as an unsupervised
samples and also significant in LOSO analyses (Fig. 3D). The extracted feature selection approach for predictive modeling, we identified mul
rsFC values were used as features for RVM model training within the tiple clusters showing significant positive or negative rsFC with the three
main sample. After applying the trained model to the validation sample, seeds (Fig. S3). These significant clusters, irrespective of which seeds
we found that the actual (confound-adjusted) scores were significantly they are connecting, were mainly distributed in precuneus, precentral
correlated with the predictions of our model (r = 0.42, p = 0.013, and temporal regions. Specifically, for the left STG seed, clusters with
nRMSE = 1.32; Fig. 3D). Lower rsFC between left STG seed and right positive rsFC were located in bilateral sensory-motor cortex and STG/
MFG, and higher rsFC between the left dpMTG and right MTG and be MTG, with negative rsFC located in bilateral middle and superior oc
tween the left vpMTG and right IPL were associated with more-severe cipital gyrus as well as right IPL. Clusters significantly connected with
positive FTD symptoms. the left dpMTG seed were more widely spread, stretching across bilateral
Additionally, the olanzapine-equivalent dosage of medication did frontal, parietal, temporal, precuneus/posterior cingulate cortex, and
not correlate significantly with the positive FTD dimension score (r = cerebellar areas. Interestingly, clusters showing positive rsFC with the
0.09, p = 0.39) nor with the rsFC in our data (cluster-level corrected p < left vpMTG seed were seated in the lateral hemispheres, while those
0.05), and hence adjusting for olanzapine-equivalent dosage in addition clusters with negative rsFC were medial. Applying RVM models trained
to age, gender, site, and head motion did not alter the predictive within the main sample using the rsFC patterns of these significantly
7J. Chen et al. NeuroImage: Clinical 30 (2021) 102666
connected regions to the validation sample, none of the three FTD di cognitive domains of speech and memory, together with emotion (anger
mensions were significantly predicted (positive FTD: r = 0.25, p = 0.145; and fear) and vision perception. The left MTG cluster was primarily
negative FTD: r = -0.13, p = 0.480; composite FTD: r = -0.05, p = 0.765). associated with language (speech and semantics) and social cognition
(theory-of-mind) (Fig. 4A). The cluster in the right medio-superior
frontal gyrus was functionally associated with emotion processing
3.3. Functional characterization of the identified brain clusters (Fig. 4A), while the thalamic cluster was involved in emotion processing
(reward and sadness) (Fig. 4B).
Functional profiles for each of the characterized brain clusters,
locating in left fusiform gyrus and MTG, right medio-superior, bilateral 3.3.2.
thalamus, right frontal gyrus MFG, MTG, and IPL, was determined by We focused here on the three clusters that were both associated with
quantitative forward and reverse inferences on the behavioral domains positive FTD in > 60% of the overall 500 10-fold training samples and
and paradigm classes as sorted in the BrainMap database (Laird, 2009; significant in LOSO analyses. These three clusters were located in the
Genon et al., 2018). Fig. 4 illustrates separately the results for forward MFG, MTG, and Wernicke’s area. Remarkably, none of these clusters
inference (the probability of a special behavioral process relating to were functionally associated with language-related processes (Fig. 4C).
activation in a given cluster) and reverse inference (which tests, if a Rather, they were all significantly associated with higher-order cogni
given behavioral process is active, when a particular region is activated). tive processes, including working memory, social cognition, and exec
Below, these findings are summarized. utive functions. Specifically, the cluster located in IPL was found as
significantly associated with social cognition (theory of mind), executive
3.3.1. Clusters showing differential rsFC with the seeds in schizophrenia function and interoception. The MTG cluster was identified as involved
patients compared to healthy controls in action observation. The cluster located in the MFG was associated
The cluster in the left fusiform gyrus was associated with the
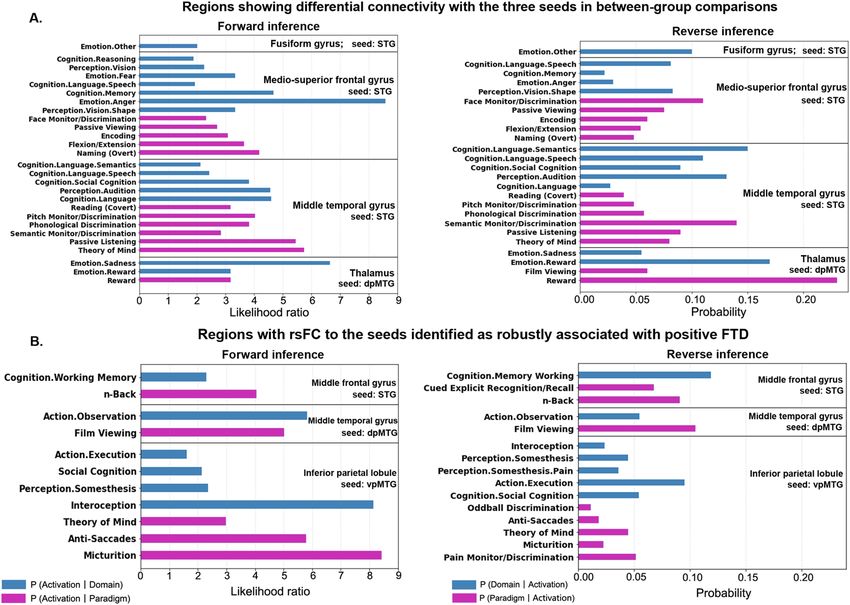
Fig. 4. Functional characterization of the identified brain clusters. Bar charts indicating A) functional profiles of the clusters showing differential resting-state
functional connectivity (rsFC) with the two seeds: superior temporal gyrus and dorsal posterior middle temporal gyrus between schizophrenia patients and
healthy controls, and B) functional characterization of the brain clusters whose rsFC to the seeds were identified as robustly associated with the severity of positive
FTD. Quantitative “forward inference” and “reverse inference” experiments were used to determine the functional profile of each cluster. Regions with significant
functional assignments (false discovery rate corrected p < 0.05) are presented. The significant activation likelihood ratios for each cluster with respect to a given
domain or paradigm (forward inference) and the significant probability of a domain’s or paradigm’s occurrence given activation in a cluster (reverse inference) are
depicted separately. The “P (Activation I Domain/Paradigm)” refers to the activation likelihood (in the forward reference) in a significant region given a particular
label (i.e., a behavioral domain or a task paradigm). The “P (Domain I Activation)” refers to the probability of behavioral domains given activation in a particular
brain region, which tests for a regions’ functional profile based on reverse inference. Similarly, the “P (Paradigm I Activation)” represents the probability of paradigm
classes given activation in this particular region. FTD, formal thought disorder; LH, left hemisphere; RH, right hemisphere.
8J. Chen et al. NeuroImage: Clinical 30 (2021) 102666
with working memory. robust neuromarkers for attention (Rosenberg, 2016) and creative
ability (Beaty, 2018) in healthy populations. We would argue that the
4. Discussion stably identified (and hence) robust rsFC patterns in repeated cross-
validation should constitute a reliable neurobiological substrate of the
Our study identified four brain regions showing differential rsFC positive FTD dimension in schizophrenia.
with the three meta-analytically defined FTD-related seeds in schizo Brain regions whose rsFC with the temporal seeds that identified as
phrenia patients compared to healthy controls. Following a strict cross- robustly associated with positive-FTD were functionally linked to ex
validation procedure (10-fold and LOSO), rsFC patterns of three other ecutive and higher-order cognitive processes including working memory
regions, implicated in executive functions and higher-order cognitive and social cognition. Findings from previous task-based fMRI studies
processes, were identified as robustly associated with the severity of implicated abnormal neural activation in brain regions (e.g., the Wer
positive FTD across different patient cohorts, sites and scanners. The nicke’s area) involved in the production of coherent speech as essential
identified rsFC patterns moreover allowed individual prediction of for positive FTD symptoms in schizophrenia (McGuire et al., 2002;
positive FTD severity in an independent dataset but were not predictive Kircher, 2001a, 2001b). Our own study focused on functional connec
of other positive symptoms, suggesting that these patterns were an in tivity and implicated a link between positive FTD and brain regions
dividual neurobiological substrate closely related to positive FTD. involved in higher-order cognitive processing, thus, extending these
Evidence from previous task-based fMRI studies corroborates the previous findings. Previous task-based studies have implicated
notion that the identified brain regions with differential rsFC with the abnormal neural activations of dorsal prefrontal regions in negative FTD
seeds in schizophrenia patients compared to healthy subjects play a role (Kircher, 2003; McGuire, 1998; Fuentes-Claramonte et al.,). Also our
in the pathogenesis of FTD. The fusiform gyrus, e.g., one of the three results have implicated dorsal prefrontal regions to be associated with
regions showing differential rsFC with the left STG seed in our study, positive FTD, however, based on their connectivity patterns, not on their
was reported as hyperactivated during FTD-associated speech produc regional activity. These dorsal prefrontal regions are associated with
tion in schizophrenia patients (McGuire et al., 2002). The other region in higher order cognitive processes, such as working memory. Our results
the right medio-superior frontal gyrus showed increased rsFC to the STG would strengthen the notion that brain regions involved in executive
seed, which has been found to exhibit increased neural activity during functioning contribute at least to positive symptom severity. These
greater semantic retrieval demands that was significantly correlated findings would suggest also a dysexecutive component in positive FTD,
with FTD severity in schizophrenia patients (Ragland, 2008). Also the while certainly also a dyssemantic contribution seems to be highly
thalamic dorso-medial subfield was identified as differentially con relevant. These findings provide new clues to a long-discussed contro
nected to the left dpMTG seed. The importance of thalamic abnormal versy on FTD in schizophrenia (Barrera et al., 2005).
ities in the pathophysiology of schizophrenia has been discussed in the Different from identifying FTD significantly associated regions as a
context of “cognitive dysmetria”, that is, difficulties in gating informa supervised feature selection procedure in predictive modeling, our
tion, which might result in cognitive deficits on the behavioral level additional predictive analyses employing an unsupervised approach
(Andreasen, 1997; Andreasen et al., 1998). The dorso-medial thalamic which selected as features the rsFC patterns of regions showing signifi
subfield, in particular, has been implicated in speech processing cant positive or negative rsFC with the seeds, did not reveal a significant
(Crosson and Hughes, 1987), especially in the retrieval of memory prediction of any of the three FTD dimensions in the validation sample.
representations in speech perception (Kotz and Schwartze, 2010). On a This corroborated the notion in previous studies that supervised feature
structural level, the dorso-medial region of thalamus, which mainly selection could effectively improve prediction performance. (Shen,
projects to the temporal and frontal cortex (Andreasen et al., 1998); 2017) It needs to be cautioned, though, that independent samples,
shows convergent evidence for structural changes in schizophrenia pa which are not part of the supervised feature selection process, are
tients (Behrens, 2003). This further corroborates the hypothesis of required for validation, so as to avoid circularity, obtain undistorted
dysfunctional fronto-temporo-thalamic networks as a key component in statistics, and therefore, valid predictive results. (Kriegeskorte et al.,
the pathophysiology of schizophrenia (Nickl-Jockschat, 2011; Ellison- 2009) Comparatively, in unsupervised approaches, the feature selection
Wright et al., 2008), and points towards a possible structure–function- criteria are not related to the target variable to be predicted, and hence
relationship in the thalamus for FTD. different hypotheses can be raised in addition to supervised predictive
Of note, robust association patterns between rsFC and symptom modeling as we shown here. Future studies incorporating both the un
severity were only found for the positive FTD dimension. In fact, nega supervised and supervised feature selection approaches are encouraged
tive FTD symptoms corresponded to three items and the scores of each in moving fMRI toward predictive clinical utility in psychiatry.
negative FTD item were not significantly correlated with seed-to-whole- Several limitations need to be discussed. First, the PANSS, compared
brain rsFC patterns. This indicates that rsFC might be less sensitive in to, e.g., the TLC (Kircher et al., 2018), is not a scale that was designed for
detecting negative than positive FTD. Interestingly, significant clusters assessing more fine-grained subcategories of FTD symptoms. However,
from our group comparison on the one hand and our correlation ana using relevant items from this widely used and well-established rating
lyses on the other were spatially not overlapping. This seemingly scale allows the pooling of data across multiple acquisition sites, and,
counterintuitive finding, however, is well in line with previous struc thus, allows comparisons across populations and different treatment
tural MRI findings that showed a similar dissociation between regions regimens (for a more detailed discussion: Supplementary material S4).
implicated in group comparisons and correlations with FTD severity Second, the effect size of the correlation between the predicted and
(Sans-Sansa, 2013). Such a dissociation might suggest a distinct sub actual ratings was moderate. However, despite the clinical complexity of
network mediating positive FTD that is neurobiologically largely the population and the heterogeneities arising from pooling data from
distinct from the circuits that mediate a general predisposition for FTD multiple medical centers with different scanners and settings, the cur
(regardless, whether positive or negative). The notion of a global rent prediction accuracy was similar to those previously reported for
vulnerability mediated by such a network might also explain, why there predicting, e.g., creativity (Beaty, 2018) and memory performance
is no correlation between the composite FTD scores and rsFC. (Persson et al., 2018), from resting-state data in healthy populations (r-
Remarkably, the identified rsFC patterns were predictive of indi values mostly around 0.2–0.35). Third, there might be concerns
vidual positive-FTD severity in novel patients. Previous findings in the regarding potential site effects on prediction. To mitigate this kind of
literature on correlations between fMRI parameters and symptom concerns, we first adjusted site effects on both rsFC and FTD dimensions
severity so far mostly relied on group level analyses, but fell short to sores within 10-fold cross-validation, and then implemented LOSO
allow individual predictions (Bzdok and Meyer-Lindenberg, 2018), which confirmed the 10-fold results. The generated predictive model
although pioneering predictive studies have successfully identified was, moreover, validated in an independent sample. Also the prediction
9J. Chen et al. NeuroImage: Clinical 30 (2021) 102666
accuracy was not site-dependent. We were primarily focusing on the Appendix A. Supplementary data
pooled effects and including small sites would add variance to make the
analysis more conservative. Forth, we acknowledge that patients were Supplementary data to this article can be found online at https://doi.
on their regular medication as prescribed by the attending psychiatrists org/10.1016/j.nicl.2021.102666.
at the time of data acquisition. In general, antipsychotic medication does
affect on brain metabolism and blood flow in schizophrenia (Miller, References
1997), leading to subsequent BOLD signal changes. However, as anti-
psychotics are used to target a broad range of positive symptoms Altman, Naomi, Krzywinski, Martin, 2016. Analyzing outliers: influential or nuisance?
Nat. Meth. 13 (4), 281–282.
(Liemburg et al., 2012), e.g., hallucinations and delusions, and not Andreasen, N.C., 1979. Thought, language, and communication disorders: II diagnostic
positive FTD, in specific, medication effects should largely represent a significance. Arch. Gen. Psychiatry 36 (12), 1325. https://doi.org/10.1001/
source of random variation when analyzing the neurobiological sub archpsyc.1979.01780120055007.
Andreasen, N.C., 1986. Scale for the assessment of thought, language, and
strates of FTD in our data. Such noise would effectively obscure robust communication (TLC). Schizophr. Bull. 12 (3), 473–482.
brain functional associations for FTD, and, in particular, make it harder Andreasen, Nancy C, 1997. The role of the thalamus in schizophrenia. Can. J. Psychiatry
to train algorithms that work well for out-of-sample prediction of FTD 42 (1), 27–33.
Andreasen, N.C., Flaum, M., Swayze, V.W., Tyrrell, G., Arndt, S., 1990. Positive and
scores. We would argue that the current results should not be driven by negative symptoms in schizophrenia: a critical reappraisal. Arch. Gen. Psychiatry 47,
medication effects, but rather represent a solid neurobiological basis for 615–621.
the positive FTD in schizophrenia. Andreasen, N.C., Paradiso, S., O’leary,, D., S., 1998. “Cognitive dysmetria” as an
integrative theory of schizophrenia: a dysfunction in cortical-subcortical-cerebellar
To conclude, we here used three meta-analytically defined seeds to
circuitry? Schizophr. Bull. 24, 203–218.
identify rsFC patterns in schizophrenia patients related to FTD. Associ Arcuri, S.M., Broome, M.R., Giampietro, V., Amaro, E., Kircher, T.T.J., Williams, S.C.R.,
ations between rsFC patterns and positive FTD scores we identified were Andrew, C.M., Brammer, M., Morris, R.G., McGuire, P.K., 2012. Faulty suppression
robust that they allowed an individual prediction of symptom severity in of irrelevant material in patients with thought disorder linked to attenuated
frontotemporal activation. Schizophr. Res. Treatment 2012, 1–12.
patients and, thus, should delineate a robust neurobiological profile for Armando, M., Pontillo, M., De Crescenzo, F., Mazzone, L., Monducci, E., Lo Cascio, N.,
positive FTD. Finally, the positive FTD dimension was found to func Santonastaso, O., Pucciarini, M.L., Vicari, S., Schimmelmann, B.G., Schultze-
tionally associate with higher-order cognitive functions, suggesting a Lutter, F., 2015. Twelve-month psychosis-predictive value of the ultra-high risk
criteria in children and adolescents. Schizophr. Res. 169 (1-3), 186–192.
dysexecutive contribution to the pathophysiology of positive FTD in Barrera, A., McKenna, P., Berrios, G., 2005. Formal thought disorder in schizophrenia: an
schizophrenia. executive or a semantic deficit? Psychol. Med. 35, 121–132.
Beaty, R.E., et al., 2018. Robust prediction of individual creative ability from brain
functional connectivity. Proc. Natl. Acad. Sci. U. S. A. 115, 1087–1092.
Beaty, R.E., Kenett, Y.N., Christensen, A.P., Rosenberg, M.D., Benedek, M., Chen, Q.,
Declaration of Competing Interest Fink, A., Qiu, J., Kwapil, T.R., Kane, M.J., Silvia, P.J., 2018. Robust prediction of
individual creative ability from brain functional connectivity. Proc. Natl. Acad. Sci.
U. S. A. 115 (5), 1087–1092.
The authors declare that they have no known competing financial Behrens, T.E., et al., 2003. Non-invasive mapping of connections between human
interests or personal relationships that could have appeared to influence thalamus and cortex using diffusion imaging. Nat. Neurosci. 6, 750–757.
the work reported in this paper. Bzdok, D., Meyer-Lindenberg, A., 2018. Machine learning for precision psychiatry:
opportunities and challenges. Biol. Psychiatry Cogn. Neurosci. Neuroim. 3, 223–230.
Cavelti, M., Kircher, T., Nagels, A., Strik, W., Homan, P., 2018. Is formal thought disorder
in schizophrenia related to structural and functional aberrations in the language
Acknowledgements network? A systematic review of neuroimaging findings. Schizophr. Res. 199, 2–16.
Chen, J., et al., 2020. Neurobiological divergence of the positive and negative
schizophrenia subtypes identified on a new factor structure of psychopathology
We thank the researchers at each of the medical centers for their using non-negative factorization: an international machine learning study. Biol.
efforts in recruiting the subjects and sharing the data that made the Psychiatry 87, 282–293.
current work possible. Gratitude is expressed to each of the subjects who Chen, J., et al., 2021. Intrinsic connectivity patterns of task-defined brain networks allow
individual prediction of cognitive symptom dimension of schizophrenia and are
spent their time and energy in participating this study and their coop linked to molecular architecture. Biol. Psychiatry 89, 308–319.
eration. This study was supported by the Deutsche For Chen, P.J., Fan, L.Y., Hwang, T.J., Hwu, H.G., Liu, C.M., Chou, T.L., 2014. The deficits on
schungsgemeinschaft (DFG, EI 816/4-1 to S.B.E.), the National Institute a cortical–subcortical loop of meaning processing in schizophrenia. Neuroreport 24,
147–151.
of Mental Health (R01-MH074457 to S.B.E.), the Helmholtz Portfolio Cieslik, E.C., et al., 2012. Is there “one” DLPFC in cognitive action control? Evidence for
Theme “Supercomputing and Modeling for the Human Brain”, the Eu heterogeneity from co-activation-based parcellation. Cereb. Cortex. 23, 2677–2689.
ropean Union’s Horizon 2020 Research and Innovation Programme Ciric, Rastko, Rosen, Adon F.G., Erus, Guray, Cieslak, Matthew, Adebimpe, Azeez,
Cook, Philip A., Bassett, Danielle S., Davatzikos, Christos, Wolf, Daniel H.,
under Grant Agreement No. 720270 (HBP SGA1) and 785907 (HBP Satterthwaite, Theodore D., 2018. Mitigating head motion artifact in functional
SGA2), and the Chinese Scholarship Council to J.C. connectivity MRI. Nat. Protoc. 13 (12), 2801–2826.
Author contributions Clos, Mareike, Amunts, Katrin, Laird, Angela R., Fox, Peter T., Eickhoff, Simon B., 2013.
Tackling the multifunctional nature of Broca’s region meta-analytically: co-
T.N-J., S.B.E. and J.C. designed the study. J.C. analyzed the data, activation-based parcellation of area 44. NeuroImage 83, 174–188.
implemented the machine-learning approaches, and drafted the manu Combrisson, E., Jerbi, K., 2015. Exceeding chance level by chance: the caveat of
script. K.R.P., E.C.C. and V.I.M. contributed to the interpretation of the theoretical chance levels in brain signal classification and statistical assessment of
decoding accuracy. J. Neurosci. Methods 250, 126–136.
results, and provided technical supports as well as statistical advices. T.
Crosson, B., Hughes, C.W., 1987. Role of the thalamus in language: Is it related to
W. conducted initial statistical analyses, and provided the meta-analytic schizophrenic thought disorder? Schizophr. Bull. 13 (4), 605–621.
brain seed regions. F.H. preprocessed the neuroimaging data. A.A., B.D., DeLisi, L.E., 2001. Speech disorder in schizophrenia: review of the literature and
O.G., R.J., L.K. and I.E.S. acquired and provided the multi-site data. All exploration of its relation to the uniquely human capacity for language. Schizophr.
Bull. 27 (3), 481–496.
authors participated in the interpretation of the results, critical revision DeVylder, J.E., Muchomba, F.M., Gill, K.E., Ben-David, S., Walder, D.J., Malaspina, D.,
of the manuscript for important intellectual content, and read and Corcoran, C.M., 2014. Symptom trajectories and psychosis onset in a clinical high
approved the manuscript. risk cohort: the relevance of subthreshold thought disorder. Schizophr. Res. 159 (2-
3), 278–283.
Dong, D., et al., 2018. Dysfunction of large-scale brain networks in schizophrenia: a
meta-analysis of resting-state functional connectivity. Schizophr. Bull. 44, 168–181.
Code availability Dubois, J., et al., 2018. A distributed brain network predicts general intelligence from
resting-state human neuroimaging data. Philos. Trans. R. Soc. Lond. B. Biol. Sci. 373,
20170284.
The code for seed connectome-based predictive modeling can be Eickhoff, S.B., Bzdok, D., Laird, A.R., Kurth, F., Fox, P.T., 2012. Activation likelihood
found at https://github.com/jichen-psy/Seed-commectome-based-pre estimation revisited. Neuroimage 59, 2349–2361.
dictive-modeling.
10You can also read