In vitro validation of Digital Image Analysis Sequence (DIAS) for the assessment of the marginal fit of cement-retained implant-supported ...
←
→
Page content transcription
If your browser does not render page correctly, please read the page content below
Villias et al. International Journal of Implant Dentistry
https://doi.org/10.1186/s40729-021-00290-6
                                                                   (2021) 7:12
                                                                                                                               International Journal of
                                                                                                                                     Implant Dentistry

 RESEARCH                                                                                                                                           Open Access

In vitro validation of Digital Image Analysis
Sequence (DIAS) for the assessment of the
marginal fit of cement-retained implant-
supported experimental crowns
Aristeidis A. Villias1,2* , Stefanos G. Kourtis1, Hercules C. Karkazis1 and Gregory L. Polyzois1

  Abstract
  Background: The replica technique with its modifications (negative replica) has been used for the assessment of
  marginal fit (MF). However, identification of the boundaries between prosthesis, cement, and abutment is
  challenging. The recently developed Digital Image Analysis Sequence (DIAS) addresses this limitation. Although
  DIAS is applicable, its reliability has not yet been proven.
  The purpose of this study was to verify the DIAS as an acceptable method for the quantitative assessment of MF at
  cemented crowns, by conducting statistical tests of agreement between different examiners.
  Methods: One hundred fifty-one implant-supported experimental crowns were cemented. Equal negative replicas
  were produced from the assemblies. Each replica was sectioned in six parts, which were photographed under an
  optical microscope. From the 906 standardized digital photomicrographs (0.65 μm/pixel), 130 were randomly
  selected for analysis. DIAS included tracing the profile of the crown and the abutment and marking the margin
  definition points before cementation. Next, the traced and marked outlines were superimposed on each digital
  image, highlighting the components’ boundaries and enabling MF measurements.
  One researcher ran the analysis twice and three others once, independently. Five groups of 130 measurements
  were formed. Intra- and interobserver reliability was evaluated with intraclass correlation coefficient (ICC).
  Agreement was estimated with the standard error of measurement (SEM), the smallest detectable change at the
  95% confidence level (SDC95%), and the Bland and Altman method of limits of agreement (LoA).
  Results: Measured MF ranged between 22.83 and 286.58 pixels. Both the intra- and interobserver reliability were
  excellent, ICC = 1 at 95% confidence level. The intra- and interobserver SEM and SDC95% were less than 1 and 3
  pixels, respectively. The Bland–Altman analysis presented graphically high level of agreement between the mean
  measurement of the first observer and each of the three other observers’ measurements. Differences between
  observers were normally distributed. In all three cases, the mean difference was less than 1 pixel and within ± 3
  pixels LoA laid at least 95% of differences. T tests of the differences did not reveal any fixed bias (P > .05, not
  significant).
  (Continued on next page)

* Correspondence: aristeidis.villias@gmail.com
1
 Department of Prosthodontics, School of Dentistry, National and
Kapodistrian University of Athens, Athens, Greece
2
 57-59 Kolokotroni Str., Piraeus, Greece

                                       © The Author(s). 2021 Open Access This article is licensed under a Creative Commons Attribution 4.0 International License,
                                       which permits use, sharing, adaptation, distribution and reproduction in any medium or format, as long as you give
                                       appropriate credit to the original author(s) and the source, provide a link to the Creative Commons licence, and indicate if
                                       changes were made. The images or other third party material in this article are included in the article's Creative Commons
                                       licence, unless indicated otherwise in a credit line to the material. If material is not included in the article's Creative Commons
                                       licence and your intended use is not permitted by statutory regulation or exceeds the permitted use, you will need to obtain
                                       permission directly from the copyright holder. To view a copy of this licence, visit http://creativecommons.org/licenses/by/4.0/.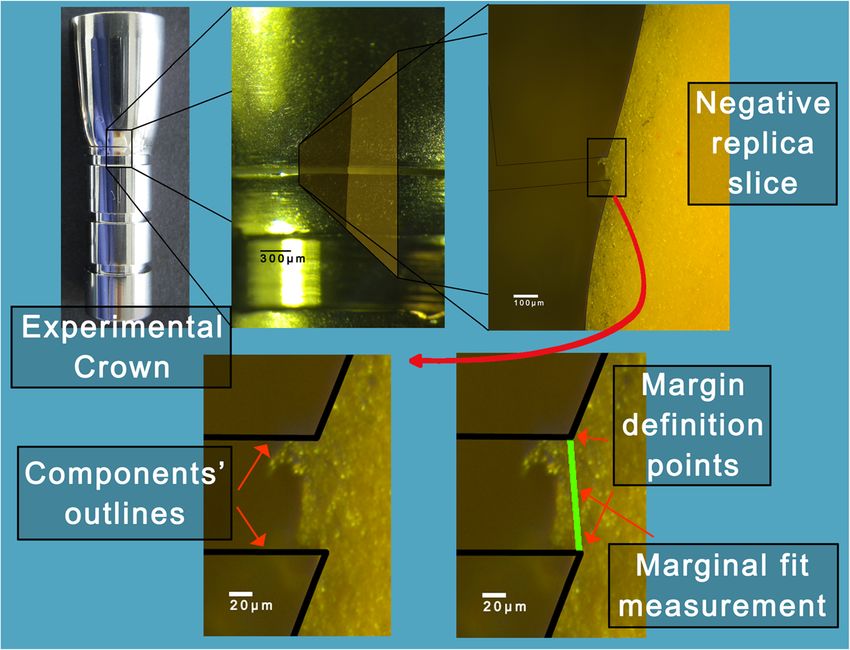
Villias et al. International Journal of Implant Dentistry   (2021) 7:12                                                     Page 2 of 14

  (Continued from previous page)
  Conclusion: The DIAS is an objective and reliable method able to detect and quantify MF at ranges observed in
  clinical practice.
  Keywords: Validation study, Observation methods, Dental marginal adaptation, Marginal fit, Cementation, Implant-
  supported crowns

Background                                                                   However, the replica technique has limitations [38–
In fixed prosthodontics, it is critical that marginal fit                 40]. Manual sectioning process of the fragile replica is
(MF) is kept to a minimum, for successful long-term                       associated with errors such as inclined cutting, discon-
survival of the prosthesis [1–3]. Poor MF on the con-                     tinuous cutting, and distortions of the layer. Such errors
trary, might accelerate cement dissolution and plaque re-                 could give misleading results [2]. Although, cross-
tention, therefore increasing the risks of biological                     sectional images obtained from the slices allow assess-
complications [4–7]. Additionally, it drastically increases               ment of the prosthesis’ marginal fit, the accuracy of the
the probability of luting material exposure at the restor-                method depends on the ability of the observer to identify
ation margin [8, 9].                                                      the boundaries between the prosthesis, cement, and
   Clinically accepted MF ranges from as low as 26 μm                     abutment as well as to identify the misfit using these
and might exceed 200 μm [10–16]. Although discrepan-                      boundaries [40]. Furthermore, margins may appear
cies at the margin, ideally, are ought to be kept to a                    rounded under magnification obstructing an accurate def-
minimum, perfect margins and absolute passive frame-                      inition of the margin [33]. Also, tearing of the elastomeric
work fit are unlikely to be achieved [17, 18].                            film upon removal from the crown has been reported [33,
   Cementation is associated with higher risks for the                    38]. Measurements of the marginal fit have also been con-
health of peri-implant tissues [19–22]. The cause of this                 ducted directly on the impression silicone, which func-
might relate to the fact that the connective tissue barrier               tioned as a negative replica (NR) [41, 42]. The NR
surrounding implant-supported prostheses has weak                         technique successfully addressed inherent limitations of
mechanical resistance in comparison to the natural teeth                  the RT [38, 39]. Due to study specific equipment, the
[23–25]. However, there seems to be a lack of concrete                    homogeneity of the replicas was improved, replica slicing
evidence for the exclusion from use of either retention                   procedure was standardized, and sharp digital micropho-
type. Therefore, selection of screw or cement retention                   tographs were acquired in a standardized manner. After
is a subject of the patient’s and the dentist’s preference                implementing the digital image analysis sequence (DIAS),
[26, 27]. There are situations that cement retention is a                 a recently developed stepwise procedure, crown margin,
preferable treatment choice for implant-supported                         abutment finishing line, and the profile of the set cement
crowns, despite its disadvantages. Cement retention                       were recognizable on the two-dimensional image of the
might be selected due to esthetics, passivity of fit, occlu-              replica cross section [41, 42].
sal management, unfavorable implant inclination, less                        The RT has been evaluated in several studies. Despite its
cost, and familiarity with the procedures [28–30]. A                      limitations, it has been proven for its applicability, repeat-
plethora of methods have been used for the assessment                     ability, and validity [2, 43–46]. However, measurements
of the fit of prostheses on abutments [14, 31–34]. One                    are often conducted by one examiner [31, 44, 45, 47].
of the most widely used methods is the replica technique                  Measurement of agreement is a prerequisite for the ac-
(RT), and according to which, low viscosity light-body                    ceptance of a new method or process before its applica-
silicone material is applied in the crown, which is then                  tion. The agreement between measurements performed
seated on the abutment simulating the cementation pro-                    by different examiners, reproducibility, is described by an
cedure [14]. Higher-viscosity silicone is then poured in                  interobserver variation. On the contrary, the closeness be-
the crown to stabilize the first thin silicone layer. After               tween measurements by the same examiner, repeatability,
setting, the silicone replica can be sectioned and mea-                   is described by an intraobserver variation [48]. A method
sured [33]. This straightforward and inexpensive method                   with a high degree of reproducibility and repeatability is
has been proven a reliable and accurate alternative to                    considered precise and acceptable. A variety of statistical
the destructive cross-sectional method [35, 36]. RT                       methods has been used to verify agreement, including
has also been modified by making an external impres-                      Pearson’s correlation coefficient, intraclass correlation co-
sion of the fixed crown on the corresponding abut-                        efficient (ICC), and non-parametric tests such as Kendall’s
ment and pouring epoxy resin material after setting                       tau and Spearman’s rho [48–53].
of the silicone. The marginal fit was then measured                          Agreement can also be evaluated with the standard
on the resin replica [37].                                                error of measurement (SEM), the smallest detectable
Villias et al. International Journal of Implant Dentistry (2021) 7:12 Page 3 of 14
change at the 95% confidence level (SDC95%). Further- Either zinc phosphate cement (ZnP) (Hoffmann’s Ce-
more, the Bland and Altman method is a useful tool for ment quick setting-zinc phosphate cement, Hoffmann
the quantification of agreement between examiners by Dental Manufaktur GmbH, Berlin, Germany) or self-
means of graphic representation of the limits of agree- adhesive dual-curing luting composite (LCo) (Bifix SE,
ment at the 95% confidence level (LoA95%) [52, 54–58]. Voco GmbH, Cuxhaven, Germany) was used.
A reasonably large sample size is necessary for statistical The cementation process took place in a customized
tests with an adequate level of power, given the effect axial loading device (ALD) (Hercules Parts Co., Athens,
size, so that conclusions can be safely drawn when a Greece). The ALD facilitated standardized cementation
method is examined [54, 59–62]. The DIAS is a recently of samples. After the CSam was thoroughly cleaned, the
developed and useful method for analyzing MF, while screw orifice of the ceramic sleeve was blocked with
addressing some of the inherent problems encountered dental wax. The titanium core was assembled on the im-
with the RT before. Although DIAS is applicable, its val- plant analog and placed in the sample holder of the
idity has not yet been proven. The purpose of this study ALD. Samples were cemented with the temporary ce-
was to verify the DIAS as an acceptable method for the ment according to the instructions of the manufacturer.
evaluation of MF by conducting statistical tests of agree- Using an insulin syringe, a standardized volume (0.014 ±
ment between different examiners using the Bland and 0.007 ml) of mixed cement was applied in the ceramic
Altman method. The hypothesis was that the measure- sleeve. The ceramic sleeve was seated on the titanium
ments with DIAS would not be different between and core with finger force of 5 ± 1 N applied for 5 s. Then, a
within different examiners. constant load of 30 ± 0.2 N was applied on the crown in
the ALD for at least 10 min, until the cement was com-
Methods pletely set. Excess cement was removed either before
Samples setting with a cotton stick after sitting the crown with
A two-component abutment (CSam) (Friadent CeraBase finger pressure or after setting with a plastic scaler. Ex-
D5.5mm, conical, Dentsply Friadent, Mannheim, cess cement removal was carried out within a preset
Germany) was utilized as an experimental crown model. time frame of 45 s. The cementation procedure was con-
Also, a simplified sample (NSam) was designed and pro- ducted by the same researcher throughout this experi-
duced by a certified implant-component manufacturer ment; optimal environmental conditions were kept
(Novadental ltd, Athens, Greece) to reduce costs. Both constant (23 ± 1 °C, 50 ± 10% RH) and powder-free ni-
samples had two parts that presented axial symmetry. trile gloves were used.
One part simulated the abutment and the other the In this way, 31 CSam were created: 11 samples of ini-
implant-supported crown. The MF was measured for tial MF and excess cement removed after the setting
both samples before cementation, according to Holmes’ with a plastic scaler, 3 samples of MF increased by
definition of the “absolute marginal discrepancy”: CSam 85 μm and excess cement removed after the setting with
MF: 65 ± 5 μm, NSam MF: 4.5 ± 2 μm [3]. a plastic scaler, 6 samples of MF increased by 125 μm
Aluminum washers of known thickness 85 ± 10 μm and excess cement removed after the setting with a plas-
and 125 ± 10 μm as well as 75 ± 5-μm-thick stainless tic scaler, 5 samples of initial MF and excess cement re-
steel washers (Washers Ø4.40/3.10-mm material 1.4310, moved before the setting with a cotton pellet, and 6
Lastec AG, Bruegg, Switzerland) were manufactured. samples of MF increased by 85 μm and excess cement
Each washers’ thickness was verified with a micrometer removed before the setting with a cotton pellet.
caliper (0–25-mm micrometer, VIS, Poland). By incorp- In a similar manner, the NSam were cemented. The
orating these washers on the abutment, experimental following workflow, similar to the one followed for the
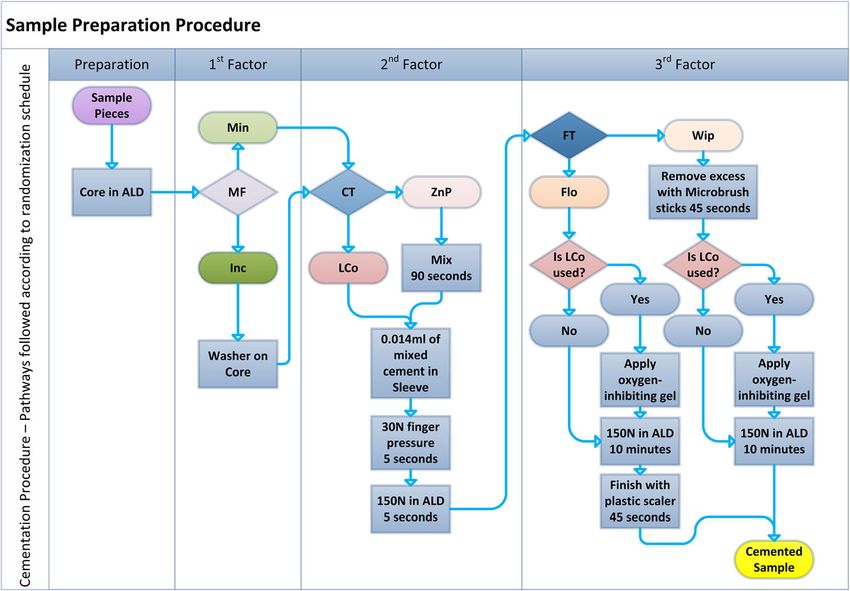
crowns of known initial MF levels were created. 31 CSam, is summarized in a flowchart (Fig. 1). The first
factor was the predetermined initial MF, the second fac-
Cementation tor was the cement type (CT), and the third factor was
A pilot run was executed for the proof of concept of the the excess cement removal technique—finishing tech-
modified negative replica technique, which also incorpo- nique (FT) (Fig. 1).
rated a prototype experimental equipment, as well as Analytically, regarding the NSam, the abutment was
familiarization with the procedures and calculation of an placed in the sample holder of the ALD. Half of the
adequate sample size for a larger experiment. In this ini- samples were cemented with their original MF (Min);
tial run, 31 CSam were cemented with a temporary ce- the other half received a stainless steel washer to in-
ment (TempBond NE, Kerr Italia, Scafati, Italy). One crease the MF by 75 μm (Inc). Instructions of the manu-
hundred twenty NSAm were cemented with permanent facturer were followed to mix the zinc phosphate
cements as part of a larger experiment so that the same cement (ZnP). Mixing took place on a cool and dry glass
number of specimens were included in every group: plate with a cement spatula within the indicated timeVillias et al. International Journal of Implant Dentistry (2021) 7:12 Page 4 of 14 Fig. 1 A randomly followed path that resulted in a cemented experimental crown. The abutment was secured in the Axial Loading Device (ALD) holder, a washer of known thickness was placed on the abutment to introduce a known discrepancy (Inc) or not (Min), the crown was seated on the abutment either filled with a Luting Composite (LCo) or with Zinc Phosphate (ZnP) cement, and finally a procedure was applied to remove excess cement either before setting (Wip) or after (Flo) frame (90 s). The luting composite (LCo) came in the time. Margins were always visible, and optical enhance- QuickMix syringe, which in combination with the mix- ment equipment was not used. The screw orifice at the ing tips, type 14, automatically mixed the material. Both crown component was sealed with hard wax before ce- materials were mixed in the same conditions (23 ± 1 °C, mentation. In this way, 120 NSam were cemented, form- 50 ± 10% RH). With an insulin syringe, a standardized ing 8 groups with 15 samples each: Group 1: volume (0.014 ± 0.007 ml) of mixed luting material was MinZnPFlo, Group2: MinLCoFlo, Group3: MinZnPWip, applied in the crown, which then was seated on the Group4: MinLCoWip, Group5: IncZnPFlo, Group6: abutment with finger force of 30 ± 3 N applied for 5 s. IncLCoFlo, Group7: IncZnPWip, and Group8: Then, the sample was subjected to 150 ± 0.2 N of static IncLCoWip. load in the ALD. Excess cement was removed with the wipe-off tech- Negative replica technique nique (Wip), after 5 s of 150 N static load in the ALD, After acquisition of the cemented sample from the ALD utilizing within 45 s two to four regular-sized micro- holder (Fig. 2), the wax, filled in the screw orifice, was brush sticks (Microbrush disposable micro-applicators removed with a sharp drill bit (Stahl HSS - G Ø2.0 mm, regular size, Microbrush International, Waterford, Craftomat, Germany). The cemented sample was placed Ireland). After cement clean-up with the wipe technique, standing fitting on a pin protruding at the center of a the sample was subjected to constant load of 150 N in socket on the replica production device (RPD) (Fig. 2). A the ALD, for at least 10 min at room temperature (23 ± specialized copper tray was then precisely fitted in the 1 °C), until the cement was completely set. The luting corresponding RPD socket surrounding the cemented composite was also left to be set chemically. In order to sample at the center. The volume between the sample enable its complete and homogenous curing, an oxygen- and the copper tray was filled with addition silicone (Ex- inhibiting gel (Panavia F 2.0 Oxyguard II, Kuraray Med- press 2- Ultra-light body quick -Vinyl Polysiloxane Im- ical Inc, Okayama, Japan) was applied at the margins. pression material, 3M ESPE, Germany) with an Excess cement was removed with the flick-off technique appropriate dispenser. (Flo) after the setting with a plastic scaler, also within The impression material was homogenously applied 45 s. on the sample surface with compressed dry air. The ma- According to this cementation protocol, seating of the terial was left to set for at least 10 min. After setting, the crown was completed within the designated working tray was easily removed from its socket. The sample was
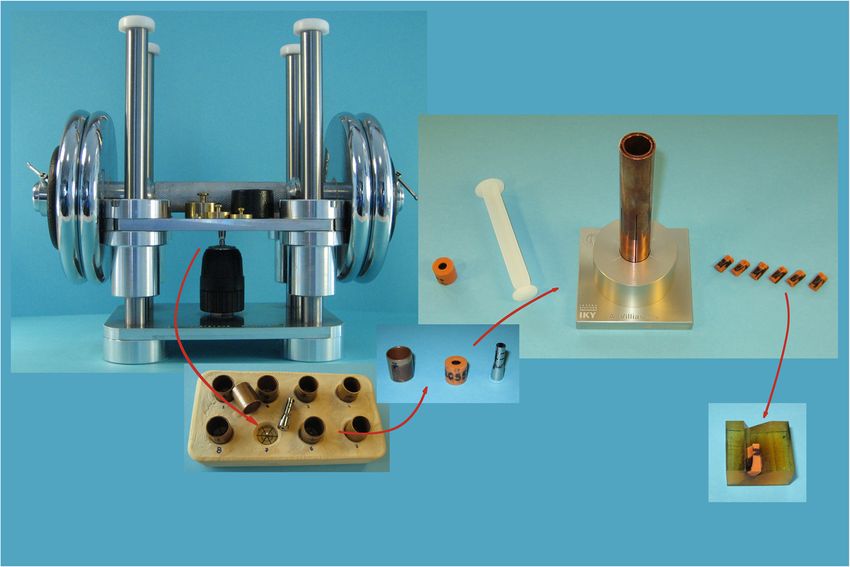
Villias et al. International Journal of Implant Dentistry   (2021) 7:12                                                                 Page 5 of 14

 Fig. 2 The original apparatus implemented in the study. From left to right following the arrows: A cemented experimental crown held at the
 Axial Loading Device (ALD), the slot at the Replica Production Device (RPD) where the cemented crown would be replicated, the acquired
 negative replica from within the specialized copper tray with the corresponding cemented experimental crown on the right, the negative replica
 inserted with a plastic plunger in the inner tube of the Sample Intersection Device (SID), and the six negative replica slices on the right, which
 were the observation units. Finally, each slice was placed on the Sample Observation Base (SOB) for examination under a stereomicroscope

removed with one move by applying pressure at the top                       negative replica. The slot width was adjusted to the
part of the implant analog, and the NR was obtained                         blade width (0.1 mm) by turning the outer tube clock-
from the tray by applying steady force in a wet environ-                    wise. Then, the blade was carefully pushed towards the
ment. Finally, the acquired NR was trimmed and exam-                        bottom of the tubes cutting the replica in half. The slot
ined for flaws macroscopically. Next, NR was stained                        width was increased by turning the tube counterclock-
(Lumocolor permanent special M, Staedtler Mars GmbH                         wise. The blade was removed and inserted to the next
& Co, Nuernberg, Germany) to enhance contrast and                           slot. This procedure was repeated once more for the last
placed in the Sample Intersection Device (SID) for sec-                     pair of slots. Finally, the SID was disassembled, and the
tioning (Fig. 2).                                                           sectioned replica was removed from the inner tube with
  The SID was a portable, easy to use, and robust device,                   the plastic plunger. The described steps for NR produc-
manufactured by a specialized company (CNC Solutions                        tion and sectioning were conducted by one researcher
Co., Peania, Greece). It facilitated precise sectioning of                  once.
replicas in six 60° sectors in either random or oriented                      The described workflow for the production of negative
manner and allowed quick acquisition of sample sections                     replicas and the utilized experimental equipment are il-
afterwards. The SID was composed of two parallel con-                       lustrated (Fig. 2). The experimental crown seated under
centric copper tubes fixed on an aluminum base. Six                         constant load in the ALD, and then a negative replica
slots were opened on the long axis of the tubes forming                     was produced in an RPD slot by filling with low viscosity
six 60° sectors. The inner tube was rigidly fixed on the                    addition silicone the volume between a firmly placed
base while the outer one could rotate freely, adjusting                     cemented sample and the specialized copper tray. Next,
the width of the slots. The inner diameter of the inner                     the orange cylindrical negative replica was sectioned in
tube was the same with that of the specialized copper                       the SID in six sectors, each of which was placed on the
trays of the RPD.                                                           Sample Observation Base (SOB) to be examined under
  A prepared negative replica was placed at the inner                       the optical microscope (Fig. 2). Utilization of the afore-
tube with a small amount of lubricant (K-Y Lubricating                      mentioned experimental equipment contributed sub-
Jelly, Johnson & Johnson, New Brunswick, NJ, USA) and                       stantially to the standardization of the production
pushed at the bottom with a plastic plunger. Next, the                      resulting in uniform replicas and comparable digital im-
intersection means (Double edge, platinum-chrome                            ages. Qualitative analysis and quantitative assessment
blades, USA) was inserted in the aligned slots above the                    was applicable on digital images acquired during
Villias et al. International Journal of Implant Dentistry   (2021) 7:12                                                   Page 6 of 14

preliminary trials in a similar procedure without the                     marked points on the sample profile, one located at the
aforementioned      equipment,   however,   hindering                     prosthesis margin and one at the abutment finishing
comparisons.                                                              line. Finally, measurements were taken. The composite
                                                                          Fig. 3 presents the concept of DIAS by demonstrating an
Data acquisition                                                          experimental crown (NSam), which was cemented ac-
Each replica section was examined under a stereomicro-                    cording to one of the pathways of the flowchart in Fig. 1.
scope (Stemi SV11, Zeiss, Germany) with a mounted                         The acquired image of the negative replica slice revealed
digital camera (ProgRes® C3 CCD Routine Camera,                           the profile of the cemented crown and enabled the
Jenoptic, Germany). Photomicrographs were captured by                     orientation of the component outlines (crown-abut-
applying the maximum magnification available for the                      ment), which facilitated the margin definition and mar-
camera (× 390). The microscope camera was controlled                      ginal fit measurements (Fig. 3).
by its accompanying software (ProgRES Mac CapturePro
2.7.6., Jenoptic) installed in an Apple computer (Power                   A. Digital tools
Mac G4, Mac OS X Version10.4.11). The illuminator (Il-                    As an initial step for the application of DIAS, the out-
luminator 10 for integration in Stemi carrier equipped                    lines of the crown and the abutment were drawn. For
with a 6 V 10 W halogen bulb, Zeiss, Germany) was con-                    each sample component, either the crown or the abut-
figured at maximum output, and additional external                        ment, a NR was produced, sectioned, and photographed
lighting was provided by two LED illuminators (15 W,                      with the same settings under the microscope as de-
70 Lumen, 2700 K), minimizing exposure time and en-                       scribed earlier and they were further processed with the
hancing sharpness of the acquired digital images. Stain-                  software Adobe Photoshop (Adobe Photoshop CS 5
ing of the hollow part of the replica in previous steps                   V12.0.4 x64, Adobe Systems Inc.). The first image was
also improved contrast and sharpness of the images.                       set as the background. Next, each of the following five
Also, the iris diaphragm was set open, minimizing the                     images of the component was superimposed as a new
depth of field and increasing resolution. The resolution                  layer with 40% transparency. Using the “Move Tool,”
limit of the procedure was estimated at 0.65 μm.                          each superimposed image was oriented and placed to
   Replica sections were examined on a customized                         best fit the depicted component edge at the underlying
epoxy resin Sample Observation Base (SOB), designed                       image and finally the composite image was “flatten.”
for the geometry of the observation units (replica slices)                   The edge of the observed component at the composite
(Fig. 2). It facilitated accurate and quick placement                     image was the average profile of the component. Utiliz-
under the stereomicroscope in a reproducible way. Cap-                    ing a highly sensitive digitizer (Bamboo CTH-470/S,
tured digital images were checked for artifacts, such as                  Wacom, Toyonodai, Japan), a “path” was created from
bubbles and stain faults. If the outline of the sample                    the tracing of the component’s average profile. Then, on
could not be identified, previous steps were repeated. Fi-                the formed profile, a point was marked corresponding to
nally, digital images were saved as .TIF files with code-                 the crown exposed margin or to the abutment finishing
name in an external USB drive. In this way, 906 digital                   line depending on the type of the processed component
images corresponding to 151 cemented samples were ac-                     outline (Fig. 3). These marks would later facilitate the
cumulated. The 151 experimental crowns were of two                        MF measurements (Fig. 3). Finally, the crown outline
different types (CSam or NSam), were cemented with                        and the abutment outline were saved as “paths” for use
different luting agents, and had different initial marginal               in the next step. This step was repeated for each of the
fit levels, and the excess cement was handled in different                two components of the different experimental crowns
ways, in an effort to simulate the variety of settings oc-                (CSam, NSam) that were used in the study and was con-
curring in clinical practice. Furthermore, the selected                   ducted once by one researcher (observer 1). Four out-
specimens presented axial symmetry, which facilitated                     lines were created in this way. The designed component
the production of homogenous negative replicas with                       outlines were utilized as a digital aid at the image pro-
the aid of customized experimental equipment. The re-                     cessing steps that followed.
sult of this homogeneity was that the 906 acquired
digital images were uniform allowing standardize pro-                     B. Image processing
cessing and comparisons. From those 906 images cap-                       The created component outlines were utilized to mark
tured by one researcher, 130 were randomly selected for                   the profile of the cemented sample on the image of the
analysis in the present study.                                            replica slice (Fig. 3). This was possible due to the uni-
                                                                          form geometry of the experimental crown components
DIAS—Digital Image Analysis Sequence                                      that were utilized in this experiment, as well as the stan-
Acquired digital images were analyzed in a sequence of                    dardized acquired digital images. First, the acquired
steps. MF was defined as the line segment between two                     image was open with Adobe Photoshop and a new path
Villias et al. International Journal of Implant Dentistry (2021) 7:12 Page 7 of 14
Fig. 3 Digital Image Analysis Sequence: Images on the top raw from left to right: First, a cemented experimental crown, focus on the exposed
cement surface at the margin. Second, the superimposed acquired image of the negative replica slice representing a profile parallel to the long
axis of the sample and perpendicular to the margin. Next, the captured image of the negative replica slice with the superimposed components
outlines (thin black lines) placed at the location of best perceived fit. Images on the bottom raw: Focus on the margin with the components’
outlines shown with thick lines. The crown outline (angled line on top) and the abutment outline (angled line at bottom). Next, the green line
represents the measurement of MF accurately defined between the two angle points
was created from the “paths” menu. The corresponding From the main menu, the path “File>Open…” was se-
outline was copied from the “paths” menu of the rele- lected, and after browsing, the processed images were
vant composite image of the previous step and pasted as selected and loaded in an uneven order. From the main
a new path to the analyzed image. Second, the compo- menu, “Analyze>Set Scale…” was selected. Pixel aspect
nent outline (i.e., crown) was oriented and placed by the ratio was set to 1.0. The button “Click to Remove Scale”
examiner at best perceived fit position on the depicted was clicked, and the box “Global” was ticked. Then,
edge of the sliced replica using the “path selection tool.” “OK.” Therefore, MF was recorded as distance in pixels
Horizontal, vertical and rotation adjustments were made between the pre-marked pixel on the crown outline and
with the “Free Transform Path” procedure. These opera- the one on the abutment outline. The outlines, which
tions were repeated for the next component (i.e., were the “digital tools” described in section A, were
abutment). common for all CSam and all NSam experimental
The next commands were “Make selection,” “Feather crowns on abutments and had pre-marked the margin
radius” set at zero pixels, and “Anti-aliased” option not definition points.
selected. Then, from the edit menu, the “Stroke” com- From the tools menu, the “Magnifying Glass” tool was
mand was selected. Line width was set at one pixel, loca- selected. After a few clicks on the first image at the area
tion at the center of selection, and color black. Then, the where the margin definition points were marked, the
image was saved without compression. image got a digital zoom up to 3200%. Pixels and the mar-
gin definition points could be clearly seen. Then the
C. Measurements “straight line” tool was selected. The cursor was placed at
The public domain Java image processing program Ima- the margin definition point on the crown outline, clicked
geJ V1.52p (National Institutes of Health, USA) was run and dragged towards the margin definition point on the
from its installation folder. From the main menu, the abutment outline. Then, the measurement was automatic-
path “Edit>Options>Appearance…” and “Open images at ally taken by pressing the “CTRL+M” keys and was auto-
100%,” “Black canvas,” “IJ window always on top,” and matically recorded in a text file. Finally, the window of the
“OK” were selected. Next, from the main menu, “Analy- measured image was closed and the procedure was re-
ze>Set Measurements…” was selected. Only the option peated for the next image. After all the measurements
“Display label” was checked and decimal places were set were taken, the results window was selected, and from the
at two “2” and “OK”. main menu, “File>Save as…” the file was saved.Villias et al. International Journal of Implant Dentistry (2021) 7:12 Page 8 of 14
DIAS was run by observer 1 twice in different sessions from this setup with 650 analyzed images in total. The
with a 15-day interval. Three other observers (observer initial MF of the samples in this study ranged between
2, observer 3, and observer 4) performed the analysis in- practically ideal fit (4.5 μm) and up to 205 μm. Discrep-
dependently, using the same equipment. All examiners ancies were artificially introduced before cementation
had laboratory research experience and were previously with washers of known thickness [6]. The result of Sha-
trained for using the software Adobe Photoshop and piro–Wilk test of normality was P < .05 rejecting the
ImageJ. However, not all of them were dentists. The 130 null hypothesis that the data were not different from a
digital images were identified by a code and were ran- normal distribution. The Q-Q plots, histograms, skew-
domly and anonymously analyzed, ensuring blinding of ness, and kurtosis reflected the same result that the data
the examiners. Five groups with 130 measurements each are not normally distributed and exhibited positive
were formed with this setup. skewness. The descriptive statistics are summarized in
Table 1. The median and range are shown first in the
Statistical analysis table because the median is more representative than
The statistical package SPSS (SPSS for Windows, Rel. the mean when the data are asymmetrically distributed.
25. 64-bit ed. 2017 Version 25. IBM Corp.) was used. Both the intra- and interobserver reliability had excel-
Descriptive statistics were computed for the recordings lent ICC scores (ICC ≈ 1, Power (1-β err prob) >
of all researchers to present the distribution of the image 99.99%) (Table 2). The applied alternative methods
analysis results. Normality of the data, as well as com- (non-parametric correlation tests Kendall’s tau (τ) and
pared differences, were examined by Shapiro–Wilk and Spearman’s rho (rs)) for assessing correlation of mea-
Kolmogorov–Smirnov tests, Q-Q plots, and correspond- surements show excellent correlation as well (1). Obser-
ing histograms. Data were graphically represented in ver 1’s mean measurements of marginal fit
boxplots. implementing DIAS were significantly correlated with
The intra- and interobserver reliability was evaluated observer 2’s measurements (rs = .998, τ = .977), and ob-
by the ICC, examining whether the DIAS could be ef- server 3’s measurements (rs = .998, τ = .971), as well as
fectively used by a variety of different examiners. In this observer 4’s measurements (rs = .999, τ = .984) (all Ps <
test, both observers and images were considered random .0001 and Power (1-β err prob) > 99.99%). In Table 3,
factors. The interobserver reliability was computed by the calculated SEM and SDC95% values in pixels are
comparing the observer’s 1 mean with the results of ob- shown.
servers 2, 3, and 4 separately. Non-parametric correl- Tests of normality for the distribution of differences
ation tests Kendall’s tau (τ) and Spearman’s rho (rs) were between examiners showed no significant deviations
also run to verify the results. from normal distribution. The results of these tests are
Agreement was estimated according to three parame- summarized in Table 4. Hence, parametric tests were
ters: The SEM, SDC95%, and the LoA95%. The restricted run. The intrarater agreement was determined with the
maximum likelihood method was implemented for the Bland and Altman analysis of bias. The Bland and Alt-
estimation of variance components necessary for the cal- man method included a one-sample t test of differences.
culation of SEM. The Bland and Altman method was The null hypothesis that the set of the measurements of
implemented to quantify agreement between the mea- each of the observers 2, 3, and 4 would not be different
surements of observer 1 with the measurements of the from the mean measurement of observer 1 was main-
other three observers separately by means of a graphic tained. In the one-sample t test with 129 degrees of free-
representation of the calculated limits of agreement. dom, the P > .05 (not significant (ns)) indicated absence
The type I error was set at 0.05. For each comparison, of fixed bias. The effect sizes Pearson’s r and Cohen’s dz
the effect sizes were also calculated. Using GPower, as- were also calculated. On average, the measurements of
suming a small effect size of r = 0.11, an alpha level of α observer 1 in pixels (M = 117.11, SE =5.61) were not sig-
= 0.05, and a minimum power level of β = 0.80, a sample nificantly different from those of observer 2 (M =
size of 130 per group was a priori determined [59, 60]. 117.17, SE = 5.58, t = − ,687, P = .494 (ns) > .05, r = .06,
Power was also calculated post hoc with the open source dz = − .06, Power (1-β err prob) = 10.47%), neither from
software for power analysis and sample size calculations those of observer 3 (M = 117.30, SE = 5.582, t = − 1.648,
GPower [59, 60]. P = .102 (ns) > .05, r = .114, dz = − .145, Power (1-β err
prob) = 37.29%) nor from those of observer 4 (M =
Results 117.18, SE = 5.61, t = − 1.109, P = .270(ns) > .05, r =
One hundred thirty digital images were anonymously .097, dz = − .097, Power (1-β err prob) = 19.62%).
and randomly analyzed two times by observer 1 and After calculation of the LoA95%, Bland–Altman scatter
once by each of the three other observers in order to as- plots were drawn to present graphically the level of
sess the validity of the DIAS. Five groups were derived agreement between the average measurements ofVillias et al. International Journal of Implant Dentistry (2021) 7:12 Page 9 of 14
Table 1 Descriptive statistics of the image analysis procedure for all observers
Observer 1—1st mes Observer 1—2nd mes Observer 2 Observer 3 Observer 4
Valid data 130 130 130 130 130
Shapiro–Wilk P† < .001‡a < .001a < .001a < .001a
Median* 132.6838 132.6550 132.1400 131.8350 132.7050
Range* 285.91 285.17 283.72 283.77 286.58
Minimum* 23.27 22.95 24.70 24.60 22.83
Maximum* 309.18 308.11 308.42 308.37 309.41
Mean* 117.1572 117.0547 117.1708 117.3008 117.1818
Std. deviation 63.99465 63.86425 63.62508 63.64398 63.99491
*
Units are in pixels
†
Shapiro–Wilk test of normality (all values are significant a)
‡
Shapiro–Wilk test of observer 1 mean
observer 1 and each one of the other observers (2, 3, 4). cementation on the MF of the samples with the setup of
The Bland–Altman scatter plots of the difference be- this study.
tween the first observer’s average measurements and the After implementing the digital image analysis sequence
second (Fig. 4), third (Fig. 5), and fourth (Fig. 6) ob- (DIAS), a recently developed stepwise procedure, crown
server’s measurements were drawn with the aid of SPSS margin, and abutment finishing line as well as the profile
software. The Y-axis illustrates the difference between of the set cement were recognizable on the two-
the first observer’s mean and each other observer re- dimensional image of the replica cross section [41, 42].
spectively (Figs. 4, 5, and 6). The X-axis presents the The marginal fit could be examined directly on cemen-
average of their measures. Difference mean is the esti- ted crowns in situ [8, 9, 34]. However, direct observation
mated bias between the first observer’s and second (Fig. of the margin would facilitate only assessment of the
4), third (Fig. 5), and fourth (Fig. 6) observer’s measure- vertical discrepancies and only qualitative assessment of
ments, respectively. LoA95% is the limits of agreement at the exposed cement surface. Examination of the margin
the 95% confidence interval. of a cemented crown from the side is a subject of micro-
scope’s depth of field-delicate calibration and orientation
of the sample, providing images that seem to be blurry,
Discussion obscuring accurate measurements. An alternative could
This study showed that the DIAS is a reliable and repro- be a destructive method with embedding the samples,
ducible instrument for the quantitative evaluation of MF cross sectioning them and observing the actual sections
on cemented implant-supported crowns. In this study, under the microscope [35]. However, this technique also
the followed NR technique and the image acquisition includes many steps, is time consuming, and might also
procedure provided a high level of standardization introduce artifacts at the fragile cement profile. The
among acquired images. Random subject variation and utilization of a scanning electron microscope would in-
bias were tackled by blinding the observers with ran- crease costs and would also be time consuming [7].
domly assigning the images for analysis [48]. It was not Utilization of an optical microscope and implementation
possible to draw conclusions on the effects of of sample recycling procedures, which facilitated the re-
use of specimens, in the described NR technique mini-
Table 2 Intra- and interobserver reliability in the first step of mized costs. Observer subjectivity was minimized with
image analysis the implementation of strict and clear criteria to identify
Image processing* the cement profile and the MF. Therefore, the within
Intraobserver ICC† Interobserver ICC† and between observer variation were drastically reduced.
‡
ICC 1.000 1.000
95% CI Lower bound 1.000 1.000
Table 3 Intra- and interobserver agreement values
Upper bound 1.000 1.000
Intraobserver Interobserver
Two-way random effects model where both people effects and measures
effects are random SEMagreement† 0.707 0.8769
*
Placement of the component outlines at the position of best fit as conceived
SDC95%‡ 1.96 2.43
by the observer
† *
Type A intraclass correlation coefficients using an absolute All units are in pixels
†
agreement definition SEMagreement standard error of measurement agreement
‡ ‡
ICC intraclass correlation coefficient SDC95% smallest detectable change at 95% confidence intervalVillias et al. International Journal of Implant Dentistry (2021) 7:12 Page 10 of 14
Table 4 Tests of normality—distribution of differences between pixels of a well-defined line segment. Although in this
examiners study measurements were taken in pixels, ImageJ could
Shapiro–Wilk be easily calibrated to summarize meaningful units.
Statistic df Sig. In order to ensure reproducibility of results, reliability
Observer 1—1st 0.986 130 0,189 (ns) and agreement were tested with several different
Observer 1—2nd 0.986 130 0,189 (ns)
methods [52–54]. The Bland and Altman method facili-
tated the determination of the systematic error between
Observer 2 0.984 130 0,138 (ns)
observer 1 and each of the next three observers in this
Observer 3 0,995 130 0,954 (ns) study, the investigation of the existence of any system-
Observer 4 0,980 130 0,056 (ns) atic difference between the measurements, and the cal-
culation of the LoA95%. The estimated bias was the
The axial symmetry of the selected two-component mean value of the examined difference. The standard de-
samples seems to be a viable model to investigate the viation of the differences represented the random fluctu-
abutment-prosthesis system in similar studies. Addition- ations around the estimated bias.
ally, the setup of this experiment facilitated standardized There have been studies focusing on the reliability of
procedures. Furthermore, images were checked for arti- RT, comparing it with different methods. However, RT
facts upon acquisition, which minimized observation er- is different from the NR that has been used in this study,
rors and reduced variation. Moreover, the use of a hindering comparisons. Additionally, it was not within
program to automatically record and organize the data the scope of this study to compare results deriving from
eliminated the human factor from these procedures. different methods. Since the RT and NR methods share
The authors provide a detailed description of the im- certain similarities such as the idea of a medium that
plemented DIAS. MF was defined as the line segment represents the hollow space between fitted components,
between two easily recognizable and preselected points, it is worth mentioning their findings, which are summa-
located at the marginal edge of each component. Fur- rized in Table 5.
thermore, each component was accurately identified by Furthermore, Mai et al. 2017 studied the agreement
manually placing the corresponding outline on the pro- between the RT and a computer-aided replica technique
file of the sectioned replica of the crown-abutment as- utilizing an optical scanner [40]. The agreement estimate
sembly. Manual image analysis procedures might be for the marginal fit between the two methods was
considered alternative to automated procedures. How- 0.9999, and the precision estimate was 0.9838. Similarly,
ever, this step was the only source of variability, since high scores of correlation statistics were found in this
the final step was the execution of the measurement in study; however, the context of the correlations was
Fig. 4 Bland–Altman scatter plot of the difference between first observer’s average measurements versus the second observer’s (A). Y-axis:
Difference between the first observer and the second observer (A). X-axis: Average of their measures. Difference mean: Estimated bias between
the first observer and the second observer (A). LoA95% limits of agreement at the 95% confidence intervalVillias et al. International Journal of Implant Dentistry (2021) 7:12 Page 11 of 14 Fig. 5 Bland–Altman scatter plot of the difference between first observer’s average measurements versus the third observer’s. Y-axis: Difference between the first observer and the third observer (B). X-axis: Average of their measures. Difference mean: Estimated bias between the first observer and the third observer (B). LoA95% limits of agreement at the 95% confidence interval different, prohibiting comparisons with the aforemen- The experimental error was exceptionally small, in- tioned studies. In this study, differences between re- creasing confidence in measurements. DIAS demon- peated measurements were not significant, indicating strated excellent intra- and interobserver reliability. The test-retest reliability and low variance of recorded scores. ICC values were ≥ 0.99, suggesting excellent reliability Also, the correlation coefficients scores, for the repeated [46]. Similarly, high reliability scores have been observed measurements, revealed that scores between repeated by others that implemented image analysis in their study measurements were strongly correlated. Nevertheless, [44]. Some researchers argue that the SEM is a prefera- correlation tests are not appropriate to examine agree- ble measure of the quality of an assessment than is reli- ment between observers, because they cannot reveal ability, especially in studies with small sample sizes [54]. possible fixed bias [52]. The SEM depicts the quality of an evaluation free of Fig. 6 Bland–Altman scatter plot of the difference between first observer’s average measurements versus the fourth observer’s (C). Y-axis: Difference between the first observer and the fourth observer (C). X-axis: Average of their measures. Difference mean: Estimated bias between the first observer and the fourth observer (C) respectively. LoA95% limits of agreement at the 95% confidence interval
Villias et al. International Journal of Implant Dentistry       (2021) 7:12                                                    Page 12 of 14

Table 5 Summary of findings of other studies                                   exists, it might be revealed in a very large sample size
Statistics              Study                                                  and it would be so small that it would not have any
                        Rudolph et al. [36]             Boitelle et al. [31]   practical meaning eventually. The GPower software was
ICC intrarater          0.993                           0.991                  utilized for the post hoc calculation of sample size and
                                                                               power [56, 57]. The calculated sample size for paramet-
ICC interrater          0,978                           –
                                                                               ric tests with adequate power for such effect sizes was
Bias                    − 1.3*                          0.82*
                                                                               more than 2000 samples.
*In comparison to the triple scan method
                                                                                 Observers 2, 3, and 4 had, respectively, one, zero, and
                                                                               four outliers in their measurement differences from ob-
limitations such as sample size. The SEM both intra-                           servers 1’s averaged measurements. While observers 2 and
and interobserver in this study was exceptionally small                        4 had outliers in their measurement differences, they also
< 1%, which means that the presented methodology has                           had a better agreement with observers 1’s measurements
a very low level of measurement error, increasing there-                       than what observer 3 did. Additionally, the three Bland
fore the confidence in measurements. Otherwise stated,                         and Altman scatter plots show very good agreement with
there is more than 95% certainty that the true value is                        minimal observations laying outside the LoA boundaries.
within the ± 2% of the observed value.                                         Even differences within the ± 5 pixels range, which is lar-
  In this study, the intraobserver SDC95% was 1.67% and                        ger than the observed accuracy in this study, would not
interobserver SDC95% value was 2.07%. The meaning of                           have any practical significance. When transforming the
these values is that in 95% of cases the image analysis                        observed discrepancies in meaningful units (0.65 μm/pixel)
method could detect a difference in MF if it was larger                        at the calibrated images of this study, the ± 5pixels range
than about 2% of the mean MF of the total sample. The                          would represent a maximum discrepancy of about 6 μm,
minor differences between observer 1 and the other                             which does not seem to have practical value clinically [11].
three observers that took part in this study might be at-
tributed to the familiarization with the method. Obser-                        Limitations
ver 1 had greater experience with the method in                                This was a laboratory study, conducted in relatively stable
comparison with the other three observers despite the                          environmental conditions, which is not the case when ce-
fact that they had received adequate training and con-                         mentation takes place in vivo. The applied DIAS was based
ducted several trials before they run the analysis. An                         on identical and of favorable shape (axial symmetry)
additional reason might be the motivation to take accur-                       implant-components. Therefore, the method might be
ate measurements, because the suggested method is time                         problematic for fixed prostheses on natural teeth. The ana-
consuming, requires commitment and precision.                                  lysis was based on two-dimensional observations, posing an
  Due to the very low probability that different observers                     additional limitation. The examined DIAS was time con-
would perfectly agree and proceed with identical ratings                       suming and required familiarization of the researcher [37].
for a certain set of measurements, it was examined if differ-                    Further large-sized clinical trials are needed to verify
ent observers would give significantly different ratings with                  the results and to evaluate feasibility of application in
the DIAS. The Bland and Altman method was applied to                           clinical conditions. Combination of the method with pat-
estimate the likelihood of each observer to give a different                   tern recognition software could reduce the required time
measurement from those of observer 1. This approach is                         for an accurate placement of the outlines on the
often used to examine the limits of agreement between                          depicted cemented sample profile.
two different methods or different examiners [52, 53]. In
order to calculate with a certain level of precision the limits                Clinical relevance
of agreement between two examiners, a relatively large                         Since the NR technique is non-destructive, it has the po-
number of observations is required. The sample size in this                    tential to be implemented in both ex vivo and in vivo
study was N = 130, which was adequate and reasonably                           studies. The NR technique in combination with DIAS
large according to Bland’s recommendations.                                    has the advantage to provide a precision representation
  The bias in repeated measurements between exam-                              of the prosthesis-abutment assembly, as well as their ex-
iners did not exceed 0.2% (0.166%), and the paired-                            posed interface, contributing to the quality control of
samples t test could not reveal any bias (ns) at the stud-                     various steps of prosthesis manufacturing. The achieved
ied sample size, although the inability to show that a dif-                    marginal fit is one magnitude that can be measured with
ference exists at the acquired data is not a proof of                          the combination of these reliable techniques. However,
absence of such difference. Furthermore, the calculated                        accessing the margin in a manner to partially include
power of the t tests was small (10.47–37.29%); however,                        the surface of the abutment without traumatizing the
the effect sizes (r and dz) were also small [61, 62]. A                        delicate peri-implant tissues requires a reproducible
small effect size indicates that if a difference actually                      method that is yet to be verified clinically.
Villias et al. International Journal of Implant Dentistry (2021) 7:12 Page 13 of 14
In clinical situation, a NR might be an impression ex- GP: http://en.dent.uoa.gr/faculty-and-staff/dental-faculty/gregory-polyzois.
tending to the abutment surface. Due to the dimension html
stability of modern impression materials, the acquired
Funding
replica could be sectioned and studied post hoc without Part of this study was funded by IKY—State Scholarships Foundation of the
burdening the workflow of a busy practice. Furthermore, Hellenic Republic, Grant No. 10064/08-04-2011. IKY did not have any role in
image acquisition is a technical procedure which does the design of the study and collection, analysis, and interpretation of data
and in writing the manuscript.
not require medical personnel. Additionally, the DIAS is
also possible to be carried out by a non-medical Availability of data and materials
personnel as did in this study. The combination of NR The dataset used and analyzed during the current study are available from
the corresponding author on reasonable request (DIAS Validation raw DATA
and DIAS can be a valuable tool to evaluate the achieved
4 IJID.sav)
marginal fit of cemented crowns and assess the quality
of cementation, contributing to the quality improvement Ethics approval and consent to participate
of delivered prostheses. Not applicable
Consent for publication
Conclusions Not applicable
Within the limitations of this study, the presented DIAS
has excellent intra- and interobserver reliability, small Competing interests
The authors declare that they have no competing interests
measurement error and sensitivity level that covers the
relevant research needs. Additionally, with the prerequis- Received: 30 August 2020 Accepted: 20 January 2021
ite of axial symmetry of analyzed components, the
method could be applied to at least two designs. Fur-
References
thermore, the negative replica technique is a highly stan- 1. Teichmann M, Göckler F, Rückbeil M, Weber V, Edelhoff D, Wolfart S.
dardized and cost-effective approach for the evaluation Periodontal outcome and additional clinical quality criteria of lithium-
of marginal fit. The DIAS in combination with the NR disilicate restorations (Empress 2) after 14 years. Clin Oral Investig. 2019;23:
2153–64.
technique is an objective and reliable method with high 2. Laurent M, Scheer P, Dejou J, Laborde G. Clinical evaluation of the marginal
level of standardization, able to detect and quantify MF fit of cast crowns--validation of the silicone replica method. J Oral Rehabil.
observed in clinical practice. 2008;35:116–22.
3. Holmes JR, Bayne SC, Holland GA, Sulik WD. Considerations in measurement
Abbreviations of marginal fit. J Prosthet Dent. 1989;62:405–8.
ALD: Axial loading device; CSam: Two-component abutment Friadent 4. Pimenta MA, Frasca LC, Lopes R, Rivaldo E. Evaluation of marginal and
CeraBase D5.5mm; DIAS: Digital Image Analysis Sequence; Flo: Flick-off internal fit of ceramic and metallic crown copings using x-ray
technique; ICC: Intraclass correlation coefficient; Inc: Increased initial marginal microtomography (micro-CT) technology. J Prosthet Dent. 2015;114:223–8.
fit; LCo: Self-adhesive dual-curing luting composite; LED: Light-emitting 5. Wadhwani C, Goodwin S, Chung KH. Cementing an implant crown: a novel
diode; LoA: Bland and Altman method of limits of agreement; MF: Marginal measurement system using computational fluid dynamics approach. Clin
fit; Min: Original marginal fit; NR: Negative replica; ns: Not significant; Implant Dent Relat Res. 2016;18:97–106.
NSam: Simplified sample Novadental; RH: Relative humidity; RPD: Replica 6. Jacobs MS, Windeler AS. An investigation of dental luting cement solubility
production device; RT: Replica technique; SDC95%: Smallest detectable as a function of the marginal gap. J Prosthet Dent. 1991;65:436–42.
change at the 95% confidence level; SEM: Standard error of measurement; 7. Oyagüe RC, Sánchez-Turrión A, López-Lozano JF, Suárez-García MJ. Vertical
SID: Sample Intersection Device; SOB: Sample Observation Base; discrepancy and microleakage of laser-sintered and vacuum-cast implant-
SPSS: Statistical Package for the Social Sciences; TIF: Tagged Image File; supported structures luted with different cement types. J Dent. 2012;40:
USB: Universal Serial Bus; Wip: Wipe-off technique; ZnP: Zinc phosphate 123–30.
cement 8. Gonzalo E, Suárez MJ, Serrano B, Lozano JF. A comparison of the marginal
vertical discrepancies of zirconium and metal ceramic posterior fixed dental
prostheses before and after cementation. J Prosthet Dent. 2009;102:378–84.
Acknowledgements 9. Linkevicius T, Vindasiute E, Puisys A, Peciuliene V. The influence of margin
Part of this study was funded by IKY - State Scholarships Foundation of the location on the amount of undetected cement excess after delivery of cement-
Hellenic Republic, Grant No. 10064/08-04-2011. The authors thank Professor retained implant restorations. Clin Oral Implants Res. 2011;22(12):1379–84.
Dr. med. dent. Wilhelm Niedermeier, University of Cologne, Germany, 10. Kim EH, Lee DH, Kwon SM, Kwon TY. A Microcomputed tomography
Department of Prosthetic Dentistry, supervisor of Dr A. Villias’ Thesis, on evaluation of the marginal fit of cobalt-chromium alloy copings fabricated
which this article was partially based. by new manufacturing techniques and alloy systems. J Prosthet Dent. 2017;
117:393–9.
Authors’ contributions 11. Tosches NA, Brägger U, Lang NP. Marginal fit of cemented and screw-
All authors had substantially contributed to the conception of the work and retained crowns incorporated on the Straumann (ITI) Dental Implant
interpretation of the results, read and finally approved the version to be System: an in vitro study. Clin Oral Implants Res. 2009;20:79–86.
published, and agreed to be accountable for all aspects of the work. AV 12. Bronson MR, Lindquist TJ, Dawson DV. Clinical acceptability of crown
designed the study, acquired, and analyzed the data. Additionally, SK and HK margins versus marginal gaps as determined by pre-doctoral students and
helped with drafting the manuscript. GP and HK also revised critically the prosthodontists. J Prosthodont. 2005;14:226–32.
manuscript. 13. Oyagüe RC, Turrión AS, Toledano M, Monticelli F, Osorio R. In vitro vertical
misfit evaluation of cast frameworks for cement-retained implant-supported
Authors’ information partial prostheses. J Dent. 2009;37:52–8.
AV: www.linkedin.com/in/aristeidis-villias-5b880928 14. Tabesh M, Nejatidanesh F, Savabi G, Davoudi A, Savabi O, Mirmohammadi
SK: http://en.dent.uoa.gr/faculty-and-staff/dental-faculty/kourtis-stefanos.html H. Marginal adaptation of zirconia complete-coverage fixed dental
HK: http://en.dent.uoa.gr/faculty-and-staff/dental-faculty/karkazis-iraklis.html restorations made from digital scans or conventional impressions: aYou can also read