New Jersey 2022 State Report - County Health Rankings
←
→
Page content transcription
If your browser does not render page correctly, please read the page content below

2022 State Report
New Jersey

County Health Rankings 2022

    2022 County Health Rankings for the 21 Ranked Counties in New Jersey

                     County                           County                         County
                      Atlantic   18   20            Gloucester   14   11               Ocean    9    12
                      Bergen     4    4                Hudson    10   16              Passaic   16   18
                   Burlington    12   8             Hunterdon    2    2                Salem    20   19
                     Camden      19   15               Mercer    13   10            Somerset    3    3
                    Cape May     15   14             Middlesex   6    7               Sussex    5    6
                  Cumberland     21   21            Monmouth     7    5                Union    8    13
                        Essex    17   17                Morris   1    1               Warren    11   9

For more information on how these ranks are calculated, view the technical notes at the end of this report and visit
                                       www.countyhealthrankings.org

                                                                                   Stay Up-To-Date with County
                                                                                   Health Rankings & Roadmaps
                                                                                   For the latest updates on Rankings,
                                                                                   What Works for Health, Action
                                                                                   Learning Guides, and more visit
                                                                                   www.countyhealthrankings.org

                                                                                   See what we’re featuring on our
                                                                                   webinar series, what communities
                                                                                   are doing to improve health, and
                                                                                   how you can get involved!

                                           Page 2 | www.countyhealthrankings.org
County Health Rankings 2022

County Health Rankings & Roadmaps (CHR&R) brings actionable data, evidence, guidance, and stories to diverse leaders and
residents so people and communities can be healthier. The University of Wisconsin Population Health Institute created CHR&R
for communities across the nation, with funding from the Robert Wood Johnson Foundation.

 What are the County Health Rankings?                                 The County Health Rankings Model
 The Rankings help us understand what influences how                  The County Health Rankings Model illustrates a broad
 long and how well we live. They provide measures of the              vision for health. The model shows that policies and
 current overall health (health outcomes) of each county in           programs at the local, state, and federal levels play an
 all 50 states and the District of Columbia. Rankings data            important role in shaping health factors that in turn,
 include a variety of measures, such as high school                   influence a community’s health outcomes.
 graduation rates, access to nutritious foods, and the
                                                                      Health factors represent things that, if modified, can
 percent of children living in poverty, all of which impact
                                                                      improve length and quality of life. They are predictors of
 the future health of communities (health factors).
                                                                      how healthy our communities can be in the future. The
                                                                      four health factor areas in the model include Health
                                                                      Behaviors, Clinical Care, Social & Economic Factors, and
                                                                      Physical Environment.

                                                                      Health outcomes represent how healthy a county is right
                                                                      now. They reflect the physical and mental well-being of
                                                                      residents through measures representing the length and
                                                                      quality of life typically experienced in the community.

 We believe in a future where everyone has
 opportunities to be healthy and to thrive. Many factors
 impact how long and how well we live. Our data show
 how these factors shape community conditions, while
 highlighting the stark differences in health that stem
 from injustices and barriers to opportunity. Use our
 resources to take action toward better health for all.

 Communities use the Rankings to build support for local
 health improvement initiatives by engaging many
 sectors including public health, health care, business,
 policymakers, and local residents.

                                               Page 3 | www.countyhealthrankings.org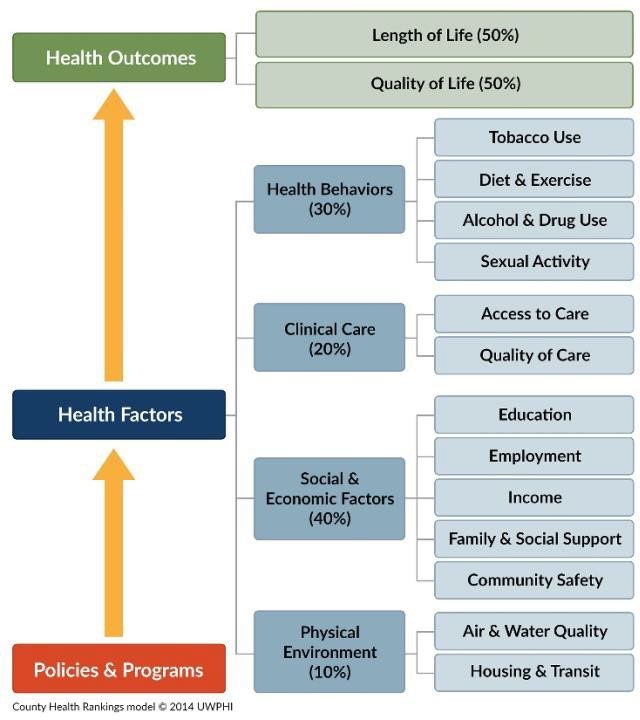
County Health Rankings 2022

Growing Healthy Places Means Ensuring Opportunities for All
Communities thrive when all people can be
healthy in their neighborhoods, schools, and
workplaces. CHR&R brings actionable data and
strategies to communities working to ensure
that healthy places are available to all. Pages 5
and 6 of this report highlight how health
outcomes and health factors differ by place
within New Jersey. On page 7, we outline how
economic security – or the ability of individuals,
households, and communities to meet basic
needs with dignity – is important to health. We
call attention to childcare cost burden as a
barrier to economic security and health.

Growing Community Power to Improve Health Equity
The Take Action to Improve Health section of the CHR&R website helps communities find tools and guidance to take action,
select evidence-informed strategies, and make lasting changes. Take Action to Improve Health is a hub for information to
help improve a community’s health and foster health equity. Find resources including:

  •   What Works for Health, a searchable menu of evidence-informed strategies.
  •   Action Learning Guides, self-directed learning modules that combine guidance, tools, and reflection activities.

Using Data to Improve Health Equity
Data show a persistent pattern across the country in
barriers to opportunity for people with lower incomes and
for people of color. Differences in the opportunities
                                                                         What Has Been Done Can Be Undone
available to different groups of people are related to                   Achieving health equity means eliminating unjust and
unfair policies and practices.                                           avoidable differences in access and opportunity. What can
                                                                         communities do to tackle unfair differences in how long
Our progress toward health equity will be                                and how well people live? Check out new strategies at
measured by how health disparities change over                           What Works for Health that can address past harms and
time. Visit www.countyhealthrankings.org to learn                        create conditions for thriving communities for everyone.
more about:
1. Health outcome and factor measures for your                           Many communities are mobilizing to harness the
    state and county.                                                    collective power of residents, organizations, and
2. Measures with data available by race and                              policymakers. They are working together to address past
    ethnicity to illuminate differences in                               and present policies that cause harm and are ensuring
    opportunities for health.                                            the growth of healthy places for all. To learn about these
                                                                         efforts, visit countyhealthrankings.org.
3. Additional data resources for New Jersey that
    provide information about health and
    opportunity by age group, gender, and zip
    code.

                                                 Page 4 | www.countyhealthrankings.org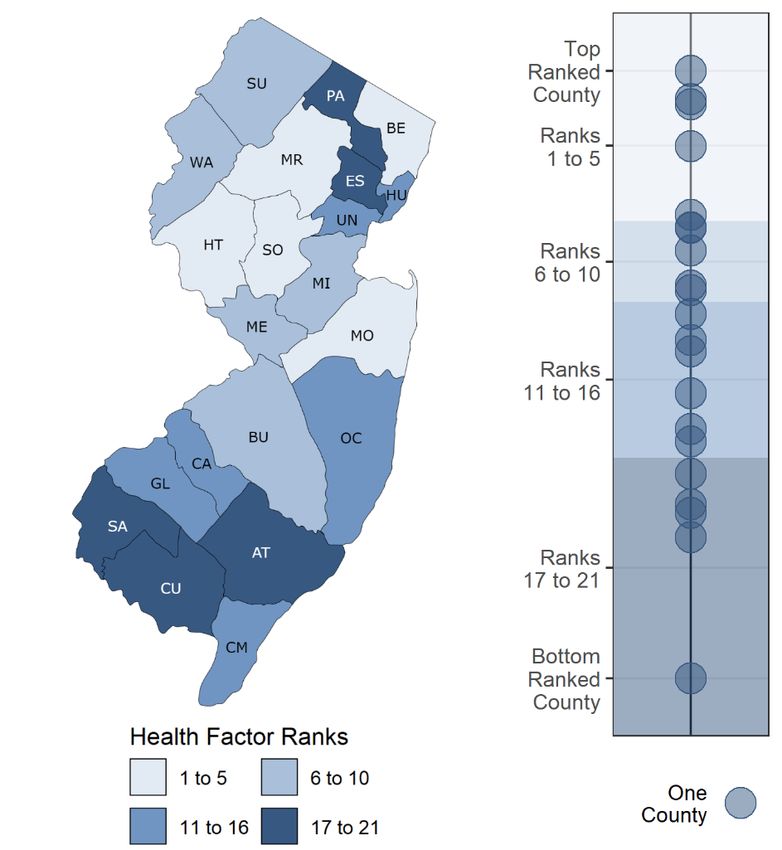
County Health Rankings 2022

What are Health Outcomes?
We measure length and quality of life to understand the health outcomes among counties in New Jersey.

                            Length of Life                                                Quality of Life
                              Premature death                                          Self-reported health status
                         (years of potential life lost
                               before age 75)                                  Percent of low birthweight newborns

How Do Counties Rank for Health Outcomes?
The green map shows New Jersey’s health
outcome rankings by county. The map is divided
into four quartiles with less color intensity
indicating better health outcomes. Specific county
ranks can be found in the table on page 2.

Detailed information on the measures and their
associated weights is available toward the end of
this report. Learn about how we calculate health
outcome ranks at
www.countyhealthrankings.org.

What Do Differences Between Ranks
Mean?
Counties are ordered by the health outcome rank,
with a top-ranked county (rank = 1) having the
best health outcome score. Ranks are good for
sparking conversations, but they do not show
differences in health within counties or describe
the magnitude of difference in community health
experienced between ranks. The chart next to the
map shows the spread of health outcome scores
(ranks) for each county (green circles) in New
Jersey. This graphic shows the size of the gaps              Figure 1. Health outcome ranks displayed using quartiles (map) and
between ranked counties. The background colors               underlying health outcome scores (chart)
correspond to the map legend.

                                                   Page 5 | www.countyhealthrankings.org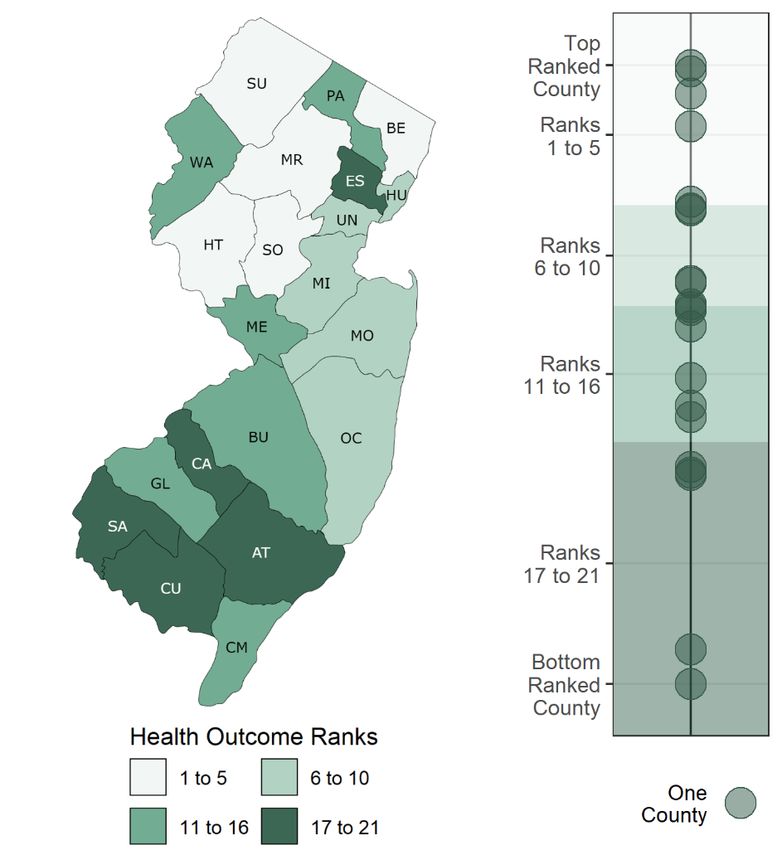
County Health Rankings 2022

What are Health Factors?
Health factors represent community conditions that we can change to improve health and opportunity, such as access to
quality education, living wage jobs, quality clinical care, nutritious foods, green spaces, and secure and affordable housing.
We measure four health factor areas.

     Health Behaviors                    Clinical Care                    Social and Economic          Physical Environment
                                                                                 Factors
         Tobacco use                                                              Education
                                        Access to care                                                     Air & water quality
        Diet & exercise
                                                                           Employment & income
      Alcohol & drug use                                                   Family & social support
                                        Quality of care                                                    Housing & transit
        Sexual activity                                                       Community safety

How Do Counties Rank for Health Factors?
The blue map shows New Jersey’s health factor
rankings by county. The map is divided into four
quartiles with less color intensity indicating better
health factors. Specific county ranks can be found
in the table on page 2.

Detailed information on the measures and their
associated weights is available toward the end of
this report. You can also learn about how we
calculate health factor ranks at
www.countyhealthrankings.org.

What Do Differences Between Ranks
Mean?
Counties are ordered by the health factor rank,
with a top-ranked county (rank = 1) having the best
health factor score. The chart next to the map
shows the spread of health factor scores (ranks) for
each ranked county (blue circles) in New Jersey.
This graphic shows the size of the gaps between
ranked counties. The background colors
correspond to the map legend.
                                                            Figure 2. Health factor ranks displayed using quartiles (map) and
                                                            underlying health factor scores (chart)

                                                 Page 6 | www.countyhealthrankings.org
County Health Rankings 2022
Economic Security is Key to Thriving Communities
Economic security enables families to cover basic needs such as housing, education, childcare, food, and medical care.
Each of these needs has demonstrated ties to health. However, economic security is not equally accessible to all people.
When a single household expense consumes the majority of a paycheck, it becomes difficult to meet competing needs
and can force households into tough decisions like choosing between quality childcare, paying rent, and purchasing
nutritious food. Individuals, households, and communities deserve the opportunity to meet basic needs with dignity.
Advancing a just recovery from the COVID-19 pandemic, and the layered impacts of racism and economic exclusion
requires intentional action to ensure all people and places have what they need to thrive. Check out policies and
programs that can be implemented in your community at What Works for Health.
Childcare Cost Burden in New Jersey and the U.S.
Childcare cost burden measures the percentage of household income needed to pay for childcare. When childcare is
affordable and accessible, it can support parents’ and guardians’ ability to participate in paid work and can provide
lifelong benefits to children. The U.S. Department of Health and Human Services’ benchmark suggests childcare is no
longer affordable if it exceeds 7% of a household’s income. This measure of childcare cost burden reflects the
experience of a household with two children.
Childcare Cost Burden in New Jersey Counties
The childcare cost burden among counties in New
Jersey ranges from 22% to 35%.
In Context
• Similar levels of childcare cost burden exist across
all levels of urbanization.
• Median household income varies by race and
ethnicity across New Jersey counties ranging
between $55,453 for Black households to
$126,232 for Asian households. These income
disparities demonstrate how economic security is
not equally accessible to all people living in New
Jersey.
Figure 3. Childcare cost burden in New Jersey by county
Childcare Cost Burden Across the U.S.
The typical cost burden of childcare among
counties in the U.S. is about 25% of household
income – meaning a quarter of every dollar
earned goes to paying for childcare. Families in
every state experience a childcare cost higher
than the 7% federal benchmark of affordability.
The childcare cost burden in New Jersey is 28%.
Figure 4. Childcare cost burden in the U.S. by state
Want to learn more? Visit our State Reports page at www.countyhealthrankings.org to interact with the data.
Page 7 | www.countyhealthrankings.orgCounty Health Rankings 2022
2022 County Health Rankings: National and New Jersey State Values for Ranked Measures
NJ NJ
Measure Description US NJ Minimum Maximum
HEALTH OUTCOMES
Premature death* Years of potential life lost before age 75 per 100,000 population (age-adjusted). 7,300 6,300 4,200 12,000
Poor or fair health Percentage of adults reporting fair or poor health (age-adjusted). 17% 16% 12% 25%
Poor physical health days Average number of physically unhealthy days reported in past 30 days (age-adjusted). 3.9 3.7 3.3 5.3
Poor mental health days Average number of mentally unhealthy days reported in past 30 days (age-adjusted). 4.5 3.8 3.7 4.9
Low birthweight* Percentage of live births with low birthweight (< 2,500 grams). 8% 8% 6% 10%
HEALTH FACTORS
HEALTH BEHAVIORS
Adult smoking Percentage of adults who are current smokers (age-adjusted). 16% 13% 12% 23%
Adult obesity Percentage of the adult population (age 18 and older) that reports a body mass index (BMI) 32% 26% 22% 40%
greater than or equal to 30 kg/m2 (age-adjusted).
Food environment index Index of factors that contribute to a healthy food environment, from 0 (worst) to 10 (best). 7.8 9.3 7.5 9.5
Physical inactivity Percentage of adults age 18 and over reporting no leisure-time physical activity (age- 26% 28% 20% 36%
adjusted).
Access to exercise Percentage of population with adequate access to locations for physical activity. 80% 91% 51% 100%
opportunities
Excessive drinking Percentage of adults reporting binge or heavy drinking (age-adjusted). 20% 16% 16% 21%
Alcohol-impaired driving Percentage of driving deaths with alcohol involvement. 27% 23% 15% 33%
deaths
Sexually transmitted Number of newly diagnosed chlamydia cases per 100,000 population. 551.0 423.2 141.6 829.9
infections
Teen births* Number of births per 1,000 female population ages 15-19. 19 11 2 32
CLINICAL CARE
Uninsured Percentage of population under age 65 without health insurance. 11% 9% 5% 14%
Primary care physicians Ratio of population to primary care physicians. 1,310:1 1,170:1 2,840:1 810:1
Dentists Ratio of population to dentists. 1,400:1 1,140:1 2,970:1 750:1
Mental health providers Ratio of population to mental health providers. 350:1 380:1 1,290:1 110:1
Preventable hospital stays* Rate of hospital stays for ambulatory-care sensitive conditions per 100,000 Medicare 3,767 3,892 2,590 5,738
enrollees.
Mammography screening* Percentage of female Medicare enrollees ages 65-74 that received an annual 43% 41% 34% 47%
mammography screening.
Flu vaccinations* Percentage of fee-for-service (FFS) Medicare enrollees that had an annual flu vaccination. 48% 51% 38% 57%
SOCIAL & ECONOMIC FACTORS
High school completion Percentage of adults ages 25 and over with a high school diploma or equivalent. 89% 90% 80% 95%
Some college Percentage of adults ages 25-44 with some post-secondary education. 67% 71% 41% 82%
Unemployment Percentage of population ages 16 and older unemployed but seeking work. 8.1% 9.8% 7.2% 17.8%
Children in poverty* Percentage of people under age 18 in poverty. 16% 13% 4% 25%
Income inequality Ratio of household income at the 80th percentile to income at the 20th percentile. 4.9 5.1 3.7 6.8
Children in single-parent Percentage of children that live in a household headed by a single parent. 25% 22% 11% 35%
households
Social associations Number of membership associations per 10,000 population. 9.2 8.7 5.6 13.4
Violent crime Number of reported violent crime offenses per 100,000 population. 386 253 42 606
Injury deaths* Number of deaths due to injury per 100,000 population. 76 63 44 115
PHYSICAL ENVIRONMENT
Air pollution - particulate Average daily density of fine particulate matter in micrograms per cubic meter (PM2.5). 7.5 8.1 5.9 11.1
matter
Drinking water violations+ Indicator of the presence of health-related drinking water violations. 'Yes' indicates the N/A N/A N/A N/A
presence of a violation, 'No' indicates no violation.
Severe housing problems Percentage of households with at least 1 of 4 housing problems: overcrowding, high 17% 21% 14% 29%
housing costs, lack of kitchen facilities, or lack of plumbing facilities.
Driving alone to work* Percentage of the workforce that drives alone to work. 75% 70% 37% 83%
Long commute - driving Among workers who commute in their car alone, the percentage that commute more than 37% 43% 27% 59%
alone 30 minutes.
*Indicates subgroup data by race and ethnicity is available; +Not available in all states
Page 8 | www.countyhealthrankings.orgCounty Health Rankings 2022
2022 County Health Rankings: Ranked Measure Sources and Years of Data
Measure Weight Source Years of Data
HEALTH OUTCOMES
Length of Life Premature death* 50% National Center for Health Statistics - Mortality Files 2018-2020
Quality of Life Poor or fair healthⱡ 10% Behavioral Risk Factor Surveillance System 2019
Poor physical health daysⱡ 10% Behavioral Risk Factor Surveillance System 2019
Poor mental health daysⱡ 10% Behavioral Risk Factor Surveillance System 2019
Low birthweight* 20% National Center for Health Statistics - Natality files 2014-2020
HEALTH FACTORS
HEALTH BEHAVIORS
Tobacco Use Adult smokingⱡ 10% Behavioral Risk Factor Surveillance System 2019
Diet and Exercise Adult obesityⱡ 5% Behavioral Risk Factor Surveillance System 2019
Food environment index 2% USDA Food Environment Atlas, Map the Meal Gap from 2019
Feeding America
Physical inactivityⱡ 2% Behavioral Risk Factor Surveillance System 2019
Access to exercise opportunities 1% Business Analyst, ESRI, YMCA & US Census Tigerline Files 2010 & 2021
Alcohol and Drug Use Excessive drinkingⱡ 2.5% Behavioral Risk Factor Surveillance System 2019
Alcohol-impaired driving deaths 2.5% Fatality Analysis Reporting System 2016-2020
Sexual Activity Sexually transmitted infections 2.5% National Center for HIV/AIDS, Viral Hepatitis, STD, and TB 2019
Prevention
Teen births* 2.5% National Center for Health Statistics - Natality files 2014-2020
CLINICAL CARE
Access to Care Uninsured 5% Small Area Health Insurance Estimates 2019
Primary care physicians 3% Area Health Resource File/American Medical Association 2019
Dentists 1% Area Health Resource File/National Provider Identification file 2020
Mental health providers 1% CMS, National Provider Identification 2021
Quality of Care Preventable hospital stays* 5% Mapping Medicare Disparities Tool 2019
Mammography screening* 2.5% Mapping Medicare Disparities Tool 2019
Flu vaccinations* 2.5% Mapping Medicare Disparities Tool 2019
SOCIAL & ECONOMIC FACTORS
Education High school completion 5% American Community Survey, 5-year estimates 2016-2020
Some college 5% American Community Survey, 5-year estimates 2016-2020
Employment Unemployment 10% Bureau of Labor Statistics 2020
Income Children in poverty* 7.5% Small Area Income and Poverty Estimates 2020
Income inequality 2.5% American Community Survey, 5-year estimates 2016-2020
Family and Social Support Children in single-parent households 2.5% American Community Survey, 5-year estimates 2016-2020
Social associations 2.5% County Business Patterns 2019
Community Safety Violent crime 2.5% Uniform Crime Reporting - FBI 2014 & 2016
Injury deaths* 2.5% National Center for Health Statistics - Mortality Files 2016-2020
PHYSICAL ENVIRONMENT
Air and Water Quality Air pollution - particulate matter 2.5% Environmental Public Health Tracking Network 2018
Drinking water violations+ 2.5% Safe Drinking Water Information System 2020
Housing and Transit Severe housing problems 2% Comprehensive Housing Affordability Strategy (CHAS) data 2014-2018
Driving alone to work* 2% American Community Survey, 5-year estimates 2016-2020
Long commute - driving alone 1% American Community Survey, 5-year estimates 2016-2020
*Indicates subgroup data by race and ethnicity is available; +Not available in all states; ⱡ2018 data for New Jersey.
Page 9 | www.countyhealthrankings.orgCounty Health Rankings 2022
2022 County Health Rankings: Additional Measure Sources and Years of Data
Measure Source Years of Data
HEALTH OUTCOMES
Length of Life COVID-19 age-adjusted mortality National Center for Health Statistics - Mortality Files 2020
Life expectancy* National Center for Health Statistics - Mortality Files 2018-2020
Premature age-adjusted mortality* National Center for Health Statistics - Mortality Files 2018-2020
Child mortality* National Center for Health Statistics - Mortality Files 2017-2020
Infant mortality* National Center for Health Statistics - Mortality Files 2014-2020
Quality of Life Frequent physical distress ⱡ Behavioral Risk Factor Surveillance System 2019
Frequent mental distress ⱡ Behavioral Risk Factor Surveillance System 2019
Diabetes prevalence ⱡ Behavioral Risk Factor Surveillance System 2019
HIV prevalence+ National Center for HIV/AIDS, Viral Hepatitis, STD, and 2019
TB Prevention
HEALTH FACTORS
HEALTH BEHAVIORS
Diet and Exercise Food insecurity Map the Meal Gap 2019
Limited access to healthy foods USDA Food Environment Atlas 2019
Alcohol and Drug Use Drug overdose deaths* National Center for Health Statistics - Mortality Files 2018-2020
Motor vehicle crash deaths* National Center for Health Statistics - Mortality Files 2014-2020
Other Health Behaviors Insufficient sleep Behavioral Risk Factor Surveillance System 2018
CLINICAL CARE
Access to Care Uninsured adults Small Area Health Insurance Estimates 2019
Uninsured children Small Area Health Insurance Estimates 2019
Other primary care providers CMS, National Provider Identification 2021
SOCIAL & ECONOMIC FACTORS
Education High school graduation+ EDFacts 2018-2019
Disconnected youth American Community Survey, 5-year estimates 2016-2020
Reading scores*+ Stanford Education Data Archive 2018
Math scores*+ Stanford Education Data Archive 2018
School segregation National Center for Education Statistics 2020-2021
School funding adequacy+ School Finance Indicators Database 2019
Income Gender pay gap American Community Survey, 5-year estimates 2016-2020
Median household income* Small Area Income and Poverty Estimates 2020
Living wage The Living Wage Calculator 2021
Children eligible for free or reduced price National Center for Education Statistics 2019-2020
lunch+
Family and Social Support Residential segregation - Black/White American Community Survey, 5-year estimates 2016-2020
Residential segregation - non-White/White American Community Survey, 5-year estimates 2016-2020
Childcare cost burden The Living Wage Calculator, Small Area Income and 2021 & 2020
Poverty Estimates
Childcare centers Homeland Infrastructure Foundation-Level Data (HIFLD) 2021
Community Safety Homicides* National Center for Health Statistics - Mortality Files 2014-2020
Suicides* National Center for Health Statistics - Mortality Files 2016-2020
Firearm fatalities* National Center for Health Statistics - Mortality Files 2016-2020
Juvenile arrests+ Easy Access to State and County Juvenile Court Case 2019
Counts
PHYSICAL ENVIRONMENT
Housing and Transit Traffic volume EJSCREEN: Environmental Justice Screening and 2019
Mapping Tool
Homeownership American Community Survey, 5-year estimates 2016-2020
Severe housing cost burden American Community Survey, 5-year estimates 2016-2020
Broadband access American Community Survey, 5-year estimates 2016-2020
*Indicates subgroup data by race and ethnicity is available; +Not available in all states; ⱡ2018 data for New Jersey.
See additional contextual demographic information and measures online at www.countyhealthrankings.org
Page 10 | www.countyhealthrankings.orgCounty Health Rankings 2022
Glossary of Terms, Technical Notes, and FAQs
Glossary of Terms
Health equity: Assurance of conditions for optimal health for all people. Achieving health equity requires valuing all
individuals and populations equally, recognizing and rectifying historical injustice, and providing resources according to
need.
Health inequity: Differences in health factors or outcomes that are systematic, avoidable, unnecessary, unfair, and unjust.
Health disparities: The numerical or statistical differences in health outcomes, such as mortality rate differences. Reducing
and ultimately eliminating disparities in health and its determinants of health is how we measure progress toward health
equity.
Technical Notes
• Figures 1 and 2 depict each county as a single, semi-transparent circle. Counties with very similar values are
displayed as overlapping circles having greater color saturation. Similarly, circles representing states may be
overlapping in Figure 4.
• The state and national values for childcare cost burden represent the median of counties within the state and
nation, respectively.
FAQs
How does CHR&R select evidence-informed solutions?
Evidence-informed solutions are supported by robust studies or reflect recommendations made by experts. To learn more
about our evidence analysis methods, visit What Works for Health.
How does CHR&R rank counties?
To calculate the ranks, we first standardize each of the measures using z-scores. Z-scores allow us to combine multiple
measures because the measures are now on the same scale. The ranks are then calculated based on weighted sums of the
measure z-scores within each state to create an aggregate z-score. The county with the best aggregate z-score (healthiest)
gets a rank of #1 for that state. The aggregate z-scores are graphed next to the maps for health outcomes and health factors
on pages 5 and 6 to show the distribution of the values that contribute to the rank. To see more detailed information on
rank calculations please visit Our Methods section in Explore Health Rankings at:countyhealthrankings.org.
How did the 7% benchmark for childcare affordability originate?
The Department of Health and Human Services published a 2016 update to rules and regulations for the Child Care and
Development Fund (CCDF) program, which helps cover childcare costs for children from low-income households. The
updated rules established a federal benchmark for an enrolled family’s childcare co-payments not to be considered
affordable if costs exceed 7% of household income. The benchmark has since been applied outside of the context of the
CCDF program to indicate that low- and middle-income families should not spend more than 7% of their income on
childcare for it to be considered affordable.
How does CHR&R define county levels of urbanization?
We define levels of urbanization as: Rural (non-metropolitan counties with less than 50,000 people); Smaller Metro
(counties within a metropolitan statistical area (MSA) with between 50,000 and 1 million people); Large Suburban Metro
(non-central fringe counties within an MSA with more than 1 million people); Large Urban Metro (central urban core
counties within an MSA with more than 1 million people).
How does CHR&R define racial and ethnic groups?
We recognize that “race” or “ethnicity” are social categories. Society may identify individuals based on their physical
appearance or perceived cultural ancestry, as a way of characterizing individuals' value. These categories are not based on
biology or genetics. A strong and growing body of empirical research provides support for the fact that genetic factors are
not responsible for racial differences in health factors and very rarely for health outcomes.
We are bound by data collection and categorization of race and ethnicity according to the U.S. Census Bureau definitions, in
adherence with the 1997 Office of Management and Budget standards. Our analyses also do not capture those reporting
more than one race, of “some other race”, or who do not report their race. This categorization can mask variation within
racial and ethnic groups and can hide historical context that underlies health differences.
How does CHR&R define gender?
We recognize that while the terms “gender” and “sex” are often used interchangeably, they do not represent the same
concept. Sex is generally assigned at birth based on observed anatomy, while gender is a social construct wherein certain
tendencies or behaviors are assigned by society to labels of masculine or feminine. We know that neither gender nor sex
are binary constructs and that people living intersectional identities (e.g., transgender women) experience compounding
power differentials, which are not captured in a binary delineation between men and women.
Page 11 | www.countyhealthrankings.orgCounty Health Rankings 2022
Credits
Report Authors:
Christine Muganda, PhD
Jess Hoffelder, MPH
Hannah Olson-Williams
Keith Gennuso, PhD
Marjory Givens, PhD, MSPH
Sheri Johnson, PhD
Research Assistance:
Jennifer Robinson Ganhua Lu, PhD Elizabeth Blomberg, PhD
Matthew Rodock, MPH Molly Burdine Nicholas Schmuhl, PhD
Anne Roubal, PhD Eunice Park, MIS Suryadewi Nugraheni, MD, MA, PhD
With key contributions from:
Michael Stevenson, MPH
Lindsay Garber, MPA
Beth Silver, MCM
Cathy Vos
and the entire County Health Rankings & Roadmaps Team
Data collaborations :
• The Centers for Disease Control and Prevention
• Dr. Amy Glasmeier, PhD and The Living Wage Calculator at the Massachusetts Institute of Technology
Communications & website support:
• Burness
• Forum One
This work is made possible with support from the Robert Wood Johnson Foundation.
Recommended citation: University of Wisconsin Population Health Institute. County Health Rankings New Jersey State
Report 2022.
Talk to a Team Member:
Have questions about your data?
Need help finding an evidence-informed strategy?
Looking for more information on how to take action?
CHR&R team members are available to help you navigate the many resources we have available to support you
on your journey to create healthy, equitable communities.
To contact us, please go to www.countyhealthrankings.org/contact-us. We’re here to help!
University of Wisconsin Population Health Institute, County Health Rankings & Roadmaps
610 Walnut St, #524, Madison, WI 53726 | (608) 265-8240 | info@countyhealthrankings.org
Page 12 | www.countyhealthrankings.orgYou can also read