NLRP3 in the Cerebrospinal Fluid as a Potential Biomarker for the Diagnosis and Prognosis of Community-Acquired Bacterial Meningitis in Adults
←
→
Page content transcription
If your browser does not render page correctly, please read the page content below
ORIGINAL RESEARCH
                                                                                                                                             published: 25 January 2022
                                                                                                                                       doi: 10.3389/fcimb.2021.803186

                                             NLRP3 in the Cerebrospinal Fluid
                                             as a Potential Biomarker for the
                                             Diagnosis and Prognosis of
                                             Community-Acquired Bacterial
                            Edited by:
                                             Meningitis in Adults
                       Paras K. Anand,
              Imperial College London,       Zhe Gong 1, Chaopeng Zhang 2, Yanfei Li 1, Lijun Jing 1, Ranran Duan 1, Yaobing Yao 1,
                       United Kingdom        Junfang Teng 1 and Yanjie Jia 1*
                      Reviewed by:
                                             1 Department of Neurology, The First Affiliated Hospital of Zhengzhou University, Zhengzhou, China, 2 Department of
                       Dragan Lepur,
     University Hospital for Infectious      Neurology, The Peoples’ Hospital of Dengfeng, Dengfeng, China
Diseases “Dr Fran Mihaljevic”, Croatia
                      Xiangru Wang,
                Huazhong Agricultural
                                             Objective: To discover the levels of NLR family pyrin domain-containing 3 (NLRP3) in
                    University, China        the cerebrospinal fluid (CSF) from adult patients with community-acquired bacterial
                    *Correspondence:         meningitis (CABM).
                             Yanjie Jia
              jiayanjie1971@zzu.edu.cn       Methods: We enrolled 34 patients with CABM, 20 patients with viral meningitis (VM), and 25
                                             patients with non-inflammatory neurological disease. Data on standard clinical parameters,
                   Specialty section:        scores, and outcomes were obtained from clinical records, and inflammasome levels in the
         This article was submitted to
       Microbes and Innate Immunity,
                                             CSF were measured by an enzyme-linked immunosorbent assay. The area under the receiver
               a section of the journal      operating characteristic curve (AUROC) was used to quantify the diagnostic and prognostic
              Frontiers in Cellular and
                                             performance of CSF NLRP3 as a biomarker of CABM.
                Infection Microbiology

         Received: 27 October 2021           Results: The levels of NLRP3 were elevated in the CSF of patients with CABM, but levels
       Accepted: 30 December 2021            for ASC, caspase-1, or other inflammasomes did not vary significantly. CSF NLRP3 was
        Published: 25 January 2022
                                             positively correlated with clinical severity and with the neutrophil-to-lymphocyte ratio
                                 Citation:
Gong Z, Zhang C, Li Y, Jing L, Duan R,
                                             (NLR), platelet-to-lymphocyte ratio (PLR), lymphocyte count, albumin quotient (Qalb), and
Yao Y, Teng J and Jia Y (2022) NLRP3         immunoglobulin G quotient (QIgG). Patients with unfavorable outcomes had higher levels
in the Cerebrospinal Fluid as a Potential
                                             of NLRP3 in the CSF, which were correlated with several blood indicators, including NLR,
        Biomarker for the Diagnosis and
     Prognosis of Community-Acquired         PLR, and lymphocyte and monocyte counts.
           Bacterial Meningitis in Adults.
Front. Cell. Infect. Microbiol. 11:803186.
                                             Conclusions: Our results suggested that the level of CSF NLRP3 could represent the
       doi: 10.3389/fcimb.2021.803186        severity of CABM in adults. CSF NLRP3 may be a good biomarker for the diagnosis of

Frontiers in Cellular and Infection Microbiology | www.frontiersin.org              1                                       January 2022 | Volume 11 | Article 803186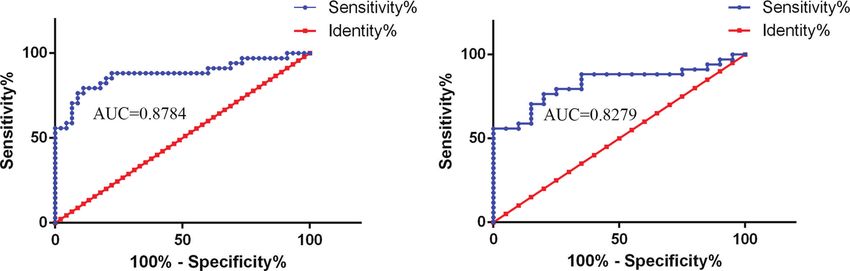
Gong et al.                                                                                                                     CSF NLRP3’s Value in CABM

                                            CABM and for the discrimination between CABM and VM. It may also be a better
                                            biomarker for predicting the prognosis of adult patients with CABM when compared to the
                                            NLR or the lymphocyte and monocyte counts.
                                            Keywords: community-acquired bacterial meningitis, NLRP3, cerebrospinal fluid, clinical severity, prognosis

INTRODUCTION                                                                       whether NLRP3 levels from the CSF could be used as a diagnostic
                                                                                   and prognostic biomarker for bacterial meningitis in clinical practice.
Community-acquired bacterial meningitis (CABM) is a rare
disease affecting all age groups, with an annual incidence of
approximately three cases per 100,000 adults in developed                          MATERIALS AND METHODS
countries (Bijlsma et al., 2016). Despite advances in critical
care, which include early administration of antibiotics and                        Patient Characteristics and
corticosteroids, bacterial meningitis still has a high mortality                   Inclusion Criteria
rate (15%–30%) and is linked to a high risk of developing                          This retrospective cohort study enrolled 34 patients with CABM,
neurological deficits (Glimåker et al., 2015). The poor prognosis                   20 patients with VM, and 25 patients with non-inflammatory
and neurological sequelae of severe bacterial meningitis are                       neurological disease treated at the Department of Neurology
caused both by the infection itself and by the inflammatory                         of the First Affiliated Hospital of Zhengzhou University from
response from the host (Tubiana et al., 2020). The latter                          June 2019 to June 2021. The study design was approved by the
involves activation of both cellular and non-cellular                              Zhengzhou University Ethics Committee. The inclusion criteria
components of the immune system, including production of                           were as follows: (1) age ≥18 years; (2) disease first diagnosed at
pro-inflammatory cytokines, complement-mediated leukocyte                           the Department, without previous antibacterial or anti-
recruitment, and microglial activation (Koelman et al., 2019;                      inflammatory treatment; and (3) confirmed bacterial meningitis
Loughran et al., 2019).                                                            by positive CSF microscopy/culture or high clinical suspicion of
    The activation of toll-like receptors (TLRs) is a key event in                 meningitis due to next-generation sequencing (NGS)-positive
meningeal inflammation and a pivotal factor for meningitis-                         detection and increased cell count and/or decreased blood/
associated tissue damage (Koedel, 2009). In addition, the levels of                glucose ratio in the CSF (Grønhøj et al., 2021). We excluded
several inflammatory cytokines, such as interleukin (IL)-6, tumor                   patients with hospital-acquired meningitis, those presenting a
necrosis factor (TNF)-a, IL-1b, and IL-18, are increased in the                    recent head injury (within 1 month) or who had undergone
cerebrospinal fluid (CSF) of patients affected by bacterial                         neurosurgery, those carrying neurosurgical devices, and those
meningitis (Geldhoff et al., 2013; Chong et al., 2018). Among                      affected by chronic meningitis. The etiologies of CABM included
them, IL-1b and IL-18 are the main downstream effectors of                         ten cases (29.41%) of Streptococcus pneumoniae, six
inflammasome activation (Schroder and Tschopp, 2010; Gong                           cases (17.65%) of Klebsiella pneumoniae, four cases (11.76%) of
et al., 2018), and therefore may also be involved in the                           Escherichia coli, four cases (11.76%) of Listeria monocytogenes,
neuroinflammatory response to bacterial meningitis.                                 two cases (5.88%) of Staphylococcus aureus, one case (2.94%) of
    The inflammasome is a complex composed of a variety of                          Bacteroides fragilis, one case (2.94%) of human staphylococcal
proteins that initiate the activation of caspase-1 leading to the                  human subspecies, one case (2.94%) of acne propionic acid
cleavage of the pro-inflammatory cytokines IL-1b and IL-18 (Patel,                  bacillus, one case (2.94%) of constellation streptococcus
2017). Four main types of inflammasomes have been described:                        constellation subspecies, one case (2.94%) of Streptococcus suis,
nucleotide-binding leucine-rich repeat (NLR) family pyrin domain                   one case (2.94%) of Streptococcus pharyngitis, and one case
containing 1 (NLRP1), NLRP3, NLR family CARD domain                                (2.94%) of Enterobacter cloacae.
containing 4 (NLRC4), and absent in melanoma 2 (AIM2) (Gross                           Patients from the VM group were diagnosed by NGS detection
et al., 2011). The NLRP3 inflammasome is the most extensively                       of viral DNA/RNA in the CSF. The etiologies of VM included
studied but also the most elusive in central nervous system diseases               eight cases of herpes simplex virus, five cases of Epstein–Barr
(Shao et al., 2018). Previous studies found that the inflammasome                   virus, three cases of cytomegalovirus, two cases of varicella-zoster
proteins NLRP3 and apoptosis-associated speck-like protein                         virus, and two cases of Coxsackie virus. The control group
containing a CARD (ASC) play important roles in the regulation                     consisted of patients diagnosed with other non-inflammatory
of the systemic inflammatory response and development of cerebral                   neurological diseases, including dizziness, headache, and hysteria.
damage during pneumococcal meningitis (Geldhoff et al., 2013).
However, NLRP3 levels in the CSF from patients with bacterial                      Data Collection
meningitis have not been determined.                                               Data collected from all patients included medical history
    The aims of this study were to measure NLRP3 levels in the CSF                 (hypertension, diabetes, or other co-morbidities), Glasgow
from patients with CABM, viral meningitis (VM), and non-                           Coma Scale (GCS) on admission, clinical symptoms on
inflammatory neurological disease; to characterize the correlation                  admission, laboratory findings on admission (CSF and blood
between clinical outcomes and NLRP3 levels; and to determine                       data, and causative pathogen identity), clinical course, outcome,

Frontiers in Cellular and Infection Microbiology | www.frontiersin.org         2                                   January 2022 | Volume 11 | Article 803186
Gong et al. CSF NLRP3’s Value in CABM
neurological status at discharge [determined by the Glasgow expressed as mean ± standard deviation. The Kruskal–Wallis test
Outcome Scale (GOS)] or 3 months after onset [determined by was used for comparison between groups. An independent
the modified Rankin Scale (mRS) score], and treatment. Two Student’s t-test was used to compare data between two groups.
experienced neurologists independently evaluated the CABM The median (interquartile range) was used to characterize the
severity according to the GCS scores at admission, the GOS results for non-normally distributed data, and the Mann–
scores at discharge, and the mRS scores at follow-up. Favorable Whitney U test was used in this case to perform comparisons
outcomes were defined as those presenting an mRS score in the between groups. Categorical variables were expressed as
0–2 range, and unfavorable outcomes were defined as those percentage of the total number of cases and were compared
within the 3–5 range (Rankin, 1957). All methods were carried using the Chi-square test or Fisher’s exact test. Univariate and
out in accordance with relevant regulations, and all participants multivariate analyses were used to identify the factors that could
signed written informed consent as a prerequisite for enrolment. distinguish between the groups. Correlations between the
profiles were assessed using Spearman’s rank analysis or
CSF Collection Pearson’s correlation analysis, as appropriate. The area under
CSF was collected from all patients on the date of venous blood the receiver operating characteristic curve (AUROC) was used to
collection. After a standard lumbar puncture, 15 ml of CSF was quantify the performance of biomarkers for a given diagnosis.
collected. From this sample, 10 ml was used for routine The cutoff values for outcome prediction were selected on the
biochemical and cytological tests, NGS, in vitro culture, and basis of the highest sum of sensitivity and specificity. Statistical
electrophoresis tests. The remaining volume was immediately significance was set at p < 0.05.
centrifuged at 4000 g for 10 min at 4°C. The supernatant was
then transferred into polypropylene tubes and stored at −80°C.
Sample treatment was completed within 60 min. RESULTS
Laboratory Data Demographics, Clinical Features, and
All blood samples collected were tested for biomarkers at the Laboratory Data
Biochemistry Laboratory of the First Affiliated Hospital of The demographic data, clinical features, and laboratory data of
Zhengzhou University. Fasting venous blood was drawn from CABM patients (n = 34), VM patients (n = 20), and CTLs (n =
all patients on the morning of the second day after admission. 25) are shown in Table 1. Compared to the VM cohort, fever
Blood samples were used for routine blood tests and for the (100%), neck stiffness (85.29%), dyssomnia (50%), and mental
measurement of inflammatory markers. For routine CSF and behavioral disorders (44.12%) were the most common
analysis, humoral cells were counted and classified via symptoms registered in the CABM group. The clinical
instrument analysis. In parallel, the centrifuge precipitation symptom score (GCS on admission) and the prognostic score
method was used for manual microscopic examination, (GOS at discharge and mRS 3 months after onset) from
classification, and reexamination. The albumin quotient (Qalb) CABM patients were significantly higher than those from
and immunoglobulin G quotient (QIgG) were detected via VM patients.
immunoelectrophoresis. CSF second-generation sequencing The CABM group exhibited a significant increase in the
was performed via high-throughput analysis by the Beijing neutrophil count, neutrophil-to-lymphocyte ratio (NLR),
Institute of Genomics (Beijing, P. R. China). platelet-to-lymphocyte ratio (PLR), and levels of C-reactive
protein (CRP) and procalcitonin (PCT), while at the same time
Determination of CSF Inflammasome exhibiting a significant decrease in the lymphocyte count and the
Levels lymphocyte-to-monocyte ratio (LMR) when compared with the
Commercial sandwich enzyme-linked immunosorbent assay other two groups (Table 1). The CABM group also exhibited a
(ELISA) kits were used to measure inflammasome levels in the significant increase in the white blood cell count and protein
CSF. Target proteins included NLRP1 (CSB-EL015864HU), quantity in the CSF, and a significant decrease in glucose levels
NLRP3 (CSB-E15885h), NLRC4 (CSB-EL015862HU), AIM2 relative to the VM and CTL groups (Table 1).
(CSB-EL001499HU), ASC (CSB-EL019114HU), and caspase-1
(CSB-E13025h). All kits were manufactured by Cusabio Increased Levels of NLRP3 in CSF from
(Wuhan, P. R. China). Assays were performed according to the Patients With CABM
manufacturer’s instructions. All standards and samples were The results of the ELISA tests performed to measure the levels of
measured in duplicate, and CSF samples were not diluted. CSF NLRP1, NLRP3, NLCR4, AIM2, ASC, and caspase-1 are
Optical densities were determined using a microplate reader shown in Figure 1. Mean CSF NLRP3 level (ng/ml) was 2,017 ±
(Bio-Rad Laboratories, CA, USA). 1,421 for the CABM group, 709.8 ± 290.8 for the VM group, and
505.7 ± 163.9 for the control group. The values for CSF NLRP3 in
Statistical Analysis the CABM group were significantly higher than those in the VM
Statistical analysis was performed using the SPSS software (p < 0.001, Figure 1B) and control (p < 0.001, Figure 1B) groups,
package (version 26.0; IBM, Armonk, NY, USA). The data but there were no significant differences between the VM and
were tested for normality, and normally distributed data were control groups (Figure 1B). The levels of NLRP1, NLRC4, AIM2,
Frontiers in Cellular and Infection Microbiology | www.frontiersin.org 3 January 2022 | Volume 11 | Article 803186Gong et al. CSF NLRP3’s Value in CABM
TABLE 1 | Demographics, clinical features, and laboratory data of patients.
CABM (n = 34) VM (n = 20) CTL (n = 25)
Age (years) 41.5 ± 13.76 41.95 ± 18.14 45.596 ± 16.2
Gender (male/female) 26/8 12/8 14/11
Psychiatric and neurologic symptoms
Headache 27/34 (79.41%) 11/20 (55%) –
Fever 34/34 (100%) 8/20 (40%)**** –
Vomit 14/34 (41.18%) 7/20 (35%) –
Neck stiffness 29/34 (85.29%) 6/20 (30%)**** –
Disturbance of consciousness 12/34 (35.29%) 12/20 (60%) –
Mental and behavioral disorder 15/34 (44.12%) 2/20 (10%)** –
Dyssomnia 17/34 (50%) 4/20 (20%)* –
Seizures 4/34 (11.76%) 14/20 (70%)**** –
Cranial nerve injury 11/34 (32.35%) 2/20 (10%) –
Weakness 7/34 (20.59%) 1/20 (5%) –
Autonomic symptoms 6/34 (17.65%) 3/20 (15%) –
GCS on admission [median (range)] 11.5 (3,15) 15 (11,15)**** –
GOS at discharge [median (range)] 5 (2,5) 5 (4,5)*** –
mRS (3 months after onset) [median (range)] 1 (0,5) 0 (0,1)**** –
Medical history
Hypertension 5/34 (14.71%) 3/20 (15%) –
Diabetes 4/34 (11.75%) 1/20 (5%) –
Coronary heart disease 1/34 (2.94%) 1/20 (5%) –
Cerebrovascular disease 5/34 (14.71%) 2/20 (10%) –
Extracranial tumor history 1/34 (2.94%) 1/20 (5%) –
Blood routine tests results
WBC (×109/L) 15.06 ± 7.69 9.761 ± 4.857 6.54 ± 2.174****
PLT (×109/L) 219.9 ± 71.51 209.7 ± 58.73 243.1 ± 80.13
Neutrophil count (×109/L) 13.77 ± 7.729 7.675 ± 4.622* 4.008 ± 1.843****
Lymphocyte count (×109/L) 0.8644 ± 0.4822 1.502 ± 0.9193** 3.183 ± 6.349****
Monocyte count (×109/L) 0.6653 ± 0.358 0.4895 ± 0.2131 0.7028 ± 1.096
NLR 22.43 ± 15.93 7.008 ± 7.687* 2.242 ± 1.192****
PLR 308.8 ± 153.2 164.3 ± 59.68*** 136.3 ± 65.87****
LMR 1.905 ± 2.057 3.594 ± 2.747** 4.27 ± 1.605****
Inflammation factors
ESR (mm/h) 28.58 ± 23.84 14.3 ± 18.61 10.74 ± 8.153*
CRP 82.23 ± 72.32 5.438 ± 6.551*** 5.149 ± 10.83****
PCT 3,215 ± 6.908 0.07125 ± 0.06278* 0.09746 ± 0.1983**
CSF results
CSF white blood cell count (×106/L) 2485 ± 4094 26.9 ± 55.39**** 2.76 ± 2.454****
CSF protein (mg/l) 1761 ± 1446 485.7 ± 326.1** 356.9 ± 174****
CSF glucose (mmol/L) 1.598 ± 1.146 3.34 ± 1.27*** 3.726 ± 0.9806****
CSF chlorides (mmol/L) 121.9 ± 7.945 124.2 ± 4.515 125.7 ± 5.533*
Values are presented as mean ± SD, numbers, or median (interquartile range). Statistical significance in comparison with CABM group: *p < 0.05, **p < 0.01, ***p < 0.001, ****p < 0.0001.
GCS, Glasgow Coma Scale; GOS, Glasgow Outcome Scale; WBC, white blood cell; PLT, platelet; CSF, cerebrospinal fluid; NLR, neutrophil-to-lymphocyte ratio; ESR, erythrocyte
sedimentation rate; PCT, procalcitonin.
ASC, and caspase-1 in the CSF were not significantly different for distinguishing between CABM and VM. The cutoff values for
among the three groups (Figures 1A, C–F). CSF NLRP3 were 860.9 ng/ml (CABM vs. non-CABM) with a
Etiological analysis showed that the most common pathogens sensitivity of 79.4% and a specificity of 88.9%, and 892.6 ng/ml
in our study were S. pneumoniae (29.41%), K. pneumoniae (CABM vs. VM) with a sensitivity of 76.47% and a specificity
(17.65%), E. coli (11.76%), and L. monocytogenes (11.76%). of 80%.
Mean CSF NLRP3 (ng/ml) was 2,124 ± 1,396 for S. pneumoniae
infection, 2,606 ± 1,497 for K. pneumoniae infection, 2,181 ± 2,386 Relationship Between CSF NLRP3, Clinical
for E. coli infection, and 1,213 ± 996.9 for L. monocytogenes Severity, and Disease Outcome in CABM
infection. However, there was no significant difference in CSF GCS scores at admission were used to evaluate disease severity,
NLRP3 among different bacteria (Supplementary Figure 1). whereas GOS scores at discharge and mRS scores 3 months
CSF NLRP3 showed good area under the curve (AUC) values after onset were used to evaluate disease outcomes. There was a
for the CABM group in the receiver operating characteristic significant negative correlation in the CABM group between
(ROC) curve analysis (CABM vs. non-CABM: AUC = 0.8784, CSF NLRP3 levels and GCS scores at admission (r = −0.7003,
95% CI: 0.7932–0.9636, p < 0.0001; CABM vs. VM: AUC = R2 = 0.4904, p < 0.001, Figure 3) and between CSF NLRP3
0.8279, 95% CI: 0.7182–0.9377, p < 0.0001, Figures 2A, B), levels and GOS scores at discharge (r = −0.7616, R2 = 0.58, p <
suggesting that CSF NLRP3 may be a good diagnostic biomarker 0.001, Figure 3), suggesting that patients with higher CSF
Frontiers in Cellular and Infection Microbiology | www.frontiersin.org 4 January 2022 | Volume 11 | Article 803186Gong et al. CSF NLRP3’s Value in CABM
A B C
D E F
FIGURE 1 | Levels of inflammasome protein in the CSF of patients with CABM. (A, C–F) Levels of CSF NLRP1, NLRC4, AIM2, ASC, and caspase-1 were not
different among the three groups. (B) Concentrations of CSF NLRP3 in the CABM group were significantly higher than those in the VM (p < 0.001) and control
(p < 0.001) groups. ****p < 0.001.
NLRP3 concentrations presented with more severe disease decrease in the lymphocyte and monocyte counts when
and poorer clinical outcomes. There was also a significant compared with the favorable outcome group (Table 2).
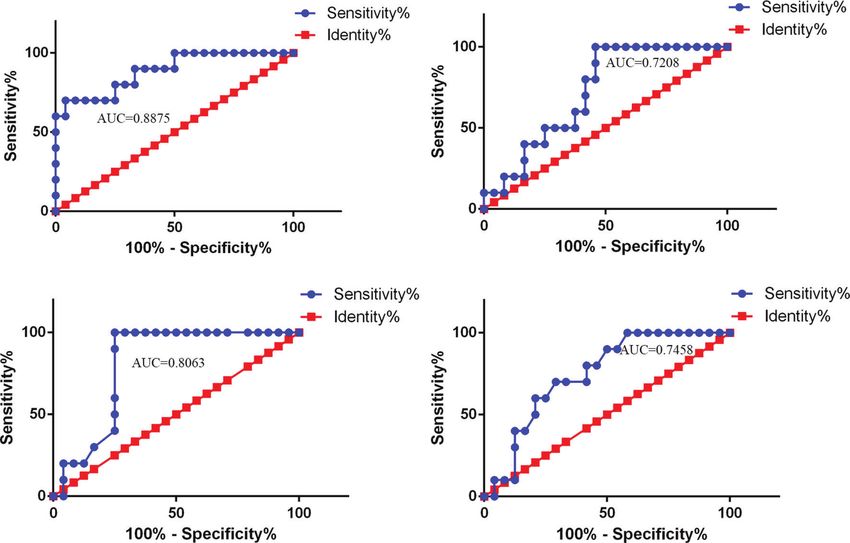
positive correlation between CSF NLRP3 levels and When the ROC curve analysis was performed, CSF NLRP3
mRS scores 3 months after onset (r = 0.8052, R2 = 0.6484, levels showed a good AUC value (favorable vs. unfavorable
p < 0.001, Figure 3). outcome: AUC = 0.8875, 95% CI: 0.7644–1.011, p < 0.001),
When CABM patients were discriminated between those who suggesting that they may also be good predictors of CABM
presented a favorable and an unfavorable outcome, the prognosis (Figure 4A). In fact, CSF NLRP3 levels outperformed
unfavorable outcome group exhibited a significant increase in the NLR (AUC = 0.7208, 95% CI: 0.5512–0.8905, p = 0.04521,
the NLR, the PLR, and the CSF NLRP3 levels, and a significant Figure 4B), the lymphocyte count (AUC = 0.8063, 95% CI:
A B
FIGURE 2 | The receiver operating characteristic (ROC) curve analysis of CSF NLRP3 for the diagnosis of CABM. (A) NLRP3 levels showed a good area under the
curve (AUC) value in the CABM vs. non-CABM comparison (AUC = 0.8784, 95% CI: 0.7932–0.9636, p < 0.0001). The cutoff values of CSF NLRP3 were 860.9 ng/
ml with a sensitivity of 79.4% and a specificity of 88.9%. (B) NLRP3 showed a good area under the curve (AUC) value in the CABM vs. VM comparison (AUC =
0.8279, 95% CI: 0.7182–0.9377, p < 0.0001). The cutoff values of CSF NLRP3 were 892.6 ng/ml with a sensitivity of 76.47% and a specificity of 80%.
Frontiers in Cellular and Infection Microbiology | www.frontiersin.org 5 January 2022 | Volume 11 | Article 803186Gong et al. CSF NLRP3’s Value in CABM
explored the relevance of NLRP3 to these indicators and to
some typical parameters from CSF analysis, such as Qalb and
QIgG. CSF NLRP3 levels were positively correlated with the
NLR (r = 0.4494, R2 = 0.202, p = 0.0077, Figure 5A) and PLR
(r = 0.8596, R2 = 0.7347, p < 0.0001, Figure 5B), as well as with
Qalb (r = 0.6296, R2 = 0.3965, p < 0.0001, Figure 5C) and QIgG
(r = 0.6504, R2 = 0.423, p < 0.0001, Figure 5D). On the other
hand, they were negatively correlated with the lymphocyte
count (r = −0.5649, R2 = 0.3192, p = 0.0005, Figure 5E)
but not with the monocyte count (r = −0.2203, R2 = 0.04853,
p = 0.2106, Figure 5F).
FIGURE 3 | Relationships between CSF NLRP3 and clinical severity or
outcome in CABM. There was a significant negative correlation between CSF DISCUSSION
NLRP3 levels and GCS scores at admission (r = −0.7003, R2 = 0.4904,
p < 0.001) or GOS scores at discharge (r = −0.7616, R2 = 0.58, p < 0.001).
In this study, we demonstrated that patients with CABM exhibit
There was a significant positive correlation between CSF NLRP3 levels and
mRS scores 3 months after onset (r = 0.8052, R2 = 0.6484, p < 0.001). significant differences in clinical symptoms, prognostic scores,
and laboratory findings when compared with VM patients, which
is in accordance with previous studies (van de Beek et al., 2004;
0.6587–0.9538, p < 0.01, Figure 4C), and the monocyte count Brivet et al., 2005). In addition, our study revealed elevated levels
(AUC = 0.7458, 95% CI: 0.5805–0.9112, p = 0.02579, Figure 4D) of NLRP3 but not of ASC, caspase-1, or other inflammasomes in
at this task. When 2,840 ng/ml was selected as the cutoff value, the CSF of patients with CABM. To the best of our knowledge,
CSF NLRP3 levels showed a sensitivity of 95.83% and a this is the first study to examine the expression levels of
specificity of 70% as indicators of CABM prognosis. inflammasomes in the cerebrospinal fluid of patients with CABM.
As has been previously reported, pathogen-associated molecular
Relationship Between CSF NLRP3 and patterns (PAMP) and damage-associated molecular patterns
Other Parameters (DAMP) are the critical initial stimuli that activate NLRP3
Since the previous results suggested that the NLR, PLR, and (Hornung and Latz, 2010). The oligomerization of NLRP3
lymphocyte and monocyte counts, along with CSF NLRP3 levels, recruits ASC, which in turn cleaves pro-caspase-1 into caspase-1
were closely associated with CABM prognosis, we further (Rubartelli, 2012), inducing the release of mature pro-inflammatory
TABLE 2 | Laboratory data and CSF NLRP3 levels in CABM patients discriminated by prognosis.
Favorable outcome Unfavorable outcome
Blood routine results
WBC (×109/L) 14.97 ± 8.494 15.27 ± 5.692
PLT (×109/L) 211.8 ± 74.44 239.1 ± 63.29
Neutrophil count (×109/L) 13.15 ± 8.497 15.25 ± 5.572
Lymphocyte count (×109/L) 1.008 ± 0.5054** 0.52 ± 0.1149
Monocyte count (×109/L) 0.7454 ± 0.3901* 0.473 ± 0.1508
NLR 18.29 ± 16.16* 30.79 ± 12.37
PLR 239.7 ± 82.1**** 474.8 ± 159.5
LMR 2.173 ± 2.368 1,262 ± 0.7287
Inflammation factors
ESR (mm/h) 24.51 ± 23.23 39.86 ± 25.35
CRP 70.85 ± 67.17 109.6 ± 80.44
PCT 3.374 ± 7.342 3.025 ± 5.638
CSF results
CSF white blood cell count (×106/L) 2209 ± 4095 3148 ± 4234
CSF protein (mg/L) 1803 ± 1472 1661 ± 1453
CSF glucose (mmol/L) 1.578 ± 1.115 1.654 ± 1.321
CSF chlorides (mmol/L) 121.9 ± 7.166 121.9 ± 10.01
QALB 22.79 ± 16.17 44.42 ± 39.54
QIgG 25.16 ± 21.21 48.32 ± 35.69
IgG Index 1.188 ± 1.14 1.299 ± 1.551
intrathecal IgG synthesis 63.6 ± 73.57 108.8 ± 101.1
CSF NLRP3 (ng/ml) 1403 ± 832.8*** 3490 ± 1489
Values are presented as the mean ± SD. Statistical significance: *p < 0.05, **p < 0.01, *** p < 0.001, ****p < 0.0001.
GCS, Glasgow Coma Scale; GOS, Glasgow Outcome Scale; WBC, white blood cell; PLT, platelet; CSF, cerebrospinal fluid; NLR, neutrophil-to-lymphocyte ratio; ESR, erythrocyte
sedimentation rate; PCT, procalcitonin.
Frontiers in Cellular and Infection Microbiology | www.frontiersin.org 6 January 2022 | Volume 11 | Article 803186Gong et al. CSF NLRP3’s Value in CABM
A B
C D
FIGURE 4 | ROC curve analysis of CSF NLRP3 and other parameters used for CABM prognosis. (A) AUC value of CSF NLRP3 (AUC = 0.8875, 95% CI: 0.7644–
1.011, p < 0.001) for prediction of CABM prognosis. The cutoff values were 2840 ng/ml with a sensitivity of 76.47% and a specificity of 80%. (B) AUC value of NLR
(AUC = 0.7208, 95% CI: 0.5512–0.8905, p = 0.04521) for prediction of CABM prognosis. (C) AUC value of the lymphocyte count (AUC = 0.8063, 95% CI: 0.6587–
0.9538, p < 0.01) for prediction of CABM prognosis. (D) AUC value of the monocyte count (AUC = 0.7458, 95% CI: 0.5805–0.9112, p = 0.02579) for prediction of
CABM prognosis.
cytokines, namely, IL-1b and IL-18 (Schroder and Tschopp, 2010; NLRP3 among different bacterial infections. We needed to
Gong et al., 2018). These cytokines then initiate or amplify diverse expand the sample size for further analysis.
downstream signaling pathways to drive pro-inflammatory To date, high levels of NLRP3 in the CSF have been reported in
processes that may cause cellular damage, such as autophagy and several neuroinflammatory diseases such as anti-N-methyl-D-
pyroptosis (Schroder and Tschopp, 2010). It has been revealed that aspartate receptor encephalitis (Peng et al., 2019), autoimmune
CSF levels of inflammasome-associated cytokines IL-1b and IL-18 GFAP astrocytopathy (Luo et al., 2019), chronic inflammatory
were increased in patients with bacterial meningitis, and that this demyelinating polyradiculoneuropathy (Zhou and Xia, 2021), and
was associated with complications and unfavorable outcomes neuromyelitis optica spectrum disorder (Peng et al., 2019), and are
(Geldhoff et al., 2013). This piece of evidence is consistent with sometimes correlated with disease severity or prognosis. This
the increased levels of CSF NLRP3 in CABM patients that we strongly suggests that CSF NLRP3 has some clinical significance
detected. Therefore, we speculated that the NLRP3 inflammasome in neuroinflammatory diseases. In our study, there were significant
may play an important role in CABM. Some studies in animals positive correlations between CSF NLRP3 and clinical severity, and
have explored the role of NLRP3 in bacterial meningitis: It has been it was negatively correlated with GOS scores at discharge.
reported that the NLRP3 inflammasome contributes to brain Moreover, we found that patients with unfavorable outcomes had
injury in pneumococcal meningitis (Hoegen et al., 2011). In higher levels of CSF NLRP3 as well as higher values for several
addition, E. coli can cause meningoencephalitis by increasing the indicators measured in routine blood analysis. We sought to
inflammatory response and activating the TLR2/TLR4/MyD88 determine the diagnostic and prognostic performance of CSF
and the NLRP3 inflammasome pathways (Wang et al., 2020). NLRP3 as a biomarker for CABM by means of an AUROC
NLRP3-deficient mice have decreased systemic inflammatory analysis. Our results demonstrate that CSF NLRP3 may be a good
responses and bacterial outgrowth, which are also associated biomarker for the diagnosis of CABM and for the discrimination
with an increase in cerebral neutrophil infiltration and cerebral between CABM and VM. It could also be a better biomarker for
hemorrhages (Geldhoff et al., 2013). predicting the prognosis of patients with CABM compared with the
We also compared NLRP3 levels in CSF from CABM patients NLR or with the lymphocyte or monocyte count.
caused by different bacteria. The expression of CSF NLRP3 Some previous studies have proposed new biomarkers for
seemed to be increased in K. pneumoniae infection, but bacterial meningitis, such as serum or CSF PCT (Ko et al., 2017;
decreased in L. monocytogenes infection. However, due to the Reshi et al., 2017), neutrophil-to-lymphocyte ratio (Mentis et al.,
small sample size, there was no significant difference in CSF 2016), persephin (Stubljar et al., 2015), heparin-binding protein
Frontiers in Cellular and Infection Microbiology | www.frontiersin.org 7 January 2022 | Volume 11 | Article 803186Gong et al. CSF NLRP3’s Value in CABM
A B C
D E F
FIGURE 5 | Relationship between CSF NLRP3 and other parameters. (A) CSF NLRP3 was positively correlated with the NLR (r = 0.4494, R2 = 0.202, p =
0.0077). (B) CSF NLRP3 was positively correlated with the PLR (r = 0.8596, R2 = 0.7347, p < 0.0001). (C) CSF NLRP3 was positively correlated with Qalb
(r = 0.6296, R2 = 0.3965, p < 0.0001). (D) CSF NLRP3 was positively correlated with QIgG (r = 0.6504, R2 = 0.423, p < 0.0001). (E) CSF NLRP3 was
negatively correlated with the lymphocyte count (r = −0.5649, R 2 = 0.3192, p = 0.0005). (F) CSF NLRP3 and the monocyte count were not correlated (r =
−0.2203, R2 = 0.04853, p = 0.2106).
(Linder et al., 2011), neurofilament (Grønhøj et al., 2021), and respectively. This strongly suggests that the high concentration
lipocalin 2 (Thanh et al., 2021). Due to practical limitations, only of CSF NLRP3 may be closely related to the disruption of the
a subset of these putative biomarkers (serum PCT and NLR) BBB and the activation of intracranial humoral immunity. Some
were considered in the present study. Contrary to previous studies also found that the IgG index correlated with CSF IL-4
results, we did not find differences in the serum PCT levels levels in patients with multiple sclerosis (Mouzaki et al., 2015).
among the different groups, which may have been due to the
different inclusion criteria adopted in those previous studies. On
the other hand, our results confirmed a significant correlation LIMITATIONS
between NLR and CABM prognosis, but compared with NLR,
CSF NLRP3 levels had a better predictive value. Our study had some limitations. The sample size was somewhat
We further analyzed the correlation between CSF NLRP3 small, and therefore the potential usefulness of CSF NLRP3 as a
levels and some clinical parameters. The results showed that CSF biomarker for CABM needs to be verified with a larger cohort. In
NLRP3 had a good correlation with some immune system or addition, data from the blood and cerebrospinal fluid were obtained
immune response parameters such as the NLR, the PLR, and the from standard hospital laboratory tests, which made us fail to
lymphocyte count, suggesting that CSF NLRP3 may be closely further compare some newly discovered meaningful indicators in
associated to the innate and adaptive immune systems. A recent years. Finally, the study focused exclusively on adult patients,
previous study on rats (Abdul Aziz et al., 2021) had shown a leaving the potential value of CSF NLRP3 as a biomarker in a
correlation between NLRP3 levels in the hippocampus and the pediatric context as a hypothesis to be tested in future studies.
NLR. In addition, some studies have shown that the expressions
of IL-1b and IL-18 in blood were correlated with the NLR or the
PLR in different diseases (Zou et al., 2018; Ková cs et al., 2021; CONCLUSION
Zhang et al., 2021), supporting the association between
activation of the NLRP3 inflammasome and these immune To summarize, we found substantially higher levels of NLRP3 in the
response indicators. In addition, CSF NLRP3 was also clearly CSF of adults with CABM. These levels were positively correlated
correlated in our study with Qalb and QIgG, indicators of blood– with clinical severity, the NLR, the PLR, Qalb, and QIgG, and they
brain barrier (BBB) function and intracranial immune response, were also negatively correlated with favorable outcomes and with
Frontiers in Cellular and Infection Microbiology | www.frontiersin.org 8 January 2022 | Volume 11 | Article 803186Gong et al. CSF NLRP3’s Value in CABM
the lymphocyte count, suggesting that the NLRP3 inflammasome AUTHOR CONTRIBUTIONS
might play an important role in the pathogenesis of CABM in
adults. In addition, we found for the first time that CSF NLRP3 may ZG carried out the experiments, performed the analysis, and
be a good biomarker for the diagnosis of CABM and for the wrote the manuscript. CZ contributed to the collection of the
discrimination between CABM and VM cases in adults. It may clinical data. YL and LJ contributed to data analysis. RD and YY
also prove to be a useful potential biomarker for predicting the edited the manuscript. JT collaborated with us and contributed
prognosis of individual CABM cases in adults. to the design of the study. YJ designed the study and contributed
to the writing and editing of the manuscript. All authors
contributed to the article and approved the submitted version.
DATA AVAILABILITY STATEMENT
The original contributions presented in the study are included in FUNDING
the article/Supplementary Material. Further inquiries can be
directed to the corresponding author. This work was supported by the National Natural Science
Foundation of China (NSFC 82001290 to ZG).
ETHICS STATEMENT
SUPPLEMENTARY MATERIAL
The studies involving human participants were reviewed and
approved by the Ethics Committee of Zhengzhou University The Supplementary Material for this article can be found online at:
(2019-KY-018). The patients/participants provided their written https://www.frontiersin.org/articles/10.3389/fcimb.2021.803186/
informed consent to participate in this study. full#supplementary-material
Pneumococcal Meningitis and Is Activated Through ATP-Dependent
REFERENCES Lysosomal Cathepsin B Release. J. Immunol. 187 (10), 5440–5451.
Abdul Aziz, N. U., Chiroma, S. M., Mohd Moklas, M. A., Adenan, M. I., Ismail, A., doi: 10.4049/jimmunol.1100790
Basir, R., et al. (2021). Menhaden Fish Oil Attenuates Postpartum Depression Hornung, V., and Latz, E. (2010). Critical Functions of Priming and Lysosomal
in Rat Model via Inhibition of NLRP3-Inflammasome Driven Inflammatory Damage for NLRP3 Activation. Eur. J. Immunol. 40 (3), 620–623. doi: 10.1002/
Pathway. J. Tradit. Complement. Med. 11 (5), 419–426. doi: 10.1016/ eji.200940185
j.jtcme.2021.02.007 Koedel, U. (2009). Toll-Like Receptors in Bacterial Meningitis. Curr. Top.
Bijlsma, M. W., Brouwer, M. C., Kasanmoentalib, E. S., Kloek, A. T., Lucas, M. J., Microbiol. Immunol. 336, 15–40. doi: 10.1007/978-3-642-00549-7_2
Tanck, M. W., et al. (2016). Community-Acquired Bacterial Meningitis in Koelman, D. L. H., Brouwer, M. C., and van de Beek, D. (2019). Targeting the
Adults in the Netherlands, 2006-14: A Prospective Cohort Study. Lancet Infect. Complement System in Bacterial Meningitis. Brain. 142 (11), 3325–3337.
Dis. 16 (3), 339–347. doi: 10.1016/S1473-3099(15)00430-2 doi: 10.1093/brain/awz222
Brivet, F. G., Ducuing, S., Jacobs, F., Chary, I., Pompier, R., Prat, D., et al. (2005). Ko, B. S., Ryoo, S. M., Ahn, S., Sohn, C. H., Seo, D. W., and Kim, W. Y. (2017). Usefulness
Accuracy of Clinical Presentation for Differentiating Bacterial From Viral of Procalcitonin Level as an Outcome Predictor of Adult Bacterial Meningitis.
Meningitis in Adults: A Multivariate Approach. Intensive Care Med. 31 (12), Intern. Emerg. Med. 12 (7), 1003–1009. doi: 10.1007/s11739-016-1509-4
1654–1660. doi: 10.1007/s00134-005-2811-1 Ková cs, D., Vá ntus, V. B., Vá mos, E., Ká lmá n, N., Schicho, R., Gallyas, F., et al.
Chong, P. F., Sakai, Y., Torisu, H., Tanaka, T., Furuno, K., Mizuno, Y., et al. (2018). (2021). Olaparib: A Clinically Applied PARP Inhibitor Protects From
Leucine-Rich Alpha-2 Glycoprotein in the Cerebrospinal Fluid Is a Potential Experimental Crohn’s Disease and Maintains Barrier Integrity by Improving
Inflammatory Biomarker for Meningitis. J. Neurol. Sci. 392, 51–55. Bioenergetics Through Rescuing Glycolysis in Colonic Epithelial Cells. Oxid.
doi: 10.1016/j.jns.2018.07.006 Med. Cell. Longev. 2021, 7308897. doi: 10.1155/2021/7308897
Geldhoff, M., Mook-Kanamori, B. B., Brouwer, M. C., Troost, D., Leemans, J. C., Linder, A., Akesson, P., Brink, M., Studahl, M., Bjorck, L., and Christensson, B. (2011).
Flavell, R. A., et al. (2013). Inflammasome Activation Mediates Inflammation Heparinbinding Protein: A Diagnostic Marker of Acute Bacterial Meningitis. Crit.
and Outcome in Humans and Mice With Pneumococcal Meningitis. BMC. Care Med. 39 (4), 812–817. doi: 10.1097/CCM.0b013e318206c396
Infect. Dis. 13, 358. doi: 10.1186/1471-2334-13-358 Loughran, A. J., Orihuela, C. J., and Tuomanen, E. I. (2019). Streptococcus
Glimåker, M., Johansson, B., Grindborg, Ö., Bottai, M., Lindquist, L., and Sjölin, J. Pneumoniae: Invasion and Inflammation. Microbiol. Spectr. 7 (2).
(2015). Adult Bacterial Meningitis: Earlier Treatment and Improved Outcome doi: 10.1128/microbiolspec.GPP3-0004-2018
Following Guideline Revision Promoting Prompt Lumbar Puncture. Clin. Luo, Y., Yan, W., Zhou, Z., Liu, B., Wang, Z., Chen, J., et al. (2019). Elevated Levels
Infect. Dis. 60 (8), 1162–1169. doi: 10.1093/cid/civ011 of NLRP3 in Cerebrospinal Fluid of Patients With Autoimmune GFAP
Gong, Z., Pan, J., Shen, Q., Li, M., and Peng, Y. (2018). Mitochondrial Dysfunction Astrocytopathy. Front. Neurol. 10, 1019. doi: 10.3389/fneur.2019.01019
Induces NLRP3 Inflammasome Activation During Cerebral Ischemia/Reperfusion Mentis, A. F. A., Kyprianou, M. A., Xirogianni, A., Kesanopoulos, K., and
Injury. J. Neuroinflamm. 15 (1), 242. doi: 10.1186/s12974-018-1282-6 Tzanakaki, G. (2016). Neutrophil-To-Lymphocyte Ratio in the Differential
Grønhøj, M. H., Sejbaek, T., Hansen, R. W., Larsen, L., Dahl, M., Schierbeck, J., Diagnosis of Acute Bacterial Meningitis. Eur. J. Clin. Microbiol. Infect. Dis. 35
et al. (2021). Serum Levels of Neurofilament Light Chain, Neuron-Specific (3), 397–403. doi: 10.1007/s10096-015-2552-1
Enolase and S100 Calcium-Binding Protein B During Acute Bacterial Mouzaki, A., Rodi, M., Dimisianos, N., Emmanuil, A., Kalavrizioti, D., Lagoudaki,
Meningitis: A Prospective Cohort Study. Infect. Dis. (Lond). 53 (6), 409–419. R., et al. (2015). Immune Parameters That Distinguish Multiple Sclerosis
doi: 10.1080/23744235.2021.1883730 Patients From Patients With Other Neurological Disorders at Presentation.
Gross, O., Thomas, C. J., Guarda, G., and Tschopp, J. (2011). The Inflammasome: PloS One 10 (8), e0135434. doi: 10.1371/journal.pone.0135434
An Integrated View. Immunol. Rev. 243 (1), 136–151. doi: 10.1111/j.1600- Patel, S. (2017). Inflammasomes, the Cardinal Pathology Mediators are Activated
065X.2011.01046.x by Pathogens, Allergens and Mutagens: A Critical Review With Focus on
Hoegen, T., Tremel, N., Klein, M., Angele, B., Wagner, H., Kirschning, C., et al. NLRP3. Biomed. Pharmacother. 92, 819–825. doi: 10.1016/j.biopha.
(2011). The NLRP3 Inflammasome Contributes to Brain Injury in 2017.05.126
Frontiers in Cellular and Infection Microbiology | www.frontiersin.org 9 January 2022 | Volume 11 | Article 803186Gong et al. CSF NLRP3’s Value in CABM Peng, Y., Chen, J., Dai, Y., Jiang, Y., Qiu, W., Gu, Y., et al. (2019). NLRP3 Level in van de Beek, D., de Gans, J., Spanjaard, L., Weisfelt, M., Reitsma, J. B., and Vermeulen, Cerebrospinal Fluid of Patients With Neuromyelitis Optica Spectrum M. (2004). Clinical Features and Prognostic Factors in Adults With Bacterial Disorders: Increased Levels and Association With Disease Severity. Mult. Meningitis. N. Engl. J. Med. 351 (18), 1849–1859. doi: 10.1056/NEJMoa040845 Scler. Relat. Disord. 39, 101888. doi: 10.1016/j.msard.2019.101888 Wang, W., Cai, M., Hu, J., Zhang, Z., Wang, X., Chang, X., et al. (2020). Peng, Y., Liu, B., Pei, S., Zheng, D., Wang, Z., Ji, T., et al. (2019). Higher CSF Levels Mechanism of Blood-Brain Barrier Disruption by an Escherichia Coli From of NLRP3 Inflammasome Is Associated With Poor Prognosis of Anti-N- Lambs With Severe Diarrhea and Meningoencephalitis. Microb. Pathog. 147, Methyl-D-Aspartate Receptor Encephalitis. Front. Immunol. 10, 905. 104288. doi: 10.1016/j.micpath.2020.104288 doi: 10.3389/fimmu.2019.00905 Zhang, Y., Cao, M., and Ren, J. (2021). NLR Value and IL-18 Level and Their Rankin, J. (1957). Cerebral Vascular Accidents in Patients Over the Age of 60. I. Clinical Significance in Patients With Deep Vein Thrombosis After Receiving General Considerations. Scott. Med. J. 2 (4), 127–136. doi: 10.1177/ the Surgery for Spinal Degeneration. Am. J. Transl. Res. 13 (6), 7156–7163. 003693305700200401 Zhou, Z. J., and Xia, P. (2021). Elevated Levels of NLRP3 Inflammasome in Reshi, Z., Nazir, M., Wani, W., Malik, M., Iqbal, J., and Wajid, S. (2017). Serum of Patients With Chronic Inflammatory Demyelinating Cerebrospinal Fluid Procalcitonin as a Biomarker of Bacterial Meningitis in Polyradiculoneuropathy Are Associated With Disease Severity. Neurol. Sci. Neonates. J. Perinatol. 37 (8), 927–931. doi: 10.1038/jp.2017.73 42 (8), 3383–3387. doi: 10.1007/s10072-020-04949-7 Rubartelli, A. (2012). Redox Control of NLRP3 Inflammasome Activation in Zou, Z., Zhao, L., Su, S., Liu, Q., Yu, L., Wei, J., et al. (2018). The Plasma Levels of Health and Disease. J. Leukoc. Biol. 92 (5), 951–958. doi: 10.1189/jlb.0512265 12 Cytokines and Growth Factors in Patients With Gastric Cancer. Med. Schroder, K., and Tschopp, J. (2010). The Inflammasomes. Cell 140 (6), 821–832. (Baltimore) 97 (19), e0413. doi: 10.1097/MD.0000000000010413 doi: 10.1016/j.cell.2010.01.040 Shao, B. Z., Cao, Q., and Liu, C. (2018). Targeting NLRP3 Inflammasome in the Conflict of Interest: The authors declare that the research was conducted in the Treatment of CNS Diseases. Front. Mol. Neurosci. 11, 320. doi: 10.3389/ absence of any commercial or financial relationships that could be construed as a fnmol.2018.00320 potential conflict of interest. Stubljar, D., Kopitar, A. N., Groselj-Grenc, M., Suhadolc, K., Fabjan, T., and Skvarc, M. (2015). Diagnostic Accuracy of Presepsin (Scd14-ST) for Prediction Publisher’s Note: All claims expressed in this article are solely those of the authors of Bacterial Infection in Cerebrospinal Fluid Samples From Children With and do not necessarily represent those of their affiliated organizations, or those of Suspected Bacterial Meningitis or Ventriculitis. J. Clin. Microbiol. 53 (4), 1239– the publisher, the editors and the reviewers. Any product that may be evaluated in 1244. doi: 10.1128/JCM.03052-14 this article, or claim that may be made by its manufacturer, is not guaranteed or Thanh, T. T., Casals-Pascual, C., Ny, N. T. H., Ngoc, N. M., Geskus, R., Nhu, L. N. endorsed by the publisher. T., et al. (2021). Value of Lipocalin 2 as a Potential Biomarker for Bacterial Meningitis. Clin. Microbiol. Infect. 27 (5), 724–730. doi: 10.1016/ Copyright © 2022 Gong, Zhang, Li, Jing, Duan, Yao, Teng and Jia. This is an open- j.cmi.2020.07.006 access article distributed under the terms of the Creative Commons Attribution Tubiana, S., Varon, E., Biron, C., Ploy, M. C., Mourvillier, B., Taha, M. K., et al. License (CC BY). The use, distribution or reproduction in other forums is permitted, (2020). Community-Acquired Bacterial Meningitis in Adults: in-Hospital provided the original author(s) and the copyright owner(s) are credited and that the Prognosis, Long-Term Disability and Determinants of Outcome in a original publication in this journal is cited, in accordance with accepted academic Multicentre Prospective Cohort. Clin. Microbiol. Infect. 26 (9), 1192–1200. practice. No use, distribution or reproduction is permitted which does not comply with doi: 10.1016/j.cmi.2019.12.020 these terms. Frontiers in Cellular and Infection Microbiology | www.frontiersin.org 10 January 2022 | Volume 11 | Article 803186
You can also read