OBSERVER: Unprecedented Australian bushfires and the Copernicus
services
←
→
Page content transcription
If your browser does not render page correctly, please read the page content below
OBSERVER: Unprecedented Australian bushfires and the Copernicus services
Since September 2019, bushfires have been affecting Australia with dramatic consequences: millions
of hectares of land have burned, the fires have had a devastating impact on the native wildlife, and
many houses and human lives have been lost.

In these instances, satellite data can prove invaluable to help civil protection authorities and
inhabitants on the ground to get an overview of the fires and monitor changes over time in order to
coordinate relief operations.

In early November, following two months of bushfires and deteriorating conditions, Copernicus
Emergency Management’s rapid mapping service was activated to assist local authorities.
Furthermore, throughout the crisis, the fires were monitored by Copernicus’ Global Wildfire
Information System, as well as the Copernicus Atmosphere Monitoring Service (CAMS). CAMS
tracked the fires and the resulting emission of atmospheric pollutants.

Copernicus Emergency Management’s activation

The bushfire crisis in Australia started in mid-September 2019. From the beginning, New South
Wales was heavily impacted by the many fires. Deteriorating conditions and the scale and severity of
the fires in early November made it challenging for assessment teams to get to the affected areas.

On 13 November, the Emergency Management Australia / Crisis Coordination Centre and New South
Wales Rural Fire Service requested the activation of Copernicus EMS’ Rapid Mapping service
through the Delegation of the European Union to Australia. The request aimed to detect the extent of
the fires and monitor their spread over 10 areas of interest (AoIs).
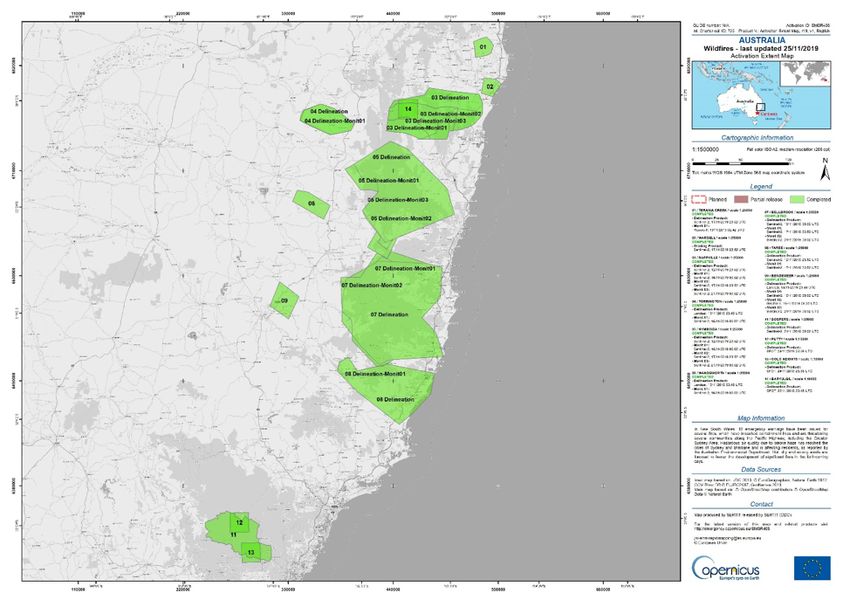
The Activation Extent Map (AEM) showing the areas of interest and associated products (Copernicus
EMS © 2019 EU, [EMSR408: Wildfires in New South Wales, Australia]).

As the activation progressed, the extent of the initial AoIs was redefined to reflect the spread of the
fires (using the location of active flames and fire fronts that were detected). Furthermore, new AoIs,
suggested by the national authorities, were added. 15 monitoring, satellite-based, maps were
produced following the detection of many actives flames. 1,487 active flames were detected.

Over a period of two weeks, from 13 November to 28 November, 28 satellite-based maps were
produced covering 14 areas of interest in New South Wales. The Copernicus EMS team detected
that 1,507,188 hectares had been burnt, affecting approximately 2,035 inhabitants.
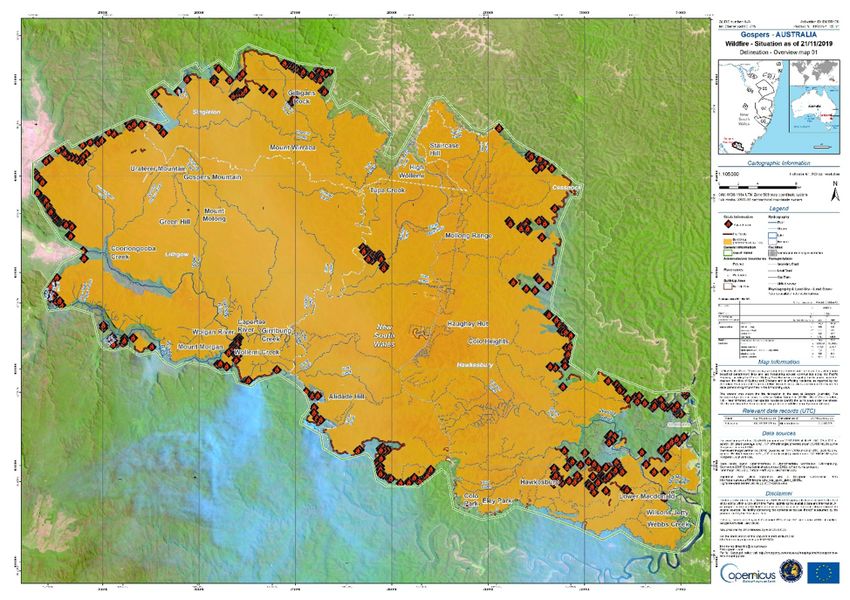
The delineation product of the area around Gospers, showing over 169.527,3 ha (1.695 km2) of burnt
area at the time of satellite imagery acquisition (Copernicus EMS © 2019 EU, [EMSR408: Gospers:
Delineation overview map 01]

Juan Escalante, operational focal point for Copernicus EMS at the EU’s Emergency Response
Coordination Centre in Brussels (DG ECHO-ERCC), said "this activation […] represents one of the
most important ones in terms of the analysis produced. […]. [It] helps first responders on the field to
make decisions, it's not only showing the burnt areas”.

The ERCC is the heart of the EU Civil Protection Mechanism and coordinates the delivery of
assistance to disaster-stricken countries, such as relief equipment, civil protection teams and
specialised expertise. It is the entry point for any request for the Copernicus Emergency Management
Service. Once the ERCC validates the request, it forwards it to the Rapid Mapping map production
team which works 24 hours a day, any day of the year. The map production team then immediately
orders the necessary satellite imagery, analyses it and releases the satellite-based maps to the
requester in the shortest time possible. This gives first hand information to the rescue teams and civil
protection authorities in order to assist victims on the ground.

The current map production team is made up of the following European companies and academia: e-
GEOS (Italy), GAF (Germany), Telespazio Ibèrica (Spain), ITHACA (Italy), SIRS and Strasbourg
University (France), as well as GMV (Spain).

More information on the Copernicus Emergency Management Service can be found here.
Regular updates on Copernicus EMS activations can also be found on the Copernicus EMS Twitter
account.

The delineation product of the area around Gospers, showing over 169.527,3 ha (1.695 km2) of burnt
area at the time of satellite imagery acquisition (Copernicus EMS © 2019 EU, [EMSR408: Gospers:
Delineation overview map 01]

Copernicus Atmosphere Monitoring Service’s continued monitoring of the
bushfires

Our Atmosphere Monitoring Service (CAMS), implemented by the European Centre for Medium-
Range Weather Forecasts (ECMWF) on behalf of the EU, has also been monitoring the fires closely
by tracking their intensity and the resulting emission of atmospheric pollutants.

CAMS estimates fire emissions on a global scale on a daily basis via their Global Fire Assimilation
System (GFAS). GFAS combines observations of fire radiative power (FRP) from satellite-based
sensors in a statistically consistent manner.

In a first update in November 2019, Mark Parrington, Senior Scientist at CAMS, said that “when
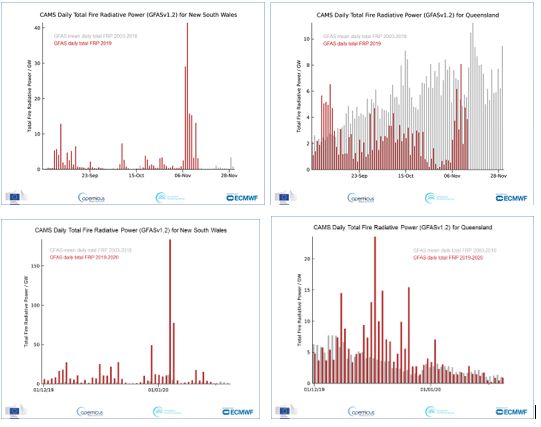
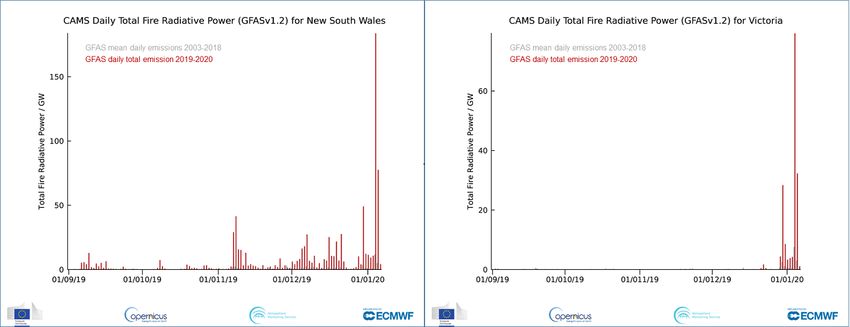
comparing the results with the average of the previous 16-years in our GFAS dataset, the 2019 fires
were very unusual in number and intensity, especially in the northeastern parts of New South
Wales.”

Total fire radiative power for 2019-2020 (red) compared to the average for the previous 16 years
(grey) for New South Wales (left) and Queensland (right). (Credit: Copernicus Atmosphere Monitoring
Service/ECMWF)

In addition to tracking fire activity and emissions, CAMS also predicts the movement of smoke and
how it impacts air quality. In this case, in November 2019, New South Wales declared a state of
emergency and many schools were closed due to fire conditions and hazardous levels of air
pollution.

In a second update in January 2019, CAMS provided further information on the unusual character of
the fires and the important impact on air quality they have had.

CAMS data show that fire activity in Australia was overall relatively low in the country’s spring
months of September to November 2019 compared to the same period in the years 2003–2018.
However, information on fire radiative power showed that for most days in December fire activity
across the country was many times higher than the average for the previous 16 years. Furthermore,
data show that southeastern Australia, which does not typically experience as much fire activity as
the rest of the country, was heavily affected in late December – early January, when fires flared up in
New South Wales and Victoria.

Total fire radiative power for 2019 (red) compared to the average for the previous 16 years (grey) for
New South Wales (left) and Victoria (right). (Credit: Copernicus Atmosphere Monitoring
Service/ECMWF)

These unprecedented bushfires had a very strong impact on air quality across the region. CAMS
observed that smoke from the fires was transported great distances, with smoke from the strongest
fires travelling all the way around the Southern Hemisphere. According to scientists from the Finnish
Meteorological Institute, a Copernicus Relay member, during the first weekend in January, smoke
from the fires covered an estimated area of 20 million square kilometers, which is larger than Russia
and a third of Europe. Aside from Australia itself, New Zealand was also heavily impacted, where
smoke turned glaciers brown, which could possibly lead to them melting faster.
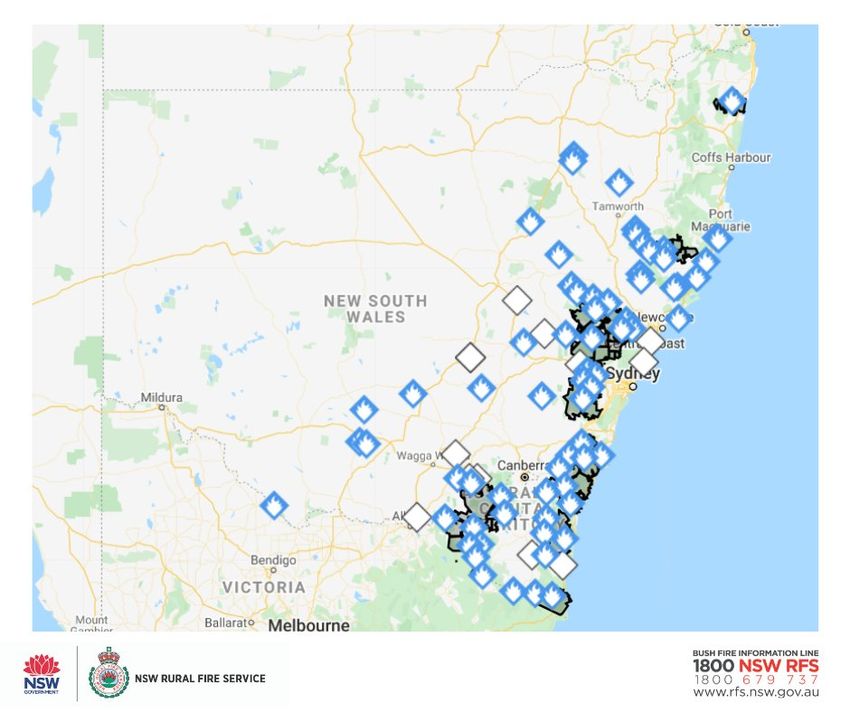
Five-day forecast of smoke transport showing smoke crossing far beyond New Zealand, initiated on 7
January. (Credit: Copernicus Atmosphere Monitoring Service/ECMWF

CAMS estimated that approximately 400 megatonnes of carbon dioxide had been released into the
atmosphere from the fires between 1 September and 14 January and that carbon dioxide emissions
from New South Wales were many times higher than any other year in the GFAS dataset.

Dry and hot conditions have enabled fires to spreadly quickly leading to the current intense fire
season. More information on precipitations, humidity and soil moisture can be found in our Climate
Change Service’s monthly hydrological summaries.

CAMS data on air quality and fire activity are freely available and can be accessed either directly on
the CAMS website, or through various openly accessible applications such as Windy.

Make sure you are following CAMS on Twitter to keep up-to-date with their activities and findings.

While the impact on the fauna, flora and local economy is dramatic, some good news came last
week: rain! Most regions in New South Wales and eastern Victoria saw much awaited rain, which
helped firefighters contain the remaining bushfires. On 19 January, the NSW Rural Fire service
reported that 69 fires continue to burn with 20 still to be contained.
Situation on 19 January as reported by the New South Wales Rural Fire Service
                                   (https://twitter.com/NSWRFS/status/1218780379668107264)

                                   Although the rain bought relief to many parts of Australia’s affected areas, dry conditions are due to
                                   return and the official fire season has only just kicked off. The Sentinels and Copernicus services will
                                   continue to have eyes on the situation on the ground and provide assistance and reliable information
                                   when needed.

                                   Don’t miss out on the latest updates from Copernicus and its service, make sure you are following
                                   our social media channels (Twitter, Instagram, and Facebook).

Powered by TCPDF (www.tcpdf.org)
You can also read