Optimization Software in Operational Research Analysis in a Public University
←
→
Page content transcription
If your browser does not render page correctly, please read the page content below

Optimization Software in Operational Research Analysis in a Public University

    Nancy Alejandra Ochoa Sotomayor1; Luis Alfredo Zúñiga Fiestas2; Juan Méndez Vergaray3;
                                       Edward Flores4
                                     1,2,3,4
                                               Universidad César Vallejo.

Abstract
The objective of this research was to determine the influence of the Invessoft program in the use of
Solver, POM-QM and Lingo as didactic resources for problem solving in operations research in
students of a public university in Lima, Peru. This decision was made because the participants had
difficulties in solving problems with the use of traditional strategies. The quantitative, applied
research had 80 participants (40 in the experimental group and 40 in the control group). The
research adopted a quasi-experimental design with measurement only after. The experimental group
applied the program for 12 weeks, while the control group continued with traditional methodology.
To measure the achievements, a performance test was used, which underwent a content validity by
expert judgment that evidenced 0.94 in Aiken's V; while the reliability kr21=0.965. The results
evidenced significant differences between both groups at a confidence level p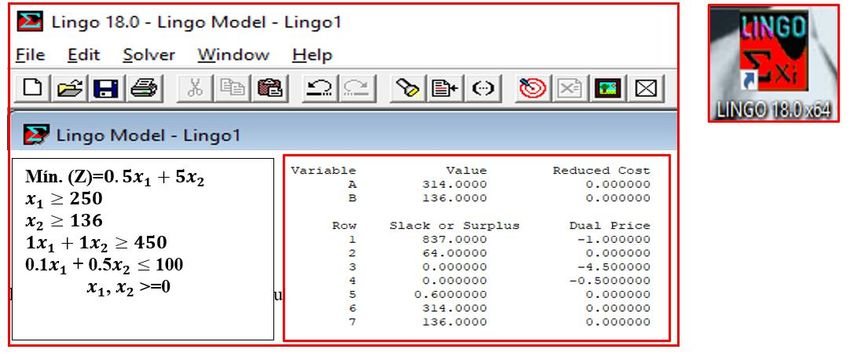
construction and validation of the model (generally mathematical), with which it is sought to separate
the background from the real problem, to culminate by providing answers and deductions that
contribute to decision-making before the solution of the original problem (Argota & Coasaca, 2016;
Bedoya-Flores, 2020; Bermúdez, 2011; Broz et al., 2017; Riveros, 2015; A. Velásquez, 2008a,
2008b; C . Velásquez et al., 2008). With regard to the viability of projects, these tools are useful to
reliably predict the success of projects (Hinostroza, 2016). For complex projects, the CPM (Critical
Path Method) and PERT (Project Evaluation and Review Technique) network models are very useful
(G. Rojas & Reyes, 2019). As a discipline within Operations Research, queuing theory studies and
analyzes situations in which a certain service is demanded, which cannot be instantly satisfied, thus
causing waiting (Cao, 2002). Through mathematical models, the efficiency is determined in different
service situations such as in care management in health establishments (Mayorga, 2018; Velázquez &
Vinueza, 2017), in library services (Muñoz-Vergara, 2019), in attention in the bank (Barreto, 2018),
in transport services (Corcino & Ramos, 2018), among others.
        The teaching of Operations Research provides the student with a comprehensive training that
is based on the acquisition of knowledge in linear programming, waiting queue theory, project
management and forecasts; Linear programming is essential to solve highly complex problems in
which many variables are used, which by manual methods would take a long time; Therefore, the use
of digital tools is viable to achieve a rapid understanding and resolution of problems (Nares &
Trovato, 2012; Puente & Gavilánez, 2018; Valencia & Hidalgo, 2018), being the Simplex method
one of the most important used in linear programming for operational calculations (Ansari, 2019).
        With the development of Information and Knowledge Technologies (ICT) these limitations
have been overcome (Juan et al., 2006; Rodríguez, 2018; M. J. Rojas et al., 2014). ICTs have had a
great impact in different areas of life and, especially in the educational context, it has evolved in what
is known as Learning and Knowledge Technologies (TAC) that seeks to achieve meaningful student
learning with the contribution of computer technologies (Ureta & Rossetti, 2020). A variety of
programs have been developed for operational research that can be used as support for better
teaching-learning of optimization and decision-making courses (Falco et al., 2018, 2019; Medina et
al., 2008; Simón- Marmolejo et al., 2013). The Operational Research course is important in the
training of an industrial engineer, its purpose is to optimize the use of resources in real life for
decision-making, through mathematical modeling and making intensive use of algorithms (Kowalski
et al., 2015). With the advancement of computer science, software becomes a didactic tool for
students and teachers that enhance the teaching-learning process, being also necessary an adequate
theoretical base in regard to Operational Research (Sánchez & Rosete, 2020). Currently, the use of

ISSN: 2237-0722                                                                                      3062
Vol. 11 No. 4 (2021)
Received: 10.06.2021 – Accepted: 11.07.2021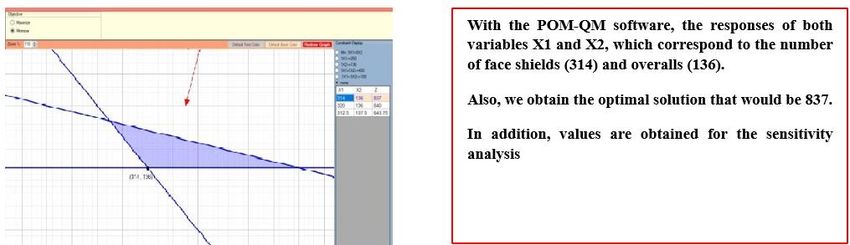
computer resources in teaching-learning is essential since the development of virtual classes has been
implemented at all educational levels since COVID-19 was declared a pandemic by the World Health
Organization in March of 2020 (Bravo & Quezada, 2021; Canaza-Choque, 2020; Navarro-Hudiel,
2020). Faced with this health emergency, the educational system has taken a profound turn in the
development of face-to-face classes towards the online modality which has constituted a great
challenge for both students and teachers (Figallo et al., 2020; Romero et al., 2020) .
        In the teaching process of the Operations Research course, which has a quantitative approach,
it is in many cases very laborious for students, causing them to fail to understand the benefit of the
course for their academic training, being necessary to apply teaching-learning strategies that be easy,
flexible, user-oriented and interesting to the extent that students cooperate proactively in the
construction and analysis of mathematical models of real-world scenarios, and that it becomes a
business optimization application which is a powerful tool help and analysis for decision making
(Cavallin et al., 2017).
        In the Professional School of Industrial Engineering of a public university in Peru, the
Operations Research course is a compulsory subject because it allows optimizing problems to make
the correct decisions; however, the course has been developing in a traditional way through problem
solving through manual calculations. The manual resolution of linear programming problems, waiting
queues, project management, and forecasts increases their complexity as the variables increase, hence
the need for computing resources. Teachers, for the most part, are unaware of the new digital skills
that allow optimization in teaching, which means that students do not acquire these essential skills
effectively and efficiently for the development of scientific knowledge and analytical skills in the
profile of the future. industrial engineering professional.
        The purpose of this research work was to determine the use of the Invessoft optimization
program as support in the teaching-learning process in the Operational Research subject, which is a
compulsory course according to the study plans of the Professional School of Industrial Engineering
from a Public University of Peru. The Invessoft program includes a set of software: Solver, POM-QM
and Lingo for solving linear programming problems in industrial engineering. Today, due to the
pandemic, the production and supply chain has been affected, so companies have had to reformulate
their production plans. Based on this situation, problems have been formulated for their resolution
through linear programming.

ISSN: 2237-0722                                                                                   3063
Vol. 11 No. 4 (2021)
Received: 10.06.2021 – Accepted: 11.07.2021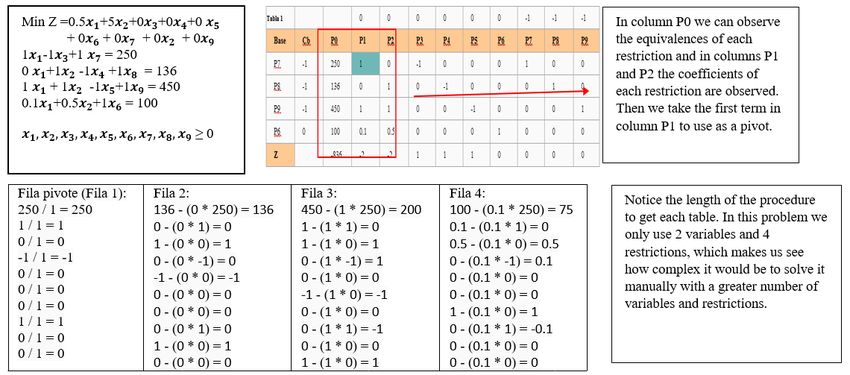
Main Software for Learning Operations Research

Solver

         It is a Microsoft Excel tool that determines the maximum or minimum value of a cell by
modifying other cells called variable or adjustable cells in a worksheet. This tool uses three main
algorithms: LP Simplex. Nonlinear and Evolutionary GRG. The first of them is used to solve
problems with linear constraints (Abdelwali et al., 2019; Fylstra et al., 1998; Rosales & Chávarri,
2021).

POM-QM

         This tool is the easiest to use used in various areas including operations research (Stojanović
& Regodić, 2016).

Lingo

         It is a simple tool to solve linear and nonlinear optimization problems. It helps us find the best
result that frequently involves the most efficient use of resources (Krishnaraj et al., 2015; Men & Yin,
2018; Rosales & Chávarri, 2021).
         This research aimed to determine the influence of the Invessoft program in solving problems
in operations research in industrial engineering students from a public university in Lima, Peru,
where Solver, POM-QM and Lingo used it as teaching resources.

2. Methodology

         The population consisted of 80 students, from sections A (control group) and B (experimental
group) of the morning and afternoon shifts of the Operational Research course, academic semester
2020-II, of the Professional School of Industrial Engineering of a public university. The course was
developed in the virtual modality. The applied sampling was non-probabilistic; the research design is
quasi-experimental with measurement only afterwards, because the students did not have previous
experiences related to the contents of the study subjects; Furthermore, the research groups were
selected by convenience criteria (Hernández-Sampieri & Mendoza, 2018). Students were selected
according to the order of enrollment for enrollment. The study was carried out with an experimental

ISSN: 2237-0722                                                                                       3064
Vol. 11 No. 4 (2021)
Received: 10.06.2021 – Accepted: 11.07.2021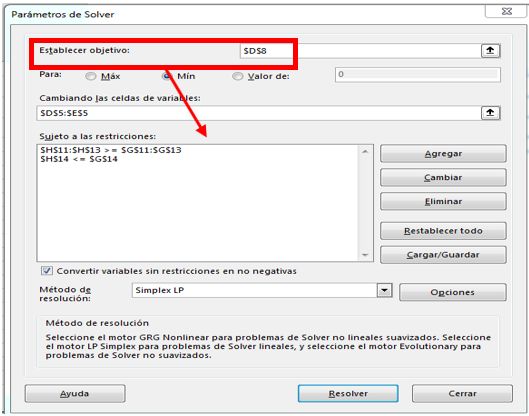
group and a control group made up of 40 students each group; For the experimental group, the Solver,
POM-QM and Lingo software were used to solve optimization problems applied to industrial
engineering, while the control group did not use any digital tool. Before the execution of the research
project, the students were informed about the characteristics of the research and respect for
anonymity, on the basis of which they gave their consent to participate in the research.
        In the experimental group, the Operational Research classes were developed using Solver,
POM-QM and Lingo software, while in the control group no software was used. Both groups had no
previous experiences with such software. At the end of the semester, the academic performance of
both groups was evaluated with respect to solving optimization problems applied to industrial
engineering. A written test with 20 questions distributed in four dimensions was used as an evaluation
instrument: Linear Programming (5 items), Waiting queues (5 items), Project Management (5 items),
Forecasts (5 items) using dichotomous scales: Yes (1), No (0). The test was individual and the
duration of the exam was 120 minutes; that it was validated by five experts (a methodologist, two
operations research engineers, a mathematician and an industrial engineer), whose coincidences were
0.94; In addition, reliability was found with the statistic Kr21 = 0.965 (Hernández-Sampieri &
Mendoza, 2018). After the examination was completed, the data was graded and processed. The
SPSS version 23 program was used for statistical analyzes.
        Before the beginning of the evaluation, the participants were informed of the reason for the
investigation, the informed consent was generated through Google Drive in consideration that we are
in social isolation due to COVID-19.

Example of Linear Programming Analysis using Software

        The company "Protection" belongs to the production sector, which is dedicated to the
manufacture of two products that are sold in its different stores in Lima, very useful to avoid the
greater risk of being infected with COVID-19; the company manufactures face shields and overalls.
Based on a study carried out by the Ministry of Health of Peru, the current inventories and in the face
of the exponential demand for this new wave of infections, the “Protection” company is forced to
increase its combined production between face shield and overalls, these they must total at least 450
units. On the other hand, it must also supply the order of 250 face shields and 136 overalls at least
respectively, to the district of Lima with the highest risk of contagion; the face shield takes 6 minutes
to manufacture, while the overalls require about 30 minutes to manufacture; in addition, for the
following week, there is 100 hours of manufacturing time. The objective of the company "Protection"

ISSN: 2237-0722                                                                                     3065
Vol. 11 No. 4 (2021)
Received: 10.06.2021 – Accepted: 11.07.2021
is to achieve the manufacture of these products with minimum costs to supply the Peruvian
population. Production costs are $ 0.5 for the face shield and $ 5 for the overalls.
Step 1: The decision variables are identified, the objective function, the restrictions and the
non-negativity condition are formulated, (see Fig. 1).
Fig. 1 - Identification of Variables
Step 2: We solve with the traditional method: we standardize and add slack variables, (see
Fig. 2).
Fig. 2 - Standardization and Slack Variables
After several interactions we reached the final table. Final table analysis, (see Fig. 3).
ISSN: 2237-0722 3066
Vol. 11 No. 4 (2021)
Received: 10.06.2021 – Accepted: 11.07.2021Fig. 3 - Results, Production, Shadow Prices
Using POM-QM
Step 1: We open the program, in this case the problem is about optimizing results, in this case
minimizing costs, so we will open the inventory tab in the module tree and enter “linear
programming”.
Step 2: Now we are going to create the data, let's put a title to this case to register it and have
it ordered. Then we add the quantities of restrictions and variables that we are going to analyze, as
well as the objective to want (minimize in this situation since we will find costs).
Step 3: In addition to this we have 5 more results, which complements the result obtained,
such as the graphs or the detailed procedure, (see Fig. 4).
Fig. 4 - Data Entry, Decision Variables
ISSN: 2237-0722 3067
Vol. 11 No. 4 (2021)
Received: 10.06.2021 – Accepted: 11.07.2021With Solver
Step 1: We start by creating our database in Excel, with the formulas for each box painted,
(see Fig. 5 and Table 1).
Fig. 5 - Graph of Variables
Table 1 - Determination of Variables in POM-QM
PRODUCTS Face protectors Coveralls
Amount(u)
Production Cost($/u) 0.5 5
TOTAL COST 0
Restrictions Excess Used Requirement
Minimal production of face shields 1 >= 250 0 -250
Minimum production of coveralls 1 >= 136 0 -136
Minimum Production of both products (u) 1 1 >= 450 0 -450
Production time (hr) 0.1 0.5Fig. 6 - Cost of Manufacturing the Implements
Step 3: we find the solution, answer sheet, (see Table 2).
Table 2 - Target Cell (Min)
Cell Name Original value Final value
TOTAL COST
$F$24 0 837
Face shields and coveralls
The total cost of production is $ 837.
Step 4: find the sensitivity sheet, (see Table 3).
Table 3 - Variable Cells
Final Reduced Target Allowable Allowable
Cell Name Value Cost Coefficient Increase Reduce
$F$21 Quantity (u) Face shields 314 0 0.5 4.5 0.2
$G$21 Quantity (u) Overalls 136 0 5.0 3.0 4.5
Optimum production is 314 face shields and 136 coveralls.
ISSN: 2237-0722 3069
Vol. 11 No. 4 (2021)
Received: 10.06.2021 – Accepted: 11.07.2021The cost range of face shields can vary between $ 0.5 - $ 0.2 = $ 0.3 and $ 0.5 + $ 4.5 = $
5.00, therefore the face shield target coefficient range is $ 0.3 to $ 5.0. Likewise, the range of the cost
of coveralls can vary from $ 5 - $ 4.5 = $ 0.5 and $ 5 + $ 3.0 = $ 8.0. As long as the objective
function coefficient is within these ranges the optimal production of face shields and coveralls will
not vary.
Table 4 - Restrictions
Final Shade Restriction Allowable Allowable
Cell Name Value Price Right side Increase Reduce
$J$27 Minimal production of face shields 314 0 250 64 1.00E+30
$J$28 Minimum production of coveralls 136 4.5 136 1.5 136
$J$29 Minimum production of both products 450 0.5 450 6 64
$J$30 Production time 99.4 0 100 1E+30 0.6
314 face shields are produced, 64 pieces more than the minimum quantity.
In Table 4, 136 overalls are produced, just like the minimum quantity required there is a
permissible increase of 1.5 and a permissible decrease of 136, then the interval (0,137.5) is obtained,
when working within this interval the costs will increase by this amount.
The company has 100 hours in the production area and uses 99.4 hours, it has 0.6 hours
available that it can reduce for its best use.
Lingo
Step 1: We open Lingo and insert the objective function to minimize and the respective
restrictions, (see Fig. 7).
Fig. 7 - Inserting Objective Function in Lingo Software
ISSN: 2237-0722 3070
Vol. 11 No. 4 (2021)
Received: 10.06.2021 – Accepted: 11.07.2021Step 2: Now we will analyze the results offered by Lingo, (see Fig. 8).
Fig. 8 - Results in Lingo
Step 3: Now we will analyze the sensitivity report obtained from Lingo, (see Fig. 9).
Fig. 9 - Sensitivity Report Analysis in Lingo
ISSN: 2237-0722 3071
Vol. 11 No. 4 (2021)
Received: 10.06.2021 – Accepted: 11.07.20213. Results
The performance levels of the students of the Operational Research course in the dimensions
Linear Programming, Waiting Queue, Project Management and Forecasts are shown in tables 5, 6, 7
and 8 respectively, evidenced an increase in the performance of the experimental group.
In table 5 it can be observed that in the Start and Process levels the performance levels were
higher in the control group than in the experimental group, however, in the Achieved level the
opposite is observed (20.0% and 52.5% for the control groups and experimental respectively)
indicating that students showed better performance at the end of the course with respect to Linear
Programming.
Similarly, in the Waiting Queue dimension, at the Start and Process levels, the performance of
the control group exceeds in percentage those of the experimental group, but at the Achieved level,
this last group presented higher performance (70.0%) compared to the control group (15.0). %)
(Table 6).
With regard to the Project Management dimension, the percentages of returns of the control
group, at the Start and Process levels, are higher in the control group than in the experimental group.
However, at the Achieved level, the percentage of performance of the experimental group (67.5%) is
higher than that of the control group (30.0%) (Table 7).
In the Forecasts dimension, higher performances of the control group are also observed in the
Start and Process levels, however, in the Achieved level the experimental group (65.0%) exceeds the
control group (30.0%) by more than double in the percentage of yield (Table 8).
Table 9 shows the performance levels in percentage considering the set of dimensions. Similar
to the previous results, in the Start and Process levels the control group presented higher percentages
of performance than in the experimental group, the opposite occurred in the Achieved level, thus
showing that in the final stage of the course the students that make up the experimental group had
greater aptitude in solving problems applied to industrial engineering compared to those of the
control group.
According to the results obtained, in the Start and Process levels the control group presents
higher performance, this can be explained because at those levels the students of the experimental
group are in a process of familiarization and learning of the software, however, once who manage to
master the use of softwares, their performance is evidenced in the quality, speed and efficiency for
solving the problems posed.
ISSN: 2237-0722 3072
Vol. 11 No. 4 (2021)
Received: 10.06.2021 – Accepted: 11.07.2021Table 5 - Comparison of Performance Levels of the Linear Programming Dimension
Control group Experimental group
Levels
% Count % Count
Start 12.5 5 5.0 2
Process 67.5 27 42.5 17
Achieved 20.0 8 52.5 21
TOTAL 100.0 40 100 40
Table 6 - Comparison of Performance Levels of the Queue Dimension
Control group Experimental group
Levels
% Count % Count
Start 15.0 6 5.0 2
Process 70.0 28 25.0 10
Achieved 15.0 6 70.0 28
TOTAL 100.0 40 100.0 40
Table 7 - Comparison of Performance Levels of the Project Administration Dimension
Control group Experimental group
Levels
% Count % Count
Start 15.0 6 7.5 3
Process 55.0 22 25.0 10
Achieved 30.0 12 67.5 27
TOTAL 100.0 40 100.0 40
Table 8 - Comparison of Performance Levels in the Forecasts Dimension
Control group Experimental group
Levels
% Count % Count
Start 10.0 4 7.5 3
Process 60.0 24 27.5 11
Achieved 30.0 12 65.0 26
TOTAL 100.0 40 100 40
Table 9 - Comparison of Performance Levels of the Operations Research Variable
Control group Experimental group
Levels
% Count % Count
Start 5.0 2 0.0 0
Process 82.5 33 10.0 4
Achieved 12.5 5 90.0 36
TOTAL 100.0 40 100 40
A normality test was applied to the data obtained by each group, which, since it comprised 40
elements in the sample, the Shapiro-Wilk test was used. It was determined that the data do not have a
normal distribution at a confidence level of pcontrast the results. According to this non-parametric test, differences were found between the control group and the experimental group (p
should focus on solving problems through algorithms and the intensive use of software, in the same
way Medel et al. (2018) develops educational software on a free platform, using Bootstrap, the
JavaScript library JQuery, as well as HTML5 and CSS3 as a framework, when performing controls,
they verified the quality of the application and the satisfaction of the requirements. Also (Falco et al.,
2018) affirms that software is an important complement in the teaching of the operational research
course as problems are formulated with many variables and the manual solution becomes complex. It
is evident that our proposal in the analysis of operations research is of utmost importance the
intensive use of software.
        The analysis of the evaluation results of linear programming revealed that 52.5% of the
experimental and 20.0% of the control group were at the achieved level; 42.5% of the experimental
group and 67.5% of the control group were located at the process level; while 5% and 12.5% of the
experimental and control group respectively at the beginning. In this regard, Rosales & Chávarri
(2021) state that to solve linear programming the best softwares are solver, lingo and pqm, coinciding
with our research on the use of softwares.
        When analyzing the results of the evaluation of waiting queues, 70.0% of the experimental
group and 15% of the control group reached the level achieved; 25% of the experimental group and
70.0% of the control group in process while 5% of the experimental group and 15.0% of the control
group in the beginning. The research of (Vallejos et al., 2017) highlights the importance of the
construction of graphic simulators in waiting queue models through the use of software in higher
education, highlighting the generation of reports for their interpretation, agrees with our position of
the use of tools that optimize learning.
        Regarding the results of project administration, 67.5% of the experimental group and 30.0%
of the control group were at the achieved level; 25.0% of the experimental group and 55% of the
control group in process; while 7.5% of the experimental group and 15.0 of the control group at the
beginning level. In this regard, Guerrero (2011) designs a learning model in project management
skills based on employability and professional competitiveness, agreeing with our proposal on the use
of tools that improve the teaching-learning process.
        When analyzing the prognostic results, 65.0% of the experimental group, 65.0% of the
experimental group and 30.0% of the control group were at the achieved level; 27.5% of the
experimental group and 60.0% of the control group in process; while 7.5% of the experimental group
and 10.0 of the control group at the beginning level. In the research carried out by (García et al.,
2016) he develops a technological support based on cases, he applied the ARIMA model of Box and

ISSN: 2237-0722                                                                                      3075
Vol. 11 No. 4 (2021)
Received: 10.06.2021 – Accepted: 11.07.2021
Jenkins with the aim of improving the forecasting models by providing different improvement
scenarios that coincide with our proposal in the intensive use of software
5. Conclusions
The results obtained show the importance of the application of computer tools in the
development of skills by industrial engineering students to solve optimization problems applied to
their professional careers. As a consequence, students also showed greater interest in the Operations
Research course and the number of failed students has been significantly reduced. Due to the current
pandemic situation, the implementation of virtual classes has made the use of digital tools essential,
giving great emphasis to TACs.
The use of software in the Operational Research subject for the construction of mathematical
models has had clear advantages compared to manual resolution. The present research work
constitutes a contribution in the continuous improvement in the teaching-learning of the Operational
Research course.
References
Abdelwali, H.A., Swilem, S.M., Shiaty, R. El, & Murad, M.M. (2019). Solving a transportation
problem actual problem using Excel Solver. International Journal of Engineering and Technical
Research, 0869(12), 13-17.
Alzate, P.M. (2018). Operations research. Fundamental concepts. Editions of the U.
Andia, R.X. (2016). Application of Operations Research to improve productivity in the customer
service process of the Consorcio Eulen del Perú de Servicios Generales S.A., Callao, 2016.
Universidad César Vallejo.
Ansari, A.H. (2019). Easy Simplex (AHA Simplex) Algorithm. Journal of Applied Mathematics and
Physics, 07, 23-30. https://doi.org/10.4236/jamp.2019.71003
Argota, G., & Coasaca, A. (2016). Management of operational research in occupational toxicology
through a dynamic model of planned strategy. Campus, 21(22), 137-149.
https://doi.org/10.24265/campus.2016.v21n22.01
Ávila, N.A. (2019). Support software prototype for learning the simplex and dual-simplex methods
pertaining to linear programming in operations research. Autonomous university of Bucaramanga.
Barreto, L.M. (2018). Application of the Theory of Queues to optimize the attention services of a
banking entity. Santiago Antúnez de Mayolo National University.
Bedoya-Flores, M.C. (2020). Fundamentals of Operational Research in Economic Sciences. Domain
of Sciences, 6(4), 1560-1572.
ISSN: 2237-0722 3076
Vol. 11 No. 4 (2021)
Received: 10.06.2021 – Accepted: 11.07.2021Bermúdez, Y. (2011). Linear, Integer and Mixed Programming Applications. Industrial Engineering. News and New Trends, II(7), 85-104. http://redalyc.org/articulo.oa?id=215024822007 Bravo, F.E., & Quezada, T.G. (2021). Virtual education at the university in times of covid-19. Entrepreneurial Spirit TES, 5(1), 154-166. https://doi.org/10.33970/eetes.v5.n1.2021.238 Broz, D., Mac Donagh, P., Arce, J., Yapura, P., Rossit, D., Rossit, D., Cavallin, A., & Ntonella. (2017). Operational Research, forestry engineering and sectoral problems: Faced with the need for a paradigm shift. Yvyraretá Forest Magazine, 24, 64-72. Caicedo, A.D., Benítez, D.S., & Ramírez, A.M. (2020). CEREBR-IO: Playful activity for teaching and strengthening Operations Research. R&D Research Magazine, 15(2), 148-162. https://doi.org/10.33304/revinv.v15n2-2020013 Canaza-Choque, F.A. (2020). Higher Education in the Global Quarantine: Disruptions and Transitions. Digital Journal of Research in University Teaching, 14(2), e1315. https://doi.org/10.19083/10.19083/ridu.2020.1315 Cao, R. (2002). Introduction to Simulation and Queue Theory. In Netbiblo. NETBIBLO, S.L. Cavallin, A., Rossit, D.A., Rossit, D.G., Broz, D.R., Frutos, M., & López, N.B. (2017). Teaching strategies to motivate students' learning in Operations Research content. Journal of the School of Improvement in Operations Research, 25(41), 54-68. Corcino, M.S., & Ramos, S.G.M. (2018). Application of the Theory of Queues to reduce the waiting time of the client in the Super Taxi Elegant company. César Vallejo University. Falco, M., Nuñez, I.J., Perea, L., Carlevari, R., & Tanzi, F. (2019). Tanziflex: software tool for solving linear programming problems. Ibero-American Journal of Educational Informatics, 29, 1-13. Falco, M., Núñez, I., Tanzi, F., & Muñoz, L.P. (2018). Addressing the Usability Analysis of Tanziflex, a Web Tool for Operations Research. RISTI - Iberian Journal of Information Systems and Technologies, 30, 91-107. https://doi.org/10.17013/risti.30.91-106 Ferreira, J. (2015). The spreadsheet as a tool for operations research. Polytechnic University of Cartagena. Figallo, F., González, M.T., & Diestra, V. (2020). Peru: Higher education in the context of the COVID-19 pandemic. Journal of Higher Education in Latin America, 8, 20-28. https://doi.org/10.14482/esal.8.378.85 Fylstra, D., Lasdon, L., Watson, J., & Waren, A. (1998). Design and use of the Microsoft Excel Solver. INFORMS Journal Applied Analytic, 28(5), 29-55. https://doi.org/10.1287/inte.28.5.29 García, A., Trujillo, Y., & Arza, L. (2016). Prognosis of success in the Improvement of Software Processes. Cuban Journal of Computer Science, 10(0), 15-30. Guerrero, D. A. M. (2011). Learning model and certification in competencies in the management of sustainable development projects, 692. Hernández-Sampieri, R., & Mendoza, C.P. (2018). Research methodology - The quantitative, qualitative and mixed routes. In McGraw-Hill (Ed.), Mac graw hill education. Hinostroza, L. del C. (2016). Management of forecasts and inventories to improve the performance of operations in a Peruvian textile company. San Ignacio de Loyola University. ISSN: 2237-0722 3077 Vol. 11 No. 4 (2021) Received: 10.06.2021 – Accepted: 11.07.2021
Juan, Á. A., Huertas, M. A., Steegmann, C., & Terrádez, M. (2006). Use and integration of ICT in
applied quantitative subjects: The experience of computer science and multimedia studies at the
UOC. Theory of Education. Education and Culture in the Information Society, 7(1).
Kowalski, V., Enríquez, H., Santelices, I., & Erck, M. (2015). Teaching algorithms in Operations
Research: an approach from competency training. Industrial engineering. News and New Trends, 4,
15. http://www.redalyc.org/html/2150/215047546008/
Krishnaraj, C., Jayakumar, A.A., & Shri, S. D. (2015). Solving supply chain network optimization
models using LINGO. International Journal of Applied Engineering Research, 10(19), 14715-14718.
Mayorga, J. (2018). Analysis of service time and arrival pattern according to the Queuing Theory of
patients from the Outpatient Health Services Production Unit of the Medicine specialty at the
Regional Hospital of Cusco, 2019. National University of San Antonio Abad del Cusco.
Medel, Y., Castroz, F., Fornaris, D., Hernández, O., & Plá Hernández, O. (2018). Educational
software on a free platform for the Operations Research subject. Journal of Legal Information, 0(0),
8.
Medina, P.D., Cruz, E.A., & Restrepo, J.H. (2008). Programming of jobs on a machine using an
integer linear programming model. Scientia et Technica, 14(40), 111-116.
Men, B.H., & Yin, S.Y. (2018). Application of LINGO in Water Resources Optimization Teaching
Based        on     Integer     Programming.    Creative    Education,     9,     2516-2524.
https://doi.org/10.4236/ce.2018.915190
Muñoz-Vergara, A. (2019). Application of the Waiting Lines Theory in the library service of an
educational organization in Cartagena - Colombia. Knowledge, Science and Freedom, 14(1), 171-
178. https://doi.org/10.18041/2382-3240/saber.2019v14n1.5236
Nares, M.E., & Trovato, G. (2012). Treatment and resolution of a linear programming problem with
random resources. Operative investigation, 20(33), 58-71.
Navarro-Hudiel, S.J. (2020). Trends in the use of resources and tools of educational technology in
university education in the face of the COVID-19 pandemic. El Higo Journal of Science and
Technology, 10(2), 111-122. https://doi.org/10.5377/elhigo.v10i2.10557
Niquin-Alayo, E., Vergara-Moreno, E., & Calderón-Niquín, M. (2018). FERTIDIF: software for
agricultural fertilization planning based on linear optimization with fuzzy costs. Scientia
Agropecuaria, (1), 103-112. https://doi.org/10.17268/sci.agropecu.2018.01.11
Peñaherrera-Larenas, M.F., Dager-López, D.E., Díaz-Márquez, I.F., & Vera-Vergara, K.D. (2020).
Operations research as an administrative tool in companies. FIPCAEC, 5, 334-349.
Pérez, E.L., & Ramírez, B. (2019). Operations research: From strategy to meaningful learning.
TECCIENCIA, 14(26), 9-14. https://doi.org/10.18180/tecciencia.2019.26.2
Puente, M.I., & Gavilánez, Ó.D. (2018). Linear programming for decision making. Chimborazo
Higher Polytechnic School.
Riveros, D.A. (2015). Application of distribution research to a logistics company. National
University of San Marcos.
Roca, E.A. (2019). Production programming in a steel company using mixed integer linear
programming. Pontifical Catholic University of Peru.

ISSN: 2237-0722                                                                                3078
Vol. 11 No. 4 (2021)
Received: 10.06.2021 – Accepted: 11.07.2021
Rodríguez, M. (2018). The incorporation of information and communication technologies in
universities:     Experiences       and    practices.   Pedagogical Trends, 31, 275-288.
https://doi.org/http://dx.doi.org/10.15366/tp2018.31.015
Rojas, G., & Reyes, S. (2019). Application of PERT CPM to reduce the cycle time of project closure
in the company Semi Perú Montajes S.A.C. Ricardo Palma University.
Rojas, M. J., Silva, A. M., & Correa, L. (2014). Information and communication technologies in
education: Research trends. Academia y Virtualidad Magazine, 7(2), 27-40.
Romero, V., Palacios, J., García, S., Coayla, E., Campos, R., & Salazar, C. (2020). Social distancing
and remote learning. Villarreal Chair, 8(1), 81-92. https://doi.org/10.24039/cv202081766
Rosales, P.P., & Chávarri, P.E. (2021). Plan-Demia: Planning the production of tons of plastic
through linear programming: Using the Excel Solver and Lingo program. CTSCAFE
Multidisciplinary Research Journal, 5(3), 42-54.
Sánchez, E., & Rosete, A. (2020). Experiences in the subject Operations Research in the Computer
Engineering career. Ibero-American Journal of Technology in Education and Education in
Technology, 27, 83-88. https://doi.org/10.24215/18509959.27.e9
Simón-Marmolejo, I., Santana-Robles, F., Granillo-Macías, R., & Piedra-Mayorga, V.M. (2013).
Simulation with FlexSim, a source in hybrid system operations. Scientific, 17(1), 39-49.
Sousa, E. (2014). Evaluation of software for teaching operations research: A case study. Pontifical
Catholic University of Goiás.
Stojanović, M., & Regodić, D. (2016). The Improvement of the inventory process in the company
«Benlian Food» Niš by applying the Pom-Qm 4.0 Software. International Scientific Conference on
ICT and e-business related research, 257-264. https://doi.org/10.15308/sinteza-2016-257-264
Ureta, L., & Rossetti, G. (2020). TACs in the construction of disciplinary knowledge: A learning
experience with university students. Ibero-American Journal of Technology in Education and
Education in Technology, 26, 100-109. https://doi.org/10.24215/18509959.26.e11
Valencia, E.R., & Hidalgo, C. (2018). Operational research. Linear Programming, Solved Problems
with Detailed Solutions (1st ed.). Technical University of Ambato.
Vallejos, Y., Ávila Herrera, J. F., Mariño, S. I., Nacional, U., & Nacional, U. (2017). 1, 2, 3. 13, 5-20.
Velásquez, A. (2008a). Operational Research and Epidemiology I. Peruvian Journal of
Epidemiology, 12(1).
Velásquez, A. (2008b). Operations Research and Epidemiology II. Peruvian Journal of
Epidemiology, 12(2).
Velásquez, C., Berger, E., Gambini, L., & De la Cruz, L. (2008). Operational Research Models in
human resource management. PESQUIMAT Magazine of the F.C.M. from the Universidad Nacional
Mayor de San Marcos, 11(2), 81-87.
Velázquez, B., & Vinueza, V.V. (2017). Application of queuing theory models to healthcare
management in health centers. Nursing Investigates: Research, Linkage, Teaching and Management,
2(1), 28-33.

ISSN: 2237-0722                                                                                      3079
Vol. 11 No. 4 (2021)
Received: 10.06.2021 – Accepted: 11.07.2021
You can also read