Orbital pericenters and the inferred dark matter halo structure of satellite galaxies
←
→
Page content transcription
If your browser does not render page correctly, please read the page content below
Mon. Not. R. Astron. Soc. 000, 000–000 (0000)     Printed 16 December 2020     (MN LATEX style file v2.2)

                                               Orbital pericenters and the inferred dark matter halo
                                               structure of satellite galaxies

                                               Victor H. Robles?1,2 , James S. Bullock1
                                               1 Department of Physics and Astronomy, University of California, Irvine, 4129 Frederick Reines Hall, Irvine, CA 92697, USA
                                               2 Yale Center for Astronomy and Astrophysics, New Haven, CT 06520, USA
arXiv:2012.07865v1 [astro-ph.GA] 14 Dec 2020

                                               16 December 2020

                                                                                 ABSTRACT
                                                                                 Using the phat-ELVIS suite of Milky Way-size halo simulations, we show that subhalo
                                                                                 orbital pericenters, rperi , correlate with their dark matter halo structural properties.
                                                                                 Specifically, at fixed maximum circular velocity, Vmax , subhalos with smaller rperi are
                                                                                 more concentrated (have smaller rmax values) and have lost more mass, with larger
                                                                                 peak circular velocities, Vpeak , prior to infall. These trends provide information that
                                                                                 can tighten constraints on the inferred Vmax and Vpeak values for known Milky Way
                                                                                 satellites. We illustrate this using published pericenter estimates enabled by Gaia
                                                                                 for the nine classical Milky Way dwarf spheroidal satellites. The two densest dSph
                                                                                 satellites (Draco and Ursa Minor) have relatively small pericenters, and this pushes
                                                                                 their inferred rmax and Vmax values lower than they would have been without pericenter
                                                                                 information. For Draco, we infer Vmax = 23.5 ± 3.3 km s−1 (compared to 27.3 ± 7.1
                                                                                 km s−1 without pericenter information). Such a shift exacerbates the traditional Too
                                                                                 Big to Fail problem. Draco’s peak circular velocity range prior to infall narrows from
                                                                                 Vpeak = 21 − 49 km s−1 without pericenter information to Vpeak = 25 − 37 km s−1
                                                                                 with the constraint. Over the full population of classical dwarf spheroidals, we find
                                                                                 no correlation between Vpeak and stellar mass today, indicative of a high level of
                                                                                 stochasticity in galaxy formation at stellar masses below ∼ 107 M . As proper motion
                                                                                 measurements for dwarf satellites become more precise, they should enable useful
                                                                                 priors on the expected structure and evolution of their host dark matter subhalos.
                                                                                 Key words: galaxies: halos – Milky Way – galaxies: satellite galaxies –cosmology:
                                                                                 dark matter

                                               1   INTRODUCTION                                                  ing multiple/strong interactions with the MW disc could
                                                                                                                 help to alleviate these discrepancies (D’Onghia et al. 2010;
                                               The cold dark matter (CDM) paradigm shows excel-
                                                                                                                 Zolotov et al. 2012; Sawala et al. 2016; Wetzel et al. 2016;
                                               lent agreement with the observed cosmological evolution
                                                                                                                 Garrison-Kimmel et al. 2017). Alternatively, some works
                                               (Springel, Frenk & M. 2006; Vogelsberger et al. 2014). How-
                                                                                                                 have explored tidal stripping in non-standard dark matter
                                               ever, below the Local Group scale (≤ 1Mpc) there are poten-
                                                                                                                 models (Robles et al. 2015; Robles et al. 2019; Dooley et al.
                                               tial mismatches such as the discrepancy between the num-
                                                                                                                 2016; Di Cintio et al. 2017).
                                               ber of observed and expected satellite galaxies (Klypin et al.
                                               1999; Moore et al. 1999; Tollerud et al. 2008) and the well-           An assessment of the strength of tidal disruption in real
                                               known Too-Big-too-Fail (TBTF) issue (Boylan-Kolchin,              MW dwarf galaxies requires a comparison with simulations
                                               Bullock & Kaplinghat 2011, 2012; Garrison-Kimmel et al.           whose baryonic potential closely matches that of our MW.
                                               2014) where CDM subhalos are too dense to host the bright-        While MW-mass hydrodynamic CDM simulations are not
                                               est Milky-Way (MW) dwarf galaxies. Current CDM simu-              a priori selected to accurately fit the MW baryonic mass
                                               lations of MW-like galaxies (Mvir ≈ 1012 M ) suggest that         distribution, the approach of including time-dependent ana-
                                               tidal disruption of small-mass (Vmax ≤ 40km/s1 ) halos hav-       lytical potentials in CDM simulations has proven to be suc-
                                                                                                                 cessful in modeling in detail the baryonic component in our
                                                                                                                 galaxy at much lower computational cost allowing a rapid
                                               ?E-mail: victor.roblessanchez@yale.edu                            exploration of different MW halo masses within observa-
                                               1We define Vmax as the maximum of the circular velocity Vmax =    tional constraints (Kelley et al. 2019; Garrison-Kimmel et al.
                                               max[GM(< r)/r]1/2 .                                               2017).

                                               © 0000 RAS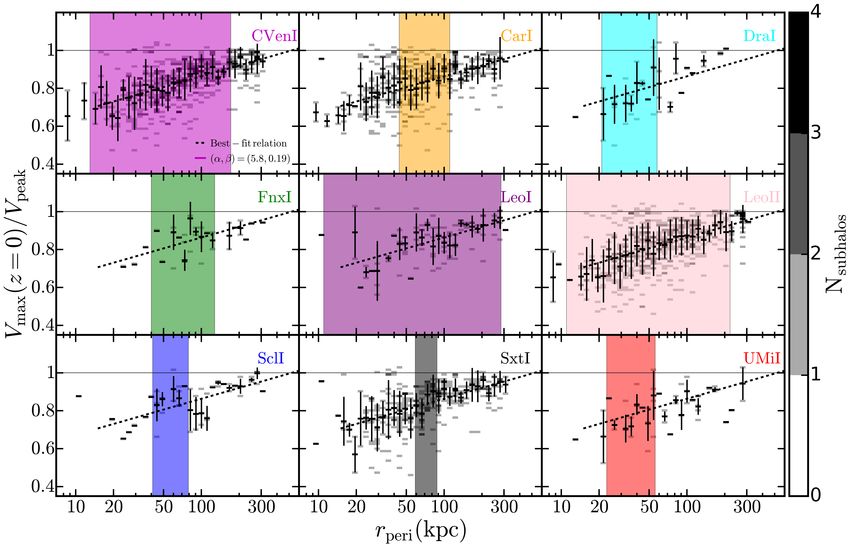
2 Victor H. Robles and James S. Bullock
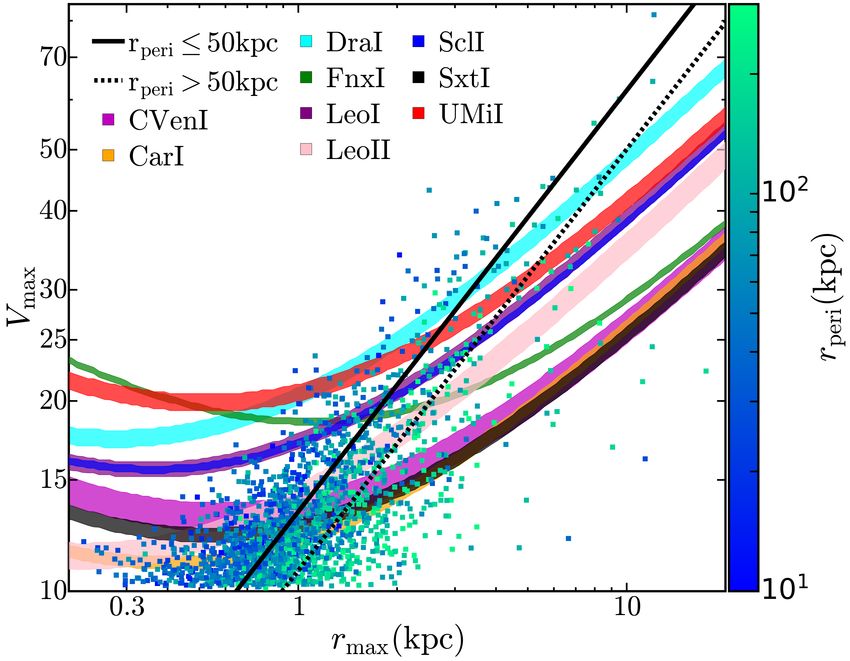
Figure 1. Points show Vmax − rmax values at z = 0 for subhalos
in all simulations, color coded by their pericenter radii. Subhalos
with smaller pericenters are more concentrated, with smaller rmax
values at fixed Vmax . The straight lines show power-law fits to the Figure 2. 2D-Histogram of the ratio between the maximum
median relation for subhalos with rperi ≤ 50kpc (solid black) and circular velocity at z = 0 and its value prior to infall for all sub-
rperi > 50kpc (dashed line), respectively. The colored bands show halos with Vmax ≥ 10kms−1 in the phat-ELVIS MW suite as a
the 1-σ region of parameter space allowed for the nine bright MW function of the pericenter distance from the center of their re-
dwarf spheroidal galaxies (LV ≥ 105 L ) based on their measured spective host. We show the median value of the simulation data
half-light masses assuming NFW profiles. with its 1-σ scatter for each radial bin (magenta crosses) and our
analytic best-fit relation describing the Vmax (z = 0)/Vpeak -rperi
correlation (cyan line), which traces the median. This correlation
In this Letter, we use simulations presented first in Kel- indicates that subhalos undergo larger tidal stripping for decreas-
ing pericenter distances. The smallest pericenters have current
ley et al. (2019) to explore correlations between a subhalo’s
Vmax values reduced by almost a factor of two compared to the
pericenter radius and its past mass loss and associated den- value prior to infall.
sity structure today. We show that smaller pericenters cor-
relate with having higher concentrations and more mass loss
and explore how this correlation can be used to provide cles each. We characterize a subhalo prior to infall into its
tighter constraints on the maximum circular velocities of host via Vpeak , which is defined as the Vmax when the sub-
the nine classical MW dwarf spheroidal galaxies (dSphs). We halo’s mass is maximized across time. For each subhalo we
rely on pericenter distances from Fritz et al. (2018) derived its maximum circular velocity, Vmax , and the radius where
from the most recent data given by the Gaia collaboration the circular velocity reaches its maximum, rmax directly from
Gaia Collaboration et al. (2018a,b). the particle data. All other simulated subhalo quantities are
taken from the halo catalogs and merger trees made public
by Kelley et al. (2019).
To compare with MW dSphs, we note that these are
2 SIMULATIONS AND DATA
dispersion-supported dark matter-dominated systems. For
We use data from the Phat-ELVIS suite (Kelley et al. 2019) such systems, the mass within the deprojected half-light ra-
simulations, which model Milky Way-size dark matter ha- dius r1/2 (M1/2 :=MdSph (r1/2 )) is well-constrained by line-
los using dark-matter-only simulations coupled with time- of-sight velocity measurements (Wolf et al. 2010). Combin-
dependent embedded baryonic potentials that mimic the ing velocity dispersion measurements from Wolf et al. (2010)
Milky Way (MW) galaxy. The suite consist of 12 high- and the updated deprojected half-light radii from Muñoz
resolution zoom-in (Katz & White 1993; Oñorbe et al. 2014) et al. (2018) assuming a Plummer profile for the stellar dis-
simulations of MW hosts, which span virial masses Mvir ≈ tributions we obtain M1/2 for each dwarf 2 .
0.7 − 2 × 10¹² M , each with an embedded galaxy potential We derive constraints on each classical dSph Vmax fol-
grown to match the observed Milky Way disc and bulge to- lowing (Boylan-Kolchin, Bullock & Kaplinghat 2011), who
day (for details see Kelley et al. 2019)). These simulations showed that the following approach provides the correct
have a dark matter particle mass of mdm = 3 × 10⁴ M and mass to better than 10 per cent at resolved radii. We first as-
a Plummer equivalent force softening length of 37 pc. Kelley sume that the current density distribution of a subhalo host-
et al. (2019) found that subhalo catalogs are complete down ing a dwarf can be modeled by an Navarro, Frenk & White
to down to a maximum circular velocity Vmax > 4.5kms−1 (1997) (hereinafter NFW) profile, which is a good approxi-
(or a total bound mass M ' 5 × 10⁶ M ). mation within rmax for typical CDM subhalos. For each of
For each simulation, we select all haloes within 300 kpc
of the host’s centre and with a present maximum circular
velocity Vmax ≥ 10 kms−1 (M & 108 M ). With this selec- 2 our main conclusions hold for other choices for the stellar den-
tion we are studying systems with more than ∼ 3000 parti- sity profile (Muñoz et al. 2018).
© 0000 RAS, MNRAS 000, 000–000Orbital pericenters and inferred DM halo structure 3
Figure 3. 2D-histogram of the Vmax − rmax values for those subhalos that are consistent with the M1/2 , r1/2 values of the respective
MW dSph labeled in each panel. The vertical regions are the constraints in pericenter distances obtained in Fritz et al. (2018). Subhalos
that fall inside these regions are simultaneously consistent with observed orbital pericenter constraints and internal dynamical constraints
at M1/2 . The black points with error bars show the radially-binned median plus 1 − σ scatter. The dashed lines are the best-fit relation
for the entire sample, Eq. (1)(dashed-line). In each case the best-fit relation tracks well the respective median distribution.
the nine classical dSphs we search for the combination of val- The original TBTF problem (Boylan-Kolchin, Bullock
ues {Vmax , rmax } defining an NFW halo that would yield an & Kaplinghat 2011) was framed using a plot similar to that
enclosed subhalo mass consistent with the observationally- in Fig. 1. The points that sit above the Draco (DraI) and
inferred dSph mass within 1-σ, i.e. that Msub (r1/2 ) matches Ursa Minor (UMiI) bands are the problematic CDM subha-
the observed M1/2 . los. These “massive failures” (with Vmax & 30 km s−1 ) are
too dense to host any known dwarf. One proposed solution
to the problem has involved enhanced depletion associated
with a central galaxy potential (Zolotov et al. 2012; Brooks
3 RESULTS & Zolotov 2014). Here we see that even when depletion asso-
ciated with a realistic MW baryonic potential is present, the
In Fig. 1, we show the range of {Vmax , rmax } values that are
issue is not necessarily solved, with many points sitting high
consistent with the 1-σ confidence region of M1/2 for each
in the plot. As we will discuss below, the two densest dwarfs
of the nine classical
√ dSphs. Each contour has a global mini- (UMiI and DraI) happen to also have observed pericenters
mum at Vmax = 3σlos,? corresponding to rmax =r1/2 (Wolf
that are fairly small (. 50 kpc). This exacerbates the prob-
et al. 2010). Also shown are the Vmax -rmax values for sub-
lem: subhalos with smaller pericenters tend to over-populate
halos in the phat-ELVIS suite that have resolved densities
problematic region above Draco and Ursa Minor in this plot.
at rmax (we use the definition of convergence in CDM ha-
That is, conditional on these galaxies having small pericen-
los discussed in Hopkins et al. (2018) in which halo densities
ters, we would infer even lower Vmax values (. 25 km s−1 )
converge past the radius enclosing 200 particles). The points
than may have been expected otherwise. We return to this
are color coded by each subhalo’s pericenter radius rperi , and
issue below.
demonstrate a trend for smaller rperi to have smaller rmax at
fixed Vmax . The trend is well-characterized by a power-law When small halos are accretted into larger hosts and
fit: (rmax /1kpc) = A(Vmax /10 kms−1 )1.5 . If we divide sub- become subhalos, they begin to lose mass. One measure
halos into those with rperi < 50 kpc and those with rperi > 50 of the degree of mass loss is the ratio Vmax /Vpeak , where
kpc, we find that the normalization in the Vmax -rmax rela- lower ratios imply more mass loss. Typically, Vpeak esti-
tion shifts from A = 0.648 to A = 0.893 as we go from the mates for MW dSphs are inferred statistically based on their
small pericenter group to the larger pericenter group. observationally-inferred Vmax values and the expectation for
© 0000 RAS, MNRAS 000, 000–0004 Victor H. Robles and James S. Bullock
the full Vmax /Vpeak distribution from an entire subhalo pop-
ulation (e.g. Boylan-Kolchin, Bullock & Kaplinghat 2012).
In Fig. 2 we show that with if constraints on rperi are avail-
able, this may allow us to narrow the inferred range. Specifi-
cally, we show the the ratio of Vmax at present to its value at
infall, Vpeak , for all selected subhalos in the 12 MW runs as a
function of the subhalo’s pericenter with respect to the host
center. We find a robust trend of decreasing for smaller rperi
(Pearson correlation coefficient r=0.54). Though not shown,
we find that this trend holds independent of the MW host
virial mass in our sample and is independent of the precise
choice of the minimum subhalo Vmax . We find the average
trend is described by
β
Vmax (z = 0) rperi
= log10 α , (1)
Vpeak 30 kpc
with α = 5.80 and β = 0.19 as best-fit parameters. Al-
though more complex fitting functions are possible, this sim-
ple equation captures the systematic effect of increasing halo
mass loss with pericenter distance. We find our fit is repre-
sentative of the radially-binned median distribution (ma-
genta points in Fig. 2) for 12 kpc . rperi ≤ 300 kpc. This fit
becomes a poor description below ∼ 12 kpc. The detailed
trend below this scale is difficult to discern because there are
so few surviving subhalos with very small pericenter (Kelley
et al. 2019; Robles et al. 2019).
For each of the nine dSph galaxies in the MW we show
in Fig. 3 the relation between Vmax /Vpeak and rperi (obtained
from the merger trees) of the subhalos (gray points) that
could host the dSph (those overlapping with the respective
shaded region in Fig. 2). We also show the best-fit relation
Eq. (1), noting that our fit is representative of the radially-
binned median distribution (black points) in all cases.
The colored bands in Fig. 3 illustrate how observed or-
bital information may be used to tighten estimates of mass Figure 4. Constraints for Vmax (top) and Vpeak (bottom) for
loss for each dwarf. Specifically they reflect observational es- each the nine bright MW dwarf galaxies obtained from subhalos
timates of each dwarf galaxy’s pericenter from Fritz et al. that satisfy the dynamical constraints (dashed lines) and those
(2018). These authors report rperi values assuming two dif- that in addition satisfy the pericenter constraints from Gaia(solid
ferent MW virial masses (0.8, 1.6 × 10¹² M ). These masses lines). We show the measured stellar masses from McConnachie
span the host mass ranges for the halos we use from the (2012), we intentionally shifted the mass of Ursa Minor by 104 M
to visually distinguish it from Draco, we found that Vmax and
phat-ELVIS suite. We take the lowest and highest 1-σ values
Vpeak are not correlated with M? . For a given Vmax there is a
for either of the virial masses assumed in Fritz et al. (2018)
range of Vpeak due to the dependence of rperi in Eq (1), in the
to bracket the observational range. By imposing these new bottom panel we show the full allowed range of Vpeak inferred
constraints, we identify a population of subhalos that are from our constraints of Vmax within 1σ (upper panel).
consistent with both internal mass estimates M1/2 and in-
ferred rperi ranges for each dwarf.
Table 1 presents Vmax and Vpeak ranges for each of the The most notable differences are for Draco and Ursa
nine MW dSphs, inferred both with and without orbital Minor, both of which have fairly well constrained pericen-
pericenter constraints. We provide results for median, mean, ter measurements, rperi . 50 kpc. For Draco, the esti-
and one sigma (1σ) ranges in each case. Fig. 4 summarizes mated range for z = 0 maximum circular velocity shifts
these results by plotting Vmax (top panel) and Vpeak (bot- from Vmax ' (20 − 43) to (20 − 27) kms−1 . For Ursa Minor,
tom panel) as a function of stellar mass (taken from Mc- Vmax ' (20 − 31) narrows to (20 − 26) kms−1 . Their inferred
Connachie 2012). In both panels, the solid black lines show Vpeak ranges shift from (21 − 50) to (25 − 37) kms−1 in the
±1σ ranges when pericenter constraints are included and the case of Draco and from (21 − 50) to (25 − 37) kms−1 for Ursa
dotted lines show how those ranges increase when pericen- Minor.
ter constraints are neglected. In the top panel, the black and
gray points are the inferred averages with and without peri-
center constraints. In most cases, inferred Vmax values shift
4 SUMMARY AND DISCUSSION
lower by 20 − 80%, with somewhat smaller 1σ ranges. The
range of inferred Vpeak values are similarly tighter. Excep- We have used phat-ELVIS suite of Milky Way-size halo simu-
tions are CVenI, LeoII, and LeoI, all of which have largely lations to show that subhalo orbital pericenters, rperi , corre-
unconstrained pericenters ranges (see Fig. 3). late with internal dark matter halo structural properties and
© 0000 RAS, MNRAS 000, 000–000Orbital pericenters and inferred DM halo structure 5
Without Gaia DR2 With Gaia DR2 Without Gaia DR2 With Gaia DR2
Galaxy r1/2 Vemax (z = 0) V̄ max ± 1σ emax (z = 0) V̄max ± 1σ Vpeak,min Vpeak,max Vpeak,min Vpeak,max
V
kms−1 kms−1 kms−1 kms−1 kms−1 kms−1 kms−1 kms−1
[pc]
CVen I 589 13.59 13.82 ± 1.51 13.52 13.70 ± 1.35 12.90 22.29 13.61 21.69
Carina I 401 11.70 11.96 ± 1.21 11.65 11.80 ± 0.76 11.27 19.15 12.67 15.81
Draco I 279 25.40 27.33 ± 7.02 22.31 23.48 ± 3.36 21.30 49.96 24.60 36.58
Fornax I 1093 18.91 19.47 ± 1.67 18.87 19.03 ± 0.58 18.67 30.75 20.89 24.93
Leo I 352 19.40 21.06 ± 4.93 19.51 21.13 ± 4.98 16.92 38.21 17.02 38.37
Leo II 223 13.82 14.23 ± 2.46 13.73 14.10 ± 2.28 12.34 24.53 12.73 24.07
Sculptor I 365 19.26 20.11 ± 3.22 18.33 18.96 ± 2.26 17.71 33.93 19.79 26.90
Sextans I 539 12.73 12.95 ± 1.15 12.54 12.74 ± 0.73 12.38 20.50 14.09 16.45
Ursa Minor I 531 24.70 25.97 ± 5.10 22.26 22.85 ± 2.69 21.88 45.19 24.73 34.46
Table 1. Columns are: (1) galaxy name; (2) Galaxy 3D half-light radius from Muñoz et al. (2018); (3) median values of Vmax at z = 0
and (4) mean Vmax at z = 0 and 1-σ uncertainties when we do not use constraints from Gaia pericenters; analogous quantities are given
in cols. (5) and (6) when we further apply Gaia pericenter constraints to derive the median and mean Vmax today. (7) Vpeak,min and
col. (8) Vpeak,max are the lower and upper bounds of allowed values inferred from Eq. (1) using the 1-σ lower and upper bounds for
V̄max when Gaia pericenter constraints are not considered, columns (9) and (10) show the bounds when Gaia pericenter information is
included.
that this provides an avenue for inferring tighter constraints were accreted more recently and that can be accurately
on satellite galaxies Vvmax and Vpeak values. As illustrated counted. As discussed in Kelley et al. (2019), convergence
in Figures 1 and 2, subhalos with smaller pericenters tend tests suggest that our halo counts are mostly complete down
to be more concentrated, with smaller rmax values at fixed to Vmax > 4.5 km s−1 , or only ∼ 150 particles. Of partic-
Vmax , and also have larger Vpeak values at fixed Vmax . We ular relevance to this work is whether or not internal halo
then used published pericenter radii for the nine classical structures, e.g., Vmax /Vpeak distributions at fixed Vmax , are
MW dSph galaxies from (Fritz et al. 2018) to infer tighter tracked appropriately. We have limited our analysis to ha-
estimates on their maximum circular velocities today and los with Vmax > 10 km s−1 , or & 3000 particles. According
prior infall (see Fig. 4 and Table 1). Even with these tighter to the results of Errani & Navarro (2020), these should be
constraints on satellite circular velocites, we see no indica- fairly well resolved. For Draco and Ursa Minor, we are look-
tion of a trend between stellar mass and halo mass at these ing at halos with Vmax > 20 km s−1 , which have & 40, 00
scales. particles, so quoted results for these interesting systems are
Among the galaxies we have considered, Draco and Ursa likely robust. If anything, we will be biased towards missing
Minor are affected the most by including pericenter informa- halos with lower Vmax /Vpeak values at small pericenter. For
tion. These, the densest dSph satellites, have relatively small example, Vmax /Vpeak . 0.3 would imply & 99% mass loss. In
pericenters (rperi . 50 kpc) and this pushes their inferred the unlikely event that this this bias is significant, it would
Vmax values lower than they would have been without peri- mean that the measured trend would become even stronger
center information. We find that both Draco and Ursa Minor at higher resolution. This will be a topic to explore in future
appear to inhabit subhalos with Vmax ' 20 − 27 km s−1 (at simulations.
one sigma) and are less dense than would be expected for the Our results appear consistent with the anti-correlation
most massive subhalos with small pericenters (see Fig. 1). observed between the dark matter densities and pericenter
This exacerbates the traditional TBTF problem (Boylan- radii of bright MW dwarfs reported by Kaplinghat, Valli
Kolchin, Bullock & Kaplinghat 2011, 2012). The inferred & Yu (2019). In their work, the authors found that dwarf
range of Vpeak values is also tightened for these galaxies. galaxies closer to the center of the MW tend to be hosted by
Both galaxies have inferred peak maximum circular veloc- denser CDM subhalos. We find that at fixed Vmax subhalos
ities (prior to infall) that put them in range to have been with small pericenters are indeed denser (smaller rmax , see
significantly affected by reionization, Vpeak ' 25 − 37 km Fig.1), as seems to be the case for MW satellites. At fixed
s−1 (e.g. Gnedin 2000; Bullock, Kravtsov & Weinberg 2000; Vpeak we find a similar trend (not shown). An alternative ex-
Fitts et al. 2017; Benı́tez-Llambay et al. 2017). planation that might drive an even stronger anti-correlation
It is worth considering whether our results are affected may be that dark matter is self-interacting, which could
by numerical resolution. There is a fair amount of evidence drive core-collapse in high concentration low-mass subha-
to suggest that simulations such as ours do not accurately los (Nishikawa, Boddy & Kaplinghat 2020). This was not
track halo survival after they have lost a significant (& 99%) observed in the analogous phat-ELVIS SIDM MW simula-
amount of mass, with ∼ 3000 particles appearing to be a tion in Robles et al. (2019) for a velocity-independent cross-
critical limit below which halos disrupt unphysically (e.g. section over particle mass σ/m = 1cm2 /g. More simulations
Van den Bosch & Ogiya 2018; Errani & Navarro 2020). In are required to test the statistically significance of the abun-
terms of halo counts alone, this effect should not affect cur- dance of core-collapsing halos and whether a larger σ/m is
rent cosmological zoom simulations significantly, since ac- needed.
creted halo mass functions rise steeply with increasing mass, As proper motion measurements begin to improve,
dn/dM ∼ M −1.8 (e.g. Giocoli, Tormen & van den Bosch there is hope that we will get a better sense of both the
2008). This means that for every halo of mass M that was 3D orbital motions of MW satellite galaxies, but also their
accreted long ago and has lost 99% of its original mass (100 internal 3D velocity dispersion (Massari et al. 2018; Mas-
M ), there are as many as ∼ 4000 halos of mass M that sari, D. et al. 2020). These internal motions should provide
© 0000 RAS, MNRAS 000, 000–0006 Victor H. Robles and James S. Bullock
tighter constraints on dark matter halo structure directly Moore B., Ghigna S., Governato F., Lake G., Quinn T.,
(Lazar & Bullock 2020). Our results suggest that improved Stadel J., Tozzi P., 1999, ApJ, 524, L19
orbital trajectories will only increase the power of these in- Muñoz R. R., Côté P., Santana F. A., Geha M., Simon
ternal mass measurements to infer dark matter halo prop- J. D., Oyarzún G. A., Stetson P. B., Djorgovski S. G.,
erties, both past and present. 2018, ApJ, 860, 66
Navarro J. F., Frenk C. S., White S. D. M., 1997, ApJ, 490,
493
Nishikawa H., Boddy K. K., Kaplinghat M., 2020, Phys.
ACKNOWLEDGMENTS Rev. D, 101, 063009
Oñorbe J., Garrison-Kimmel S., Maller A. H., Bullock J. S.,
VHR acknowledges support by the Yale Center for Astron-
Rocha M., Hahn O., 2014, MNRAS, 437, 1894
omy and Astrophysics postdoctoral prize fellowship and the
Robles V. H., Kelley T., Bullock J. S., Kaplinghat M., 2019,
Gary A. McCue postdoctoral fellowship. JSB and VHR were
MNRAS, 490, 2117
supported by NSF AST-1518291, HST-AR-14282, and HST-
Robles V. H., Lora V., Matos T., Sánchez-Salcedo F. J.,
AR-13888.
2015, ApJ, 810, 99
Sawala T. et al., 2016, MNRAS, 457, 1931
Springel V., Frenk C. S., M. W. S. D., 2006, Nat, 440, 1137
Tollerud E. J., Bullock J. S., Strigari L. E., Willman B.,
REFERENCES
2008, ApJ, 688, 277
Benı́tez-Llambay A. et al., 2017, MNRAS, 465, 3913 Van den Bosch F. C., Ogiya G., 2018, MNRAS, 475, 4066
Boylan-Kolchin M., Bullock J. S., Kaplinghat M., 2011, Vogelsberger M. et al., 2014, MNRAS, 444, 1518
MNRAS, 415, L40 Wetzel A. R., Hopkins P. F., Ji-hoon K., Faucher-Giguere
—, 2012, MNRAS, 422, 1203 C.-A., Keres D., Quataert E., 2016, ApJ, 827, L23
Brooks A. M., Zolotov A., 2014, The Astrophysical Journal, Wolf J., Martinez G. D., Bullock J. S., Kaplinghat M.,
786, 87 Geha M., Muñoz R. R., Simon J. D., Avedo F. F., 2010,
Bullock J. S., Kravtsov A. V., Weinberg D. H., 2000, ApJ, MNRAS, 406, 1220
539, 517 Zolotov A. et al., 2012, ApJ, 761, 71
Di Cintio A., Tremmel M., Governato F., Pontzen A.,
Zavala J., Bastidas Fry A., Brooks A., Vogelsberger M., This paper has been typeset from a TEX/ LATEX file prepared
2017, MNRAS, 469, 2845 by the author.
Dooley G. A., Peter A. H. G., Vogelsberger M., Zavala J.,
Frebel A., 2016, MNRAS, 461, 710
D’Onghia E., Springel V., Hernquist L., Keres D., 2010,
ApJ, 709, 1138
Errani R., Navarro J. F., 2020, arXiv e-prints,
arXiv:2011.07077
Fitts A. et al., 2017, MNRAS, 471, 3547
Fritz T. K., Battaglia G., Pawlowski M. S., et al., 2018,
A&A, 619, A103
Gaia Collaboration et al., 2018a, A&A, 616, A1
—, 2018b, A&A, 616, A12
Garrison-Kimmel S., Boylan-Kolchin M., Bullock J. S.,
Kirby E. N., 2014, MNRAS, 444, 222
Garrison-Kimmel S. et al., 2017, MNRAS, 471, 1709
Giocoli C., Tormen G., van den Bosch F. C., 2008, MNRAS,
386, 2135
Gnedin N. Y., 2000, ApJ, 542, 535
Hopkins P. F. et al., 2018, MNRAS, 480, 800
Kaplinghat M., Valli M., Yu H.-B., 2019, MNRAS, 490, 231
Katz N., White S. D. M., 1993, ApJ, 412, 455
Kelley T., Bullock J. S., Garrison-Kimmel S., Boylan-
Kolchin M., Pawlowski M. S., Graus A. S., 2019, MNRAS,
487, 4409
Klypin A., Kravtsov A. V., Valenzuela O., Prada F., 1999,
ApJ, 522, 82
Lazar A., Bullock J. S., 2020, Monthly Notices of the Royal
Astronomical Society, 493, 5825
Massari D., Breddels M. A., Helmi A., Posti L., Brown A.
G. A., Tolstoy E., 2018, Nature Astronomy, 2, 156–161
Massari, D., Helmi, A., Mucciarelli, A., Sales, L. V., Spina,
L., Tolstoy, E., 2020, A&A, 633, A36
McConnachie A. W., 2012, AJ, 144, 4
© 0000 RAS, MNRAS 000, 000–000You can also read


