Performance Assessment of Equal Gain Combining Fusion Rule in Cognitive Networks
←
→
Page content transcription
If your browser does not render page correctly, please read the page content below
International Journal of Engineering Trends and Technology                                       Volume 70 Issue 4, 146-151, April 2022
ISSN: 2231 – 5381 / https://doi.org/10.14445/22315381/IJETT-V70I4P212                           © 2022 Seventh Sense Research Group®

                                                           Original Article

       Performance Assessment of Equal Gain Combining
              Fusion Rule in Cognitive Networks
                                            Aparna Singh Kushwah1, Vineeta Nigam2
                      1,2
                         Department of Electronics, University Institute of Technology, RGPV, Bhopal, India

                                                       1aparna.kushwah@gmail.com

         Received: 22 February 2022          Revised: 31 March 2022        Accepted: 04 April 2022     Published: 26 April 2022

Abstract - Optimal use of spectrum is based on the investigation of the primary signal present in the spectrum. Various
methods are discussed in the literature for signal detection. The research presented is about the performance evaluation of the
Equal Gain Combining fusion rule in cognitive radio. The analysis of equal gain combining is executed using MATLAB
simulations. The energy detector is used for individual sensing at each Cognitive Radio. Computer simulations reveal that
Equal Gain Combining shows considerable detections at low SNR levels. As the level of SNR is increases, the detection
capability also increases without imposing any burden on the channel regarding channel-state information. Further, the effect
of varying the Time-Bandwidth Product and the total cognitive radios participating in the sensing is also analyzed. Results
show that the ideal value for the Time-Bandwidth Product (u) is 10. Results reveal that the optimal number of cognitive radios
used for combined sensing is 5.

Keywords - Equal Gain Combining, Energy Detection, Probability of false alarm, Time bandwidth product.

1. Introduction                                                         conditions [3]. Cognitive users are radios which are
     Spectrum is a finite resource, so it should be efficiently         accessing the wireless channel. They are of two types-
allotted to the requesting users. In recent times there has been        Primary user (PU) is the sole owner of the bandwidth, and
a need for an almost infinite spectrum to cater to the needs of         Secondary users (SU) are self-seeker users who use the
the young generation. The available bandwidth should be                 bandwidth allotted to the primary user when the primary user
distributed in such a way that every user gets time to access           is not transmitting [4]. Wireless channels are used for
the channel. However, when the channels are statically                  sensing. Cognitive radio uses two types of channels- sensing
assigned to a fixed number of licensed users, it is observed            and reporting channels. The sensing channels are used for
that these channels never remain busy at all times.                     sensing the presence of the PU. The reporting channels are
Sometimes the channel is free and can be accessed by non-               used to send sensing decisions. Spectrum Sensing is the
licensed users of the network. This fact is exploited by a              process of identifying the blank spaces in the spectrum and
cognitive radio to give service to more users, thereby                  concluding whether the PU signal is available or not in the
increasing the overall system capacity. A cognitive radio               spectrum [5]. Spectrum Management is distributing the
intelligently senses the free slots in the band and uses them to        available spectrum among a large number of new users.
transmit their signals [1]. But the main problem is keeping             Spectrum Sharing creates a scenario in which all the users
track of the free time of the channel. For this purpose, the            can use the spectrum on a time-scheduling basis [6].
users continuously sense the intended channel and report
whenever there are blank spaces in the usage of the channel.                Cooperative Spectrum Sensing, also known by its
The need to sense the channel gives rise to vast research in            acronym ‘CSS’ is a technique in which multiple cognitive
the field of spectrum sensing. A lot of methods are available           radios sense the channel simultaneously and mutually decide
to sense the channel. The task is to select the ideal method            whether the channel can be used by a SU or not [7]. All CRs
for spectrum sensing. Spectrum sensing is limited by a                  provide their individual sensing information to a common
number of factors, viz., random nature of noise, shadowing              hub termed a fusion center (FC). The FC merges the
(especially in urban areas), multipath fading, receiver                 individual data to form a composite variable to describe the
sensitivity etc. [2].                                                   inherence of the PU in the channel. The Fusion center is the
                                                                        central processing unit of the spectrum sensing model. The
    Cognitive radio is a sensing device that is capable of              FC uses different methods to combine the results of different
adjusting its own operating features like operating frequency,          cognitive radios to decide. These can be grouped into Hard
modulation format etc., depending on the current traffic                and Soft fusion rules. Hard fusion is basically coarse sensing

                   This is an open access article under the CC BY-NC-ND license (http://creativecommons.org/licenses/by-nc-nd/4.0/)
Aparna Singh Kushwah & Vineeta Nigam / IJETT, 70(4), 146-151, 2022

 involving hard detection, while soft fusion is fine sensing             2.2 Equal Gain Combining
 with soft detection. Hard Fusion: When the CRs decide and                 Various algorithms can be used to form a composite signal
 send only 1 bit (0 or 1) independent decision about the                 received from diverse branches. Each branch is given the
 availability of the PU signal. Mainly three hard fusion rules           same weight factor despite its signal amplitudes. However, to
 are defined- OR, MAJORITY-Logic and AND rule [8].                       avoid signal cancellation, co-phasing of all signals is done
                                                                         [10].
      Soft Fusion: The CRs send their whole sensing data to              The FC combines the SNR (γ) of all the branches.
 the fusion center. In a fusion center, the signals are combined                         L
 according to some algorithm. Some of the soft fusion rules                       γ = Σ γi                 (1)     i=1
 defined in literature are maximal ratio, equal gain, selection            It is assumed that the noise levels are equal on all the
 combining and square law selection [9].                                 branches.

      This study is focused on Equal gain combining as it is             r1                   a1
                                                                                   Receiver 1
 the best among the receiver combining techniques as it does
 not need to estimate the channel fading amplitudes. It is less
 complex. EGC is widely implemented in collaborative                     r2                                        a2
 wireless networks to reduce the complexity of the system.                         Receiver 2                                         A   Receiver
                                                                                                                                      D
 2. System Model                                                         r3                                         a3
     Soft fusion employs the concept of diversity provided by                      Receiver 3                                         D
 combining the sensing data of associated radio channels to                                                                           E
 form a more accurate sensing result. Multi-user sensing                 rL         aL        aL                                      R
 improves the detection sensitivity of the system without any                      Receiver L
 overhead in terms of individual CR capability. A number of
 CR experiencing different channel fading have a better                                                  Phase Shifters     Attenuators
 chance of detecting the PU. Their individual local sensing is
 combined at the Fusion Center.                                                                Fig. 2 Equal gain combining

     For individual sensing, a simple energy detector is                 3. Analytical Design of the System
 considered assuming nothing is known about the PU.                          The signal from the integrator in the energy detector is
                                                                         used as a test parameter to test for the validity of the two
 2.1 Energy Detector                                                     hypotheses, H0 and H1. The signal received r(t) is a
      As the name suggests is a sensor that observes the                 combination of transmitted signal s(t) and noise signal nʹ(t):
 absolute energy contained in the signal received for a
 particular time duration. The computed energy is compared                          r(t) = hʹ s(t) + nʹ(t)                (2)
 to a pre-determined threshold value. It consists of the
 following elements:                                                     here       hʹ = 0 in case H0 is true
                                                                                    hʹ = 1 in case H1 is true
   •   Band Pass Filter (BPF): filters the frequency which
       does not fall within the limits of intended bandwidth.
                                                                               Foremost the signal received is made band-limited by
   • Squaring device: each term of the signal received for a             filtering with the help of a bandpass filter, the transfer
       certain time duration is squared using this block.                function for which is given below.
   • Summing device: all these squared values are added to
       get the energy of the signal received.                                             2   , |f - fc| ≤ B
   • Integrating device: integrates the calculated energy for            Hʹ(f) =         √N0ʹ                             (3)
       a particular time period to get the estimate of the
       original signal.                                                                  0      , |f - fc| ≥B
   Decision device: estimate is compared with a pre-
 determined threshold value to judge in favor of one of the                   The band-limited signal obtained from the BPF is
 hypotheses.                                                             processed using the squaring device and added to get the
                                                                         energy content of the signal received. Next, it is integrated to
BPF       Squarer       Adder         Integrate     Decision             obtain the estimate of the signal received, which is then used
                                                     Device              to check the validity of one of the two hypotheses, H0 and
                                                                         H1 .
                      Fig. 1 Energy detector

                                                                   147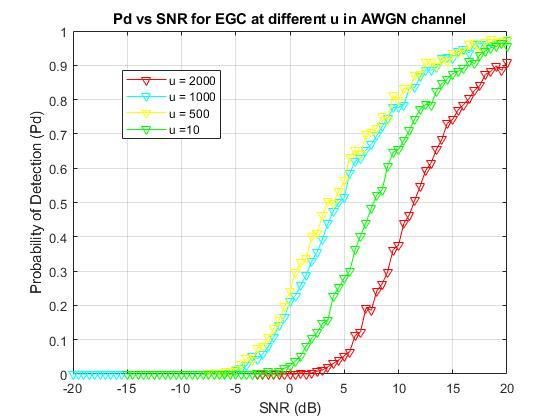
Aparna Singh Kushwah & Vineeta Nigam / IJETT, 70(4), 146-151, 2022

For the simplification of analysis, the noise energy E nʹ is                            Case 1: when Y< λ, but the signal is present, this is
averaged over a time interval (0, T). So we get:                                        calculated as the probability of missed detection (Pm).
                                                                                        Case 2: when Y > λ, but the signal is not present, this is
                     T                               2uʹ                                calculated as the probability of false alarms (Pf).
    Enʹ = ∫ nʹ2(t) dt =                 1       ∑ nʹj2               (4)
                     0                          2B j=1                                  The false alarm probability is derived from the PDF of Y

Where uʹ = TB is the product of bandwidth and time. The test                                     ∞
metric Y is formulated as                                                                   Pf = ∫ fy(y) dy                              (9)
                                                                                        The detection probability is derived from the CDF of Y
           2uʹ
    Y = ∑ nʹj2                                                       (5)                         Pd = 1 - Fy(y)                                   (10)
                    j=1
                                                                                        After simplification, the expressions for Pd and Pf are
     Now Y is modeled as the sum of 2uʹ Gaussian random
variable having zero mean and variance unity. In that case, Y                                    Pf = Г(uʹ, λ/2)                                  (11)
will follow the central chi-square distribution (χ2) with 2uʹ                                           Г(uʹ)
degree of freedom. This same approach is applied when a
signal is also present in conjunction with noise.
                                                                                            Pd = Q(√2γ,√ λ) = 1- Pm                               (12)
     In that case, the decision metric Y will follow non-
central chi-square distribution with 2uʹ degree of freedom                              4. Simulation Details
and non-centrality parameter (2γ) and can be stated with the                                 Simulation Setup is created in order to simulate the
following equation:                                                                     above model for EGC employing energy detection at each
                                                                                        CR. The implementation is executed in MATLAB following
            χ22uʹ            H0                                                         the Monte Carlo method. The performance is measured in
    Y=                                                               (6)                terms of different probabilities. The setup included 1 PU, 5
            χ22uʹ (2γ)               H1                                                 SUs and an FC. Each SU tests 1000 samples for sensing the
                                                                                        PU signal. The simulations are run for a range of SNR (-20
The PDF and CDF of Y are given by equations (7) and (8),                                dB to 20 dB) as each CR may sense the channel at a different
respectively.                                                                           SNR. The channel is assumed to be disturbed by AWGN
                                                                                        noise.
           1      yuʹ-1 ey/2                          H0                                Fig. 3 shows the simulation model used
          2 ʹ Гuʹ
           u
                                                                                                            Generate PU signal
fy(y) =                                                              (7)
                                   (2γ + y)/2
          1. y           ʹ
                    (u -1)/2
                               e                Iuʹ-1 (√2yγ)   H1
          2 2γ                                                                                          Generate random noise signal

                                                                                                      Calculate received signals at every SU
   Where Г(.) is the gamma function, and I(.) is the
modified Bessel’s function.
                                                                                                Calculate energy of received signal at every SU
            Fy(y) = 1 – Quʹ (√λ, √y)                                 (8)

     Here λ is a pre-determined threshold. By comparing the                               At FC apply EGC algorithm to form consolidated energy measure E
test metric Y with the threshold, it can check whether H 0 or
H1 is true.
     P(Y < λ) H0                                                                                             Calculate threshold λ
     P(Y > λ) H1
                                                                                             YES                       NO
    The sensing performance of a cognitive network can be                                                          Check if
evaluated on the basis of certain probabilities. When the test                                                      E>λ
metric crosses the threshold value, the CR senses the
                                                                                                                                               PU absent
presence of PU. The probability is known as the probability                              PU present
of detection (Pd). Sometimes, the test metric may not give the
correct information about the signal. Then two cases arise:                                                  Fig. 3 Flowchart for Simulation

                                                                                  148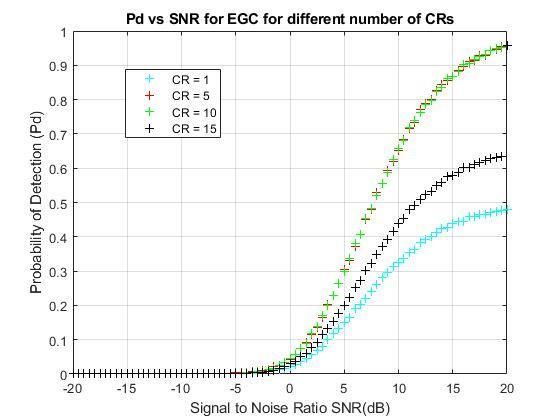
Aparna Singh Kushwah & Vineeta Nigam / IJETT, 70(4), 146-151, 2022

5. Results & Analysis                                                      probability also increases from 0.9761 to 0.9998. There is an
     Computer simulations for 10000 iterations are done, and               increase of approximately 23.7 % in the overall detections.
the results are presented in this paper as plots between P d and           However, the false alarms indicating the fake presence of the
SNR. Simulation results prove that equal gain combining                    PU signal increased by 65%.
shows good performance at a small number of false alarms
Fig. 4 shows the variation of Pd relative to SNR, assuming
different values of Pf. The different curves show that EGC
attains higher values of Pd at very low values of Pf, even at a
low value of SNR. Comparing the curves for Pf = 0.01 and
Pf = 0.75, it is obvious that detection probability increases at
the cost of an increase in false alarms.

                                                                            Fig. 5 Pmd vs SNR for EGC at different values of Pf in AWGN channel

                                                                                Fig. 5 demonstrates the variation of missed detections in
                                                                           relation to SNR. Curves show that the Pmd is low in the case
                                                                           of lower values of Pf, indicating fewer detections are missed
                                                                           during sensing, thereby showing good sensing accuracy. And
                                                                           decreases with the increasing value of SNR.
  Fig. 4 Pd vs SNR for EGC at various values of Pf in AWGN channel
                                                                                From Fig. 4 and Fig. 5, it can be verified that EGC gives
     The detailed observations on the values of Pd are                     fairly good sensing performance results even when the
compiled in Table 1 below. Values of Pd corresponding to a                 channel is disturbed by AWGN noise.
set of Pf and SNR values are recorded from the computer
simulation.                                                                     The effect of a time-bandwidth product on the detection
                                                                           ability of a CR is also analyzed. The value of Pf is kept fixed
  Table1. Pd at Different SNRs for different values of Pf                  at 0.0001. Fig. 6 shows that the bandwidth-time product has
  Pf     0.01       0.1     0.25        0.5      0.75                      an impact on the values of Pd with respect to SNR. It shows
  SNR                          Pd                                          that as we increase the value of u from 10 to 2000, the value
  (dB)                                                                     of detection sensitivity deteriorates. For u = 10 and u =50,
   -20   0.0435 0.3673 0.5190           0.7710 0.9238                      the Pd achieves a satisfactory value at around -5 dB, but as
   -15   0.0450 0.3739 0.5253           0.7812 0.9308                      the value is changed to u = 100, Pd decreases and continues
   -10   0.0498 0.4135 0.5613           0.8081 0.9405                      to decrease for u = 500. It is clear from the plot that the
                                                                           optimum value for u is 10, as depicted in the simulations.
    -5   0.0913 0.4915 0.6389           0.8511 0.9573
     0   0.2363 0.6474 0.7544           0.9120 0.9789
                                                                                The sensing performance also depends on the total
     5   0.5406 0.8005 0.8684           0.9528 0.9950
                                                                           number of cooperating sensors used in the sensing in EGC.
    10   0.7919 0.8990 0.9278           0.9707 0.9967                      Fig. 7 shows how Pd changes as we increase the number of
    15   0.9263 0.9644 0.9725           0.9869 0.9997                      CRs used for sensing. Pf is again fixed at 0.0001, assuming
    20   0.9761 0.9890 0.9909           0.9962 0.9998                      very less false alarms. It is observed that the performance is
                                                                           enhanced by using EGC as compared to the case when only 1
     The values listed in Table 1 verify that the sensing                  CR was sensing the channel. For CR = 10, Pd does not show
performance of EGC increases with the increasing value of                  any considerable increase. But with CR = 15, the curve falls,
SNR. At around 20 dB, which is considered to be an ideal                   showing a decrease in detection probability. So it can be said
value for data and voice transmission, the probability of                  that the optimal value is 5 CRs for good detection capability
detection attains a perfect value (approximately 0.9761). It is            without any overhead.
noticed that as Pf is increased from 0.01 to 0.75, the detection

                                                                     149
Aparna Singh Kushwah & Vineeta Nigam / IJETT, 70(4), 146-151, 2022
5. Conclusion
In this paper, the Equal Gain combining soft fusion rule
is implemented, assuming energy detection spectrum sensing
at all the cognitive radios. The mathematical modeling and
the simulation details are explained, thereby verifying the
simplicity and utilization of EGC. The detection probability
achieves high values in the case of EGC even at lower values
of SNR. The results show that the ideal value for the time-
bandwidth product u is 10. Above this value of u, the
performance degrades. Also, the ideal number of CRs used
for sensing is 5. Increasing the number of CRs will not
outperform the sensing decisions to a large extent. The false
alarms are assumed to be very less by fixing P f = 0.0001 in
both cases. EGC is free from estimating the channel state
information, unlike other diversity combining algorithms like
Fig. 6 Pd vs SNR for EGC at different values of u at Maximal Ratio Combining. Overall, EGC shows excellent
Pf = 0.0001 in AWGN channel performance in all cases.
6. Acknowledgements
The authors give thanks for this work being supported
by the University Institute of Technology, RGPV, Bhopal
Fig. 7 Pd vs SNR for different numbers of Cognitive Radios at Pf =
0.0001 in AWGN channel
References
[1] Simon Haykin, Cognitive Radio: Brain-Empowered Wireless Communications, IEEE Journal On Selected Areas In Communications, 23(2) (2005).
[2] D. Taguig, B. Scheers, and V. LeNir, Data Fusion Schemes for Cooperative Spectrum Sensing in Cognitive Radio Networks, Military Communications
and Information Systems Conference, (2012).
[3] Tevfik Y¨ucek and H¨useyin Arslan, A Survey of Spectrum Sensing Algorithms for Cognitive Radio Applications, IEEE Communications Surveys &
Tutorials, 11(1) (2009).
[4] Pankaj Verma, Brahmjit Singh, On the decision fusion for cooperative spectrum sensing in cognitive radio networks, Wireless Networks, (2016).
[5] Hano Wang, Gosan Noh, Dongkyu Kim, Sungtae Kim and Daesik Hong, Advanced Sensing Techniques of Energy Detection in Cognitive Radios,
Journal of Communications and Networks, 12(1) (2010).
[6] Dong-Jun Lee, Adaptive Cooperative Spectrum Sensing using Random Access in Cognitive Radio Networks, IEEE 24th International Symposium on
Personal, Indoor and Mobile Radio Communications: MAC and Cross-Layer Design Track, (2013).
[7] J. Tong, M. Jin, Q. Guo and Y. Li, Cooperative Spectrum Sensing: A Blind and Soft Fusion Detector, IEEE Transactions on Wireless Communications,
17(4) (2018) 2726-2737.
[8] G. Sharma, R. Sharma, Performance comparison of hard and soft fusion Techniques for Energy Efficient CSS in Cognitive Radio, International
Conference on Advanced Computation and Telecommunication (ICACAT), (2018).
[9] Srinivas Nallagonda, S. Kumar Bandari, Sanjay Dhar Roy and Sumit Kundu, Performance of Cooperative Spectrum Sensing with Soft Data Fusion
Schemes in Fading Channels, Annual IEEE India Conference (2013).
[10] Doha Hamza, Sonia Aïssa and Ghassan Aniba, Equal Gain Combining for Cooperative Spectrum Sensing in Cognitive Radio Networks, IEEE
Transactions on Wireless Communications, 13(8) (2014).
[11] Sanjeewa P. Herath, Nandana Rajatheva, Analysis of Equal Gain Combining in Energy Detection for Cognitive Radio over Nakagami Channels, (2008)..
[12] Goutam Ghosh, Prasun Das and Subhajit Chatterjee, Cognitive Radio and Dynamic Spectrum Access –A Study, International Journal of Next-Generation
Networks (IJNGN), 6(1) (2014).
[13] Abdullah Yaqot and Peter Adam Hoeher, Efficient Resource Allocation in Cognitive Networks, IEEE Transactions on Vehicular Technology, 66(7)
(2017).
150Aparna Singh Kushwah & Vineeta Nigam / IJETT, 70(4), 146-151, 2022
[14] Yan Cai, Yiyang Ni, Jun Zhang, Su Zhao and Hongbo Zhu, Energy efficiency and spectrum efficiency in underlay device-to-device communications-
enabled cellular networks China Communications. (2019).
[15] Ishu Gupta, Ashish Hari and O. P. Sahu, Hardware Implementation of Energy Detection Scheme in Cognitive Radio Networks, International Conference
on Computing, Power and Communication Technologies (GUCON) , (2018).
[16] A. S. Tellambura, et al., Energy detection based cooperative spectrum sensing in cognitive radio networks, IEEE Transactions on Wireless
Communications, 10(4) (2011) 1232-1241.
[17] Nan Zhao, Fei Richard Yu, Hongjian Sun and Arumugam Nallanathan, Energy-efficient cooperative spectrum sensing schemes for cognitive radio
networks, EURASIP Journal on Wireless Communications and Networking 2013, Springer.
[18] Hano Wang, Jason Noh, Dongkyu Kim, Sungtae Kim, Datsik Hong, Advanced Sensing Techniques of Energy Detection in Cognitive Radios, Journal of
Communication and Networks, 12(1) (2010).
[19] Omar Altrad and Sami Muhaidat, A new mathematical analysis of the probability of detection in cognitive radio over fading channels, EURASIP Journal
on Wireless Communications and Networking, (2013).
[20] Risheek Kumar, Analysis of Spectrum Sensing Techniques in Cognitive Radio, International Journal of Information and Computation Technology. 4(4)
(2014) 437-444.
[21] Qin Qin, Zeng Zhimin, Guo Caili, A Study of Data Fusion and Decision Algorithms Cooperative Spectrum Sensing, Sixth International Conference on
Fuzzy Systems and Knowledge Discovery, IEEE. (2009).
[22] Nisha Yadav and Suman Rathi, A Comprehensive Study of Spectrum Sensing Techniques in Cognitive Radio, International Journal of Advances in
Engineering and Technology, (2011).
[23] Ian F. Akyildiz, Brandon F. Lo and Ravikumar Balakrishnan, Cooperative Spectrum Sensing in Cognitive Radio Networks: A Survey, Physical
Communication, ScienceDirect, Elsevier.(2010).
[24] W. Ejaz, N. ul Hasan, S. Lee and H. S. Kim, I3S: Intelligent Spectrum sensing scheme for cognitive radio networks, EURASIP Journal of Wireless
Communications and Networking, Springer. (2013).
[25] Bin Shen, Taiping Cui, Kyungsup Kwak, Chengshi Zhao and et al., An Optimal Soft Fusion Scheme for Cooperative Spectrum Sensing in Cognitive
Radio Network, IEEE Communications Society, WCNC proceedings. (2009).
151You can also read