Physical simulation study on grouting water plugging of flexible isolation layer in coal seam mining - Nature
←
→
Page content transcription
If your browser does not render page correctly, please read the page content below
www.nature.com/scientificreports
OPEN Physical simulation study
on grouting water plugging
of flexible isolation layer in coal
seam mining
Ang Li1*, Bingnan Ji1, Qiang Ma2, Yadong Ji2, Qian Mu3, Wenzhong Zhang2, Pengfei Mu2,
Liang Li4 & Chunhu Zhao2
Deep coal seam mining often leads to water resource loss due to bedrock water entering the workings
of the mine and is discharged adjacent to the mining area. Using the geological conditions of the
Maiduoshan coal mine, this paper applied a physical simulation experiment. The specified rock above
the coal seam was hydraulically fractured in advance to form a postmining grouted fracture network,
followed by grouting to construct a flexible isolation layer that blocked the infiltration of groundwater
from the aquifer into the water-conducting fracture zone. Stress sensors, flow sensors and strata
displacement monitoring technology were deployed inside the experimental material to study the
spatial distribution characteristics and evolution law of the water-conducting fracture zone in the
overlying rocks. Analysis of the water-conducting fracture zone development law, stress variation,
overburden evolution characteristics, fracturing and grouting sequence of the flexible isolation layer
and the effect of postmining grouting on the water barrier was conducted. These experiments verified
the feasibility of fracture and grouting of the flexible isolation layer. These research results will provide
practical guidance for the transition from the current safe and efficient mining methods to safe and
green mining methods of deep coal mining in the western mining areas of China.
With the large-scale and efficient mining of shallow resources, some mines have entered the deep mining s tage1,2.
Based on a preliminary statistical analysis of the hydrogeology and mining methods of large coal bases in Shen-
dong, Shanbei, and Ningdong in western China, the overburden structure and ground stresses of the deep coal
resources mined are significantly different from those of shallow mining. The flow field of direct and indirect
aquifers, conditions of recharge, flow and draining, and evolution of water quality in deep mining all have
complicated variations. In particular, effects on the ecological water table and surface ecology of the system can
occur3,4). Most of the mining areas in western China have water shortages and fragile ecological e nvironments5–8.
Deep mining disrupts the overburden structure and causes bedrock water to enter the workings of the mine
along with water-conducting fractures, resulting in discharge and loss of water resources. Furthermore, these
processes destroy the groundwater circulation system affecting the surface e cology9,10.
In China, technical research regarding the mining and safety of shallow coal resources has preceded surface
ecological protection, resulting in a large amount of water resource loss and ecological d amage11,12. Therefore,
deep coal mining in western mining regions require the protection of water resources and surface ecology, while
ensuring safe and efficient mining operations13. Deformation and fracture of deep mining overburden and rock
movement patterns are required from the perspective of mine production and safety,on the other hand, from
the perspective of groundwater flow fields, it is necessary to master the characteristics of the groundwater flow
field and evolution of mining water-filled aquifers.
Many scholars have conducted studies on water resource loss as a result of deep coal mining14–16. Gu17,18
proposed the establishment of a groundwater reservoir storage system, which can store groundwater in the voids
of rock formations at the goaf by constructing a dam. Wang et al.19,20 proposed a conditional partition method
to protect water during mining by developing mining methods for various coal seam characteristics to control
groundwater level decline. Based on the water protection mining concept, Fan et al.21 proposed a high-intensity
1
School of Architecture and Civil Engineering, Xi’an University of Science and Technology, Xi’an 710054, Shaanxi,
China. 2Coal Technology & Engineering Group Corp, Xi’an Research Institute of China, Xi’an 710077, Shaanxi,
China. 3Coal Technology & Engineering Group, Chongqing Institute of China, Chongqing 400039, China. 4Shaanxi
Xiaobaodang Mining Co., Ltd., Shaanxi 719000, Yulin, China. *email: ang.li3399@gmail.com
Scientific Reports | (2022) 12:875 | https://doi.org/10.1038/s41598-022-04813-y 1
Vol.:(0123456789)
www.nature.com/scientificreports/
Figure 1. Water level contours in the No. 2 coal roof aquifer.
coal mining methods for the roof and floor, effectively protecting water resources in shallow aquifers. Stachowski
et al.22 proposed concepts for water reclamation and the development of postmining areas after the Adamów
Lignite coal mining was terminated, which can effectively increase the local water resources. Ma et al.23 evalu-
ated the hydraulic connection between the Gaozhuang coal mine and the overlying lake and successfully applied
overlying sandstone burst water control techniques to these coal seams. Although the abovementioned scholars
have employed several methods to preserve water for coal mining, the concept of constructing a flexible isolation
layer to prevent the loss of shallow water resources has not been proposed. By constructing a flexible isolation
layer, the mining failure zone can be transformed, the influence range of mining fissures can be controlled, and
the water environment conditions that satisfy the natural circulation of groundwater and surface ecology will be
maintained or rebuilt. Using this method, the groundwater and surface ecology after mining can be maintained
or even improved over the original state. This method is direct and convenient and can provide a new and effec-
tive method for the protection of shallow water resources in coal seam mining.
There are various methods used to study coal seam roof failure and the levels in aquifers due to the develop-
ment of water conduction fracture zones. However, considering the difficulty of implementing field observations
and the complexity of theoretical calculations to reproduce the deformation process of rock seams, including
the fracture and grouting process of flexible isolated layers, it is best to use physically similar simulations for
analysis. With the advantages of having a simple operation, clear and intuitive observation results, and short cycle
time, physical simulations are now an essential research method in studying rock movement control s cience24–27.
Accordingly, this thesis therefore uses the deep coal seam mining conditions of the Maiduoshan coal mine
and simulates the key technology of "flexible isolation layer" isolation reconstruction through physical similar-
ity simulation experimental methods. Analysed the synergistic relationship between the mining stress field in
the bedrock layer, overburden fracture field and mining disturbance seepage field. The simulation reproduces
the spatial distribution characteristics of the water-conducting fracture zone, and the evolution process of the
"flexible isolation layer" below the aquifer is simulated during mining. This research provides guidance for the
protection of water resources in western mining areas of China.
Engineering hydrogeological conditions
The Maiduoshan coal mine is a major mines in the Ningdong coal base in the western mining area that has
entered the deep mining phase; located in the north–south reversible tectonic zone of the North China Platform
and the folded and alluvial zone of the Ordos Basin. The fracture and fold tectonics are well developed and large
in scale. With a total thickness of 358.25 m, the coal stratum in the Maiduoshan minefield is the Jurassic Middle
Yanan Formation. The main lithologies are grey–white medium and coarse sandstone and grey and dark grey
siltstone. The No. 2 coal located in the upper part of the Yanan Formation subcycle serves as the most dominant
mineable coal seam in the minefield.
The fissure pore aquifer of the Naoro Formation in the Middle Jurassic is the main aquifer that influences
mining at coal seam No. 2; the water level elevation is shown in Fig. 1. The sandstone at the bottom of this layer
is relatively stable and mainly consists of coarse-grained sandstone, which is the direct top plate of the No. 2
coal seam. According to the sedimentary rotation, lithological characteristics and hydrogeological features of
the formation, the gritstone at the bottom of the Naoro Formation is the main symbol layer, which divides the
aquifer into upper and lower sections. Within the mining field, the roof water-resisting layer of the sandstone
aquifer at the bottom of the Naoro Formation generally exists, blocking the hydraulic connection between the
upper and lower sandstone aquifers of the Naoro Formation. This behaviour enables the lower sandstone aquifer
of the Naoro Group sandstone to be a direct water-filled aquifer for the main mining 2 coal seam. On the other
hand, the upper sandstone aquifer of the Naoro Formation is an indirect water-bearing aquifer and has little
influence on the mining of the coal seam. The presence of siltstone and mudstone with water-resistant properties
at different depths makes the vertical hydraulic connection of the aquifer extremely weak. Groundwater hydraulic
flow fields are predominantly controlled by laminar flow.
Hydraulic conductivity between the aquifers occurs once the height of the two zones, formed because of rock
movement caused by mining, reaches the erosion surface or the overlying water-rich layer. The fault fracture
zones of the eastern and western boundaries have poor stratigraphic stability, high lithological variability and
Scientific Reports | (2022) 12:875 | https://doi.org/10.1038/s41598-022-04813-y 2
Vol:.(1234567890)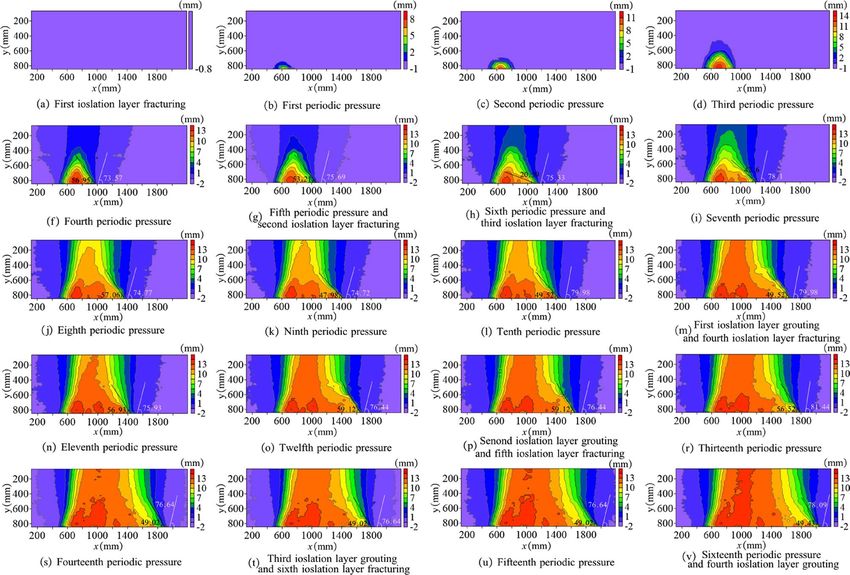
www.nature.com/scientificreports/

                                 Figure 2.  Production, maintenance and testing methods of materials.

                                 large differences in water-bearing properties. Therefore, the mining of 2 coal samples will inevitably lead to
                                 changes in the initial groundwater flow field in the mine area, resulting in a hydraulic connection between the
                                 upper and lower sections of the Naoro Formation sandstone aquifer. This in turn leads to changes in hydro-
                                 geological conditions in the lower section of the aquifer. Through the calculation of the height of the No. 2
                                 coal caving zone and fracture zone, it reached the sandstone aquifer group at the bottom of the Naoro Forma-
                                 tion. Groundwater will then enter the coal strata along the fracture zone, resulting in the loss of shallow water
                                 resources. A survey found that the water surge amount in Ningdong’s coal mines was greater than 50 m3/h, and
                                 the pit fill source was dominated by roof aquifers and the accumulation of water ponded in the mining area.
                                 Therefore, according to the hydrogeology of Maiduoshan, the position of the flexible isolation layer is selected
                                 in the coarse-grained sandstone layer at the bottom of the Zhiluo Formation.

                                 Materials and methods
                                 Novel simulation materials. In response to the shortcomings of conventional similar materials, such as
                                 long drying time and nonreproducibility, a new block of similar material with a concave groove structure on
                                 three sides was developed. The block use the material as the module and cementing material as the intermodule
                                 binder. The production process of block material: mixing by cement, sand and latex or polymer in different pro-
                                 portions. The mixture was put into a supporting mould with built-in steel bars, and the top of the mixture after
                                 loading was smoothed. After a certain period of maintenance, the mould was removed, and the block was put
                                 into the maintenance box for 28 days. Because the blocks are not bonded, in practice, a separate binder has to be
                                 prepared and filled in the grooves between the blocks. The binder is made of different proportions of white pow-
                                 der, gypsum, sand and admixtures mixed with water to simulate the mechanical similarity between the blocks.
                                     Uniaxial compression, direct shear and electron microscopy scanning experimental results of the two mate-
                                 rials in different ratios showed that when latex was added to the block material, cement reacted with the two-
                                 component latex waterproof material, which had high strength and was compactable. Adjusting the proportion of
                                 sand, the elastic model of the material changes accordingly and can be used as a reference to simulate sandstone.
                                 When the polymer was added to the block material, the elongation of the material increased as flexible chains of
                                 the polymer resisted external stresses. The material could also be selected to simulate mudstone strata. By varying
                                 the ratio, the cohesive strength and internal friction angle of the cementing material also showed the appropriate
                                 changes to simulate different lithologies, such as soft to hard rock layers in the strata. Mica powder was used to
                                 simulate the stratification between the various rock layers. In similar to true geological conditions, the mechani-
                                 cal property parameters, such as the elastic modulus of similar materials and the cohesion, internal friction
                                 angle and flexural strength of cementing materials, satisfy a similar theory. Based on the mechanical property
                                 parameters of the coal seam and overburden roof in the model, similar materials of different formulations and
                                 ratios were selected in conjunction with the mechanical property tests of similar material samples, including
                                 the material production, maintenance and testing methods are shown in Fig. 2. The mechanical parameters of
                                 similar materials are listed in Table 1.

                                 Material of flexible isolation layer.           A specific aquifer in the upper part of the coal seam is used as a
                                 flexible isolation layer, and the layer is hydraulically fractured before mining to form a specific thickness of the
                                 artificial fracture development zone. After full coal seam mining, the isolation layer is reformed by grouting to
                                 control the impact range of mining fractures and interrupt the downwards seepage of the aquifer. Therefore, the

Scientific Reports |   (2022) 12:875 |                https://doi.org/10.1038/s41598-022-04813-y                                                   3

                                                                                                                                              Vol.:(0123456789)
www.nature.com/scientificreports/

                        Native rock                             Similar material
                                                                                                     Block
                                                                                                     material   Cementing                                 Cementing
                        Elastic                     Strata                   Elastic     Strata      elastic    materials                                 materials ratio
           Rock         modulus        Cohesion     thickness   Cohesion     modulus     thickness   modulus    cohesion                                  (Sand:gypsum:white
           lithology    (GPa)          (MPa)        (m)         (MPa)        (MPa)       (mm)        (GPa)      (MPa)       Block material ratio          powder:water)
           Naoro Formation lower section
           Gritstone    45.7           3.96         12.7        24.76        285.7       95.6        284.3      25.99       Cement:latex:sand = 1:0.1:4   4:2:1.5:2
                                                                                                                            Cement: JS polymer com-
           Siltstone    44.4           1.94         10.6        12.14        277.4       79.6        278.1      12.88                                     1:2:1:1
                                                                                                                            pound = 1.2:1
           Gritstone    45.7           2.82         10.1        17.65        285.7       76.6        284.3      17.27       Cement: latex:sand = 1:0.1:4 2:2:1.5:1.5
           Yan’an Formation
           Medium
           grained      59.5           3.42         2.2         21.37        371.7       16.6        365.3      20.80       Cement:latex:sand = 1:0.5:2   2:2.5:1.5:1.5
           sandstone
           Siltstone    40.0           4.30         1.7         26.85        250.0       12.6        254.2      24.60       Cement:latex:sand = 1:0.2:3   4:2:1:1.5
                                                                                                                            Cement: JS polymer com-
           Mudstone     10.5           0.41         0.8         2.56         65.5        6           54.6       3.84                                      3:2:1:1
                                                                                                                            pound = 1.0:1
           Siltstone   42.2            2.40         0.4         15.00        263.8       3           254.2      14.50       Cement:latex:sand = 1:0.2:3   2:1.5:1.5:1.5
           No.2 Coal
                       3.3             0.84         0.2         5.24         20.8        1.5         17.9       6.90        Nail free adhesive            1:1:1:1
           seam

                                                  Table 1.  Simulation parameters for native rock and similar materials.

                                                  Figure 3.  Flexible isolation layer.

                                                  selection of the isolation layer material is particularly important in physical similarity simulation experiments to
                                                  meet the conditions of the similarity theory and to achieve the conditions for fracturing, seepage and grouting.
                                                  After a series of material selections and experiments, a high-strength rectangular transparent plastic was chosen
                                                  as a similar material for the isolation layer, as shown in Fig. 3. The elastic modulus of the material is 371.7 MPa,
                                                  and the size is 50 mm × 250 mm × 50 mm (length × height × depth). The unit was filled with 5–10 mm gravel and
                                                  iodized salt in a 3:1 ratio, with single inlet and double outlet valves on the top and bottom of the unit. After the
                                                  completion of the model, the unit body was washed with hot water before mining by using the characteristics of
                                                  iodized saltwater regularization. The cuboid is completely dissolved and the iodized salt released can simulate
                                                  the isolation layer after fracturing. After the isolation layer is fractured, the isolation layer water flows down the
                                                  monitoring line, simulating the aquifer water flowing down the rock fracture. The grouting reformation system
                                                  of the isolation layer comprises a large diameter unidirectional valve at the end of a similar material in the isola-
                                                  tion layer, grouting pipeline, slurry and manual grouting machine, as shown in Fig. 4. The inorganic waterproof
                                                  plugging material is selected as the grouting material, which is mixed according to the water cement ratio of 0.3:1
                                                  at room temperature, followed by using a manual grouting machine to construct the isolation layer. The slurry
                                                  can be completed within 3 min of the initial set and 6 min after the final set. After the slurry is solidified, the
                                                  water cannot flow along the monitoring line to simulate the sealing of the fissure after the isolation layer grouts
                                                  on site, thus achieving the water plugging effect of grouting from the isolation layer.

                                                  Platform construction
                                                  Similarity ratio. The similarity simulation experiment adopts the material with the strength to simulate the
                                                  actual rock stratum. The similarity between the simulated rock and actual rock stratum should be guaranteed in
                                                  terms of mechanical strength.

                                                  Geometric similarity ratio. Geometric similarity is a certain proportional relationship between the simulation
                                                  model and the actual rock mass prototype in space. Thus we use the geometric similarity ratio CL:

          Scientific Reports |        (2022) 12:875 |                   https://doi.org/10.1038/s41598-022-04813-y                                                             4

Vol:.(1234567890)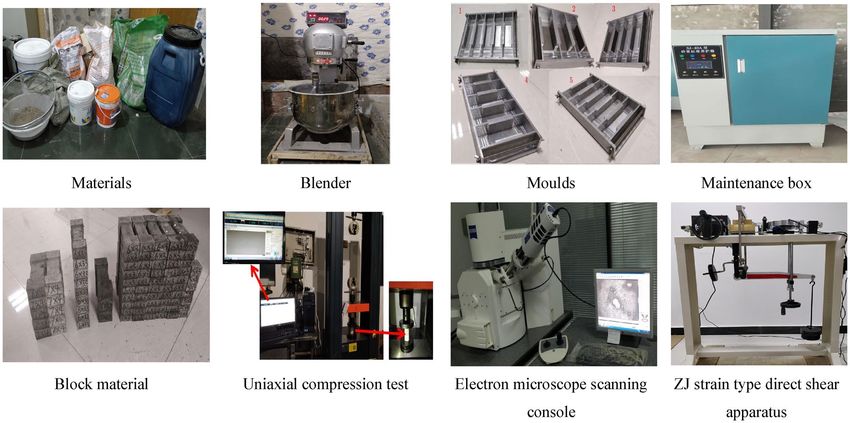
www.nature.com/scientificreports/

                                 Figure 4.  Isolation layer grouting reformation system.

                                                                                     LH   LH
                                                                              CL =      =    = 140                                               (1)
                                                                                     Lm   Lm
                                     Among them: CL—geometric similarity ratio; LH- Geometric size of prototype along the actual strike length
                                 of rock stratum, cm, cm; Lm—The geometric size of the model along the direction of the simulated rock strike
                                 length, cm; LH—Geometric size of prototype along the actual cumulative thickness direction of rock stratum,
                                 cm; Lm—Geometric size of the model along the vertical height direction of the simulated rock stratum, cm.

                                 Bulk density similarity ratio.
                                                                                         γH
                                                                                  Cγ =
                                                                                         γm
                                                                                            = 1.2                                                (2)

                                    Among them: Cγ—bulk density similarity ratio; γH—apparent density of original rock, g/cm3, γm—Apparent
                                 density of similar material, g/cm3.
                                    Similarity ratio of stress, strength, elastic modulus, head pressure and cohesion (CR)
                                    According to the basic principle of similarity theory, the similarity ratio of stress, strength, elastic modulus,
                                 head pressure and cohesion is as follows:
                                                                  RH   EH   PH   CH   γH
                                                          CR =       =    =    =    =    = CL × Cγ × CL = 168                                    (3)
                                                                  Rm   Em   Pm   Cm   γm
                                     Among them: RH, EH, PH, CH—uniaxial compressive strength, elastic modulus, head pressure and the cohesion
                                 of original rock, MPa; Rm, Em, Pm, Cm -Uniaxial compressive strength, elastic modulus, head pressure, cohesion
                                 of similar materials, MPa.

                                                                                                              µ       φ
                                 Similarity ratio of strain, Poisson ratio internal friction angle Cε = εεH = µH = φH = 1 .
                                                                                                          m    m    m

                                                                                      εH     µH     φH
                                                                               Cε =       =       =    =1                                        (4)
                                                                                      εm     µm     φm
                                     Among them: εH , µH , φH -Strain, Poisson ratio and internal friction angle of the original rock; εm , µm , φm
                                 -Strain, Poisson ’s ratio and internal friction angle of similar materials.

                                 Time similarity ratio (CT). In this similar simulation test, the stress, displacement of the overlying rock roof and
                                 the evolution process of rock fracture and collapse in the process of coal seam mining change with the advance-
                                 ment of the working face. A similar simulation process should be similar to the actual mining conditions in the
                                 field and meet the similarity ratio in time.
                                                                                     TH  √
                                                                             CT =       = CL = 11.8                                              (5)
                                                                                     Tm
                                     Among them: TH—the time required for coal seam mining in actual situations, d; εm , µm , φm—time required
                                 for mining of the working face in the related model, d.
                                     The daily advance of the Maiduoshan No. 2 coal seam is 16.8 m, which is equivalent to a 15 mm advance in
                                 15 min according to the time similarity ratio, so each block can be made into 15 mm blocks.

                                 Similar simulation experimental platform construction. Combined with the hydrogeological con-
                                 ditions of the Maidushan Coal Mine and the relevant requirements of the test, the No. 2502 drilling hole was
                                 selected with a surface elevation of 1401.39 m. The No. 2 seam has an average thickness of 3.2 m, a burial depth
                                 of 491.2 m and a strike length of 250 m. The altitude of the gritstone aquifer in the lower section of the Naoro
                                 Formation is 1304.11 m, with a distance of 403.92 m from the roof of the No. 2 coal seam and a bottom water
                                 pressure of 3.7 MPa. The model dimensions were conceived as 2500 (length) × 200 (width) × 1000 mm (height).

Scientific Reports |   (2022) 12:875 |                 https://doi.org/10.1038/s41598-022-04813-y                                                  5

                                                                                                                                              Vol.:(0123456789)
www.nature.com/scientificreports/

                                           Figure 5.  Drilling histogram.

                                           Figure 6.  Water pressure control system.

                                           Given the influence of the model boundary, 450 mm coal pillars were left on both sides of the model. The num-
                                           ber of excavation steps was 157 by imposing the surface force of the model to replace the overburden weight of
                                           the roof. The flexible isolation layer was divided into 31 units. To create the model, the stress sensors were first
                                           placed in the lowest layer, and the layers were laid in sequence. Seven aqueducts (i.e., monitoring line) were
                                           placed in the rock lays from left to right to test the water flow. To achieve the independent application of static
                                           load, steel bars were laid on the top of the model to help simulate the weight of the uppermost overburden layer
                                           to solve the phenomenon of uneven roof pressure caused by mining subsidence in the conventional model. By
                                           varying the weight and number of steel bars, the weight of different roof overburdens can be achieved. The bore-
                                           hole histogram is shown in Fig. 5.

                                           Water pressure control system. The water pressure control system consists of a water storage tank, a
                                           water temperature controller, a water level monitor and various shunt pipelines. In accordance with similar
                                           theoretical principles, the water storage tank is placed on a shelf at a certain height to simulate the water pressure
                                           of the aquifer, as shown in Fig. 6. The height of the storage tank on the shelf can be modified to provide different
                                           amounts of water pressure. The external water source is heated to 65° by the water temperature controller and
                                           then injected into the water tank. The water level monitor probe is positioned inside the water tank to monitor
                                           the water level inside the water tank in real time, thus ensuring stable water pressure. The distribution pipeline
                                           at the outlet of the water tank is attached to the single inlet and double outlet valve heads on the isolation layer
                                           through the fine rubber tube and then buried in the model with water pressure sensors and flow metres attached
                                           to the outside of the pipeline. During the mining process, the water flow inside the model is observed using an
                                           infrared thermal imager, and together with the detection data of sensors and flowmeters, the crack development
                                           and stress release degree of roof strata can be analysed.

                                           Date collection.      The experimental simulation used a high-precision scattering technique to monitor the
                                           physical simulation surface displacement with supporting full-field strain measurement and simulation optimi-
                                           zation analysis software to conduct real-time diagnosis of the displacement changes in the roof rock seam. The
                                           data acquisition system consists of stress sensors, water flow metres and collection terminals. There are 118 stress

          Scientific Reports |   (2022) 12:875 |                https://doi.org/10.1038/s41598-022-04813-y                                                     6

Vol:.(1234567890)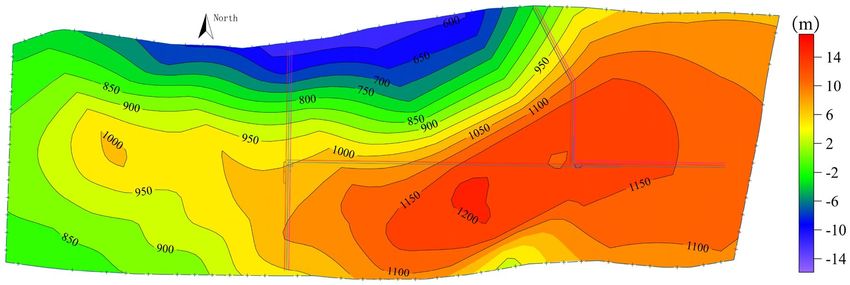
www.nature.com/scientificreports/

                                 Figure 7.  Experimental platform assembly diagram.

                                 sensors arranged below the coal seam to test the real-time change pattern of the roof rock surrounding stress and
                                 infer the periodic incoming pressure on the roof. According to the water flow monitoring in the seepage line by
                                 the collection terminal, the fracture development of the roof water-conducting fracture zone can be analysed.
                                 After the completion of the grouting transformation, the change in flow rate can also be evaluated by the grout-
                                 ing effect. Details of the experimental platform are shown in Fig. 7 and Fig. 8.

                                 Experimental procedures

                                 (1)     The adjusted stress sensor was laid at the bottom of the test bench, and the guard plates were clamped
                                         on both sides. The coal seam was laid above the sensor, and then the corresponding prefabricated block
                                         simulation material was placed above the coal seam in turn. Sprinkling mica powder between different
                                         lithology rock layers was used to simulate the layered joints between rock layers. During the process of
                                         model laying, seven pipelines used to simulate seepage were buried in the model until the isolation layer
                                         was laid out.
                                 (2)     After the completion of the model laying, the aquifer mining system, the isolated layer grouting reformation
                                         system, and the data collection system were connected. The baffle was then removed, and a layer of white
                                         powder was brushed onto the outside of the model. After that, the black spots were dotted on. The mining
                                         monitoring system was adjusted to check whether it could meet the requirements of real-time analysis.
                                 (3)     After all the adjustments were completed, the first section of the isolated layer was first fractured, i.e., the hot
                                         water of the water tank was introduced into the flexible compartment, and then the coal seam was mined.
                                         When the roof strata were completely stable after each mining step, the model was photographed using an
                                         industrial camera and an infrared thermal camera and analysed by combining the collected terminal data
                                         and corresponding software to determine the changes in the displacement, stress and seepage field of the
                                         overlying strata.
                                 (4)     When the impact range of roof deformation approaches the fracturing boundary of the first isolation
                                         layer (i.e., the corner of the bedrock impact boundary extends to the fracture range of the flexible isolation
                                         layer), mining is stopped, and the second section isolation layer is fractured. When the roof strata within
                                         the scope of the first isolation layer is reach full exploitation, the first isolation layer should be transformed
                                         by grouting the first isolation layer, mining should continue, and the above steps should be repeated until
                                         mining reaches the stop line.

                                 Results and discussions
                                 Analysis of the roof failure characteristics of coal seam. Before mining, fracturing was conducted
                                 on a portion of gritstone in the lower section of the Naoro Formation and then entered the mining stage. Fig-
                                 ure 9 shows the influence law of coal roof rupture under different periodic pressures. With mining of the #2 coal
                                 seam working face, the direct roof of the coal seam partially broke and collapsed, forming gangue in the goaf.
                                 There is a clear separation between the direct and basic roof. When the working face advanced to 228.2 mm, the

Scientific Reports |   (2022) 12:875 |                   https://doi.org/10.1038/s41598-022-04813-y                                                        7

                                                                                                                                                      Vol.:(0123456789)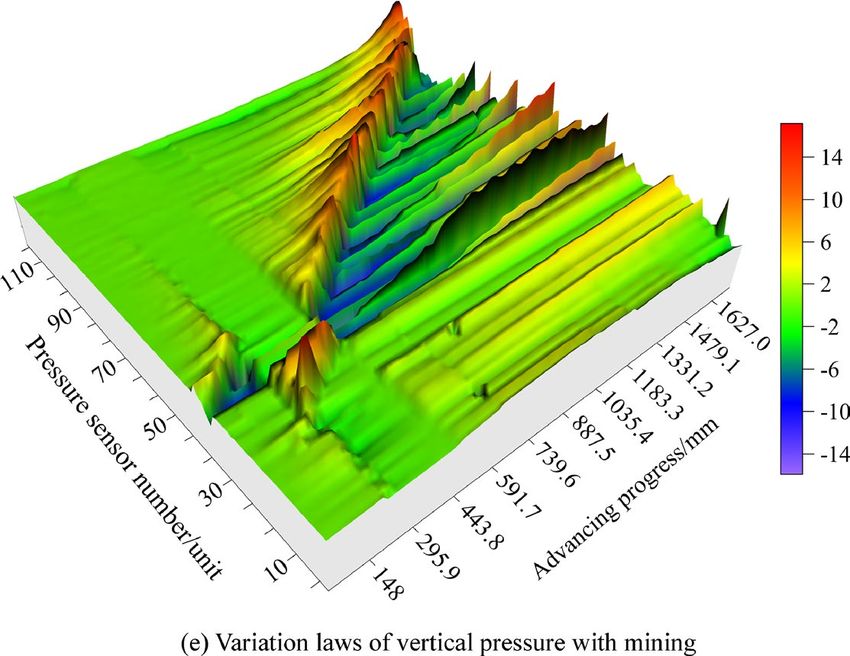
www.nature.com/scientificreports/

                                           Figure 8.  Physical diagram of the experimental platform.

                                           old roof ruptured, and the working face started to enter the periodic pressure-bearing stage. As the working face
                                           advanced to 592.9 mm, the roof exhibited the fourth periodic pressure. The overlying layer roof in the excavation
                                           area was affected by the upper bearing arch pressure, leading to the collapsed rock to not completely contact the
                                           upper roof. With the increasing distance of coal seam mining, the roof developed significant subsidence, and the
                                           influence range of the bedrock boundary caused by the mining was still in the isolation layer fracturing zone.
                                           The bedrock influence boundary angle reached 73.57°, and the rock fracture angle was 56.95°. When the work-
                                           ing face advanced to 726.5 mm, the fifth periodic pressure on the roof occurred. The bedrock layer in the upper
                                           right of the workings was near the right boundary of the first isolated coal seam rupture. Then, coal mining was
                                           suspended, and a second isolated seam fracturing process was conducted. The bedrock influence boundary angle
                                           reached 73.57°, and the rock rupture angle was 56.95°.
                                               When the processing was advanced to 798.4 mm, the bedrock layer in the upper right of the processed area
                                           became close to the right boundary of the second isolated seam fracturing. After the third isolated layer fractur-
                                           ing process, the rock impact boundary angle reached 75.33°, and the rock fracture angle was 50.39°. Proceeding
                                           to 1031.6 mm, eighth periodic pressure was generated on the roof. The falling gangue in the mined-out area
                                           was in contact with the roof, with the bedrock impact boundary angle reaching 74.77° and the rock fracture
                                           angle reaching 57.06°. Thereafter, the bedrock layer of the roof gradually entered the full-scale mining stage. As
                                           the working face continues to advance, the bedrock impact boundary caused by coal seam mining should be in
                                           isolated coal seam fractures. When the bedrock layer at the working face is close to the right boundary of the
                                           isolation layer fracturing, the next isolation layer fracturing should be performed.

                                           Analysis of roof stress evolution law. Figure 10 illustrates the change law of the roof support pressure
                                           when mining of the working face, in which the roof support pressure curve is the stress change minus the initial
                                           value of the sensor before mining. After the excavation of the working face, the surrounding rock will exhibit
                                           stress redistribution. The increase in tangential stress in front of the working face or on both sides is called the
                                           support pressure. The peak value of the support pressure generally occurs on the front of the working face. As
                                           the working face advanced to 228.2 mm, the direct roof gradually broke and collapsed with mining. Due to the
                                           redistribution of surrounding rock stress, the stress fluctuation at the open cut was clear. In front of the working
                                           face, the overlying rock stress was redistributed due to mining, and the vertical pressure peak area appeared,
                                           with a stress increment of 0.03 MPa. When the working face advanced to 360.8 mm, the first cycle pressure on
                                           the roof occurred. The falling gangue in the mine-out area gradually approached its upper strata, and the peak
                                           support pressure increments reached 0.05 MPa. During the advancement of the working face to 592.9 mm, the
                                           direct roof continued to collapse. The gangue at the cuttings was gradually compacted with the roof, and the
                                           stresses gradually restored to stability. Coal seam mining led to the decompression of the floor, and the vertical

          Scientific Reports |   (2022) 12:875 |                https://doi.org/10.1038/s41598-022-04813-y                                                   8

Vol:.(1234567890)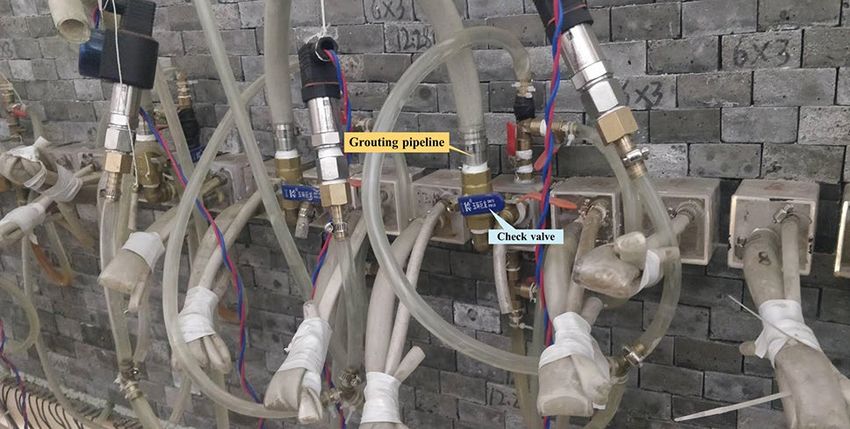
www.nature.com/scientificreports/

                                 Figure 9.  Influence law of coal roof rupture during different periodic pressure.

                                 stress maximum reduction at the working face was 0.045 MPa. The peak vertical pressure in front of the working
                                 face shifted to the right as mining progressed. When degradation reached 726.5 mm, the fifth periodic pressure
                                 on the roof occurred. Figure 10b shows that the fracture of the isolation layer had no apparent effect on the
                                 change in roof stress. Within 560 mm from the open excavation, the mine-out area gangue gradually compacted
                                 with the roof. Vertical pressure changes between the fourth and fifth periodic pressures are slight and practically
                                 nonsignificant.
                                     When the mining reached 1031.6 mm, the directly caving gangue completely filled the goaf and was com-
                                 pacted with the roof. The upper roof of the caving rock was supported again, and the compaction range of
                                 the mining area extended to 821 mm. As the working face advanced to 1338.9 mm, the peak vertical pressure
                                 appeared at 1400 mm, with a maximum increment of 0.375 MPa. The compaction range of the mining area
                                 extends to 1200 mm. Then, the fractured isolation layer can be grouted. The subsequent working face advances
                                 until the end of mining, and the rock movement above the mine-out zone will exhibit a periodic "falling-filling-
                                 cutting-compaction" process. Fracture grouting of the flexible isolation layer has no significant effect on the
                                 vertical stress changes, and the stress unloading area and the peak vertical pressure will continue to change with
                                 mining. Nevertheless, consideration needs to be given to the adequacy of the gangue falling from the roof for
                                 isolation layer grouting.

                                 Roof displacement and development pattern of water‑conducting fracture zone. Figure 11
                                 shows the development law of the roof water-conducting fissures in the roof of the coal seam during different
                                 pressure periods, where the illustration shows the von Mises equivalent strain. Figure 12 shows the development
                                 trend of the water-conducting fracture zone height. From the whole observation, although the isolation layer
                                 is treated by fracturing before back mining, it has less influence on the displacement and deformation of the
                                 overlying rock layer because it is restricted by the surrounding rock of the model. When the working face was
                                 mined to 228.2 mm, the upper roof of the mining face collapsed, and the first periodic pressure occurred on
                                 the roof. The roof displacement reached the Yan’an Group mudstone layer, and the roof collapse height was only
                                 104.3 mm. As the mining advanced, the roof fractures in the mining-out area continued to develop upwards.
                                 When the working face was mined to 360.8 mm, the first cycle pressure on the roof occurred, and the roof col-
                                 lapse height extended upwards to the siltstone of the Yan’an Formation, with a collapse range of 117.6 mm. At
                                 this point, only a small displacement change occurred around the direct roof, and the flexible isolation layer was
                                 basically not affected by any impact.
                                     From the second cycle pressure onwards, the development trend accelerated significantly, and the collapsed
                                 height rose rapidly to 210.9 mm. When the working face advanced to 537.1 mm, the third cycle pressure occurred

Scientific Reports |   (2022) 12:875 |                https://doi.org/10.1038/s41598-022-04813-y                                                  9

                                                                                                                                             Vol.:(0123456789)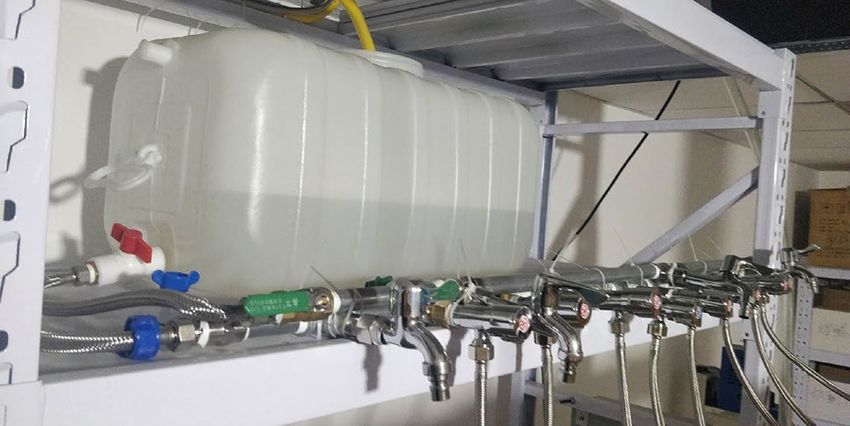
www.nature.com/scientificreports/
16.5 First pressure Fourth periodic pressure
15
First periodic pressure Fifth periodic pressure
Periodic pressure difference Periodic pressure difference
10
11.0
Vertical pressure/MPa
Vertical pressure/MPa
5
5.5
0
20 40 60 80 100
0.0 -5
20 40 60 80 100
-10
-5.5
-15
-11.0 -20
Pressure sensor number/Unit Pressure sensor number/Unit
(a) (b)
Eighth periodic pressure Eleventh periodic pressure
20 24
Ninth periodic pressure Twelfth periodic pressure
Periodic pressure difference Periodic pressure difference
15
16
Vertical pressure/MPa
Vertical pressure/MPa
10
8
5
0
0 20 40 60 80 100
20 40 60 80 100
-8
-5
-10 -16
-15 -24
Pressure sensor number/Unit Pressure sensor number/Unit
(c) (d)
(e)
Figure 10. Vertical pressure variation law with coal mining. (a) First pressure and First periodic pressure
difference. (b) Fourth and First periodic pressure difference. (c) Eighth and Ninth periodic pressure difference.
(d) Eleventh and Twelfth periodic pressure difference. (e) Variation laws of vertical pressure with mining.
Scientific Reports | (2022) 12:875 | https://doi.org/10.1038/s41598-022-04813-y 10
Vol:.(1234567890)www.nature.com/scientificreports/
Figure 11. Development regularity of roof water-conducting fissures during different period pressure.
700
Water-conducting fracture zone Height/mm
Water-conducting fracture zone Height
600
500
400
300
200
100
0 2 4 6 8 10 12 14 16
Periodic pressure/times
Figure 12. Development height curve of water-conducting fracture zone.
on the roof. The collapsed Yan’an Formation mudstone layer was further pressurized by its upper layers and
collapsed to a height of 344.7 mm. The roof displacement had spread to the coarse sandstone of the Naoro
Formation, but the height of the water-conducting fracture zone had not reached the bottom of the isolation
layer. When the workings reached 592.9 mm, the roof collapsed again, showing the fourth periodic pressure.
The water-conducting fissure zone continues to develop upwards to 355.3 mm, which passes through the fissure
isolation layer and reaches the gritstone at the top of the isolation layer. The fractured isolation layer is in an
"activated" state.
When the working face reached 1031.6 mm, fallen gangue completely filled the mining-out area and com-
pacted with the roof, and eighth periodic pressure occurred on the roof. The height of the water-conducting
fracture zone developed to 496.8 mm, which was lower than the height of the water-conducting fracture zone
Scientific Reports | (2022) 12:875 | https://doi.org/10.1038/s41598-022-04813-y 11
Vol.:(0123456789)www.nature.com/scientificreports/
Mining step Mining advancement (mm) Periodic pressure Isolated layer fracturing Isolation layer grouting
0 Groups 1 to 19
47 228.2 initial weighting
56 360.8 1
61 432.7 2
68 537.1 3
72 592.9 4
81 726.5 5 Groups 20 to 21
86 798.4 6 Groups 22 to 25
92 886.7 7
102 1031.6 8
106 1090.4 9
112 1178.7 10 Groups 26 to 27 Groups 1 to 13
123 1338.9 11
132 1471.9 12 Groups 28 to 29 Groups 14 to 15
136 1528.6 13
143 1645.2 14 Groups 29 to 31 Groups 16 to 17
147 1686.6 15
153 1774.9 16 Groups 18 to 20
Table 2. Development pattern of water-conducting fracture zone and fracture and grouting sequence of
isolated layer.
of 565.8 mm at the seventh periodic pressure. After that, the old roof collapsed as a cantilevered beam. The
development height of the water-conducting fracture zone was allegedly less than 565.8 mm. Afterwards, the
roof fracturing direction was consistent with the direction of working face advancement, from left to right.
Displacement and fracture of the overlying rock layer were mainly caused by the overall downwards sliding of
the upper rock seam due to the collapse of the bottom rock seam. At different heights of the coal seam roof, the
degree of displacement damage decreased with increasing height.
When the working face reached 1178.7 mm, the roof covering the open cut stabilized. The fractured isolation
layers in the 1st ~ 13th groups were grouted, and then the coal was mined only after the slurry had completely
solidified and reached a certain strength. The eleventh periodic pressure occurred on the roof, with a water-
conducting fracture height of 367.6 mm at this time. When the working face was advanced to 1471.9 mm and
1645.2 mm, the roof had twelfth and fourteenth periodic pressures, and the heights of the water-conducting
fracture zone were 332.0 mm and 416.0 mm, respectively. Then, the 14th ~ 15th and 16th ~ 17th group isolation
layers of the upper coal seam were grouted while fracturing the right isolation layer. However, the disruption of
displacement towards the extent of the development had a relatively small impact, mainly on the roof rock layer
above the mining face. Table 2 indicates the development height of the water-conducting fracture zone and the
fracture and grouting sequence of the isolated layer.
During the mining process, damage to the water-conducting fissure zone was always a major factor in the
displacement of the roof slab. Nonetheless, after fracturing and grouting measures, the effects of the damage
were significantly reduced such that the damage to the roof rock was contained within the flexible isolation
layer. After grouting, the enhanced strength of the isolation layer ensured that mining was carried out normally.
During the mining period, four grouting reforms were made, and the isolation layer was fractured six times,
with the maximum development height of the water-conducting fracture zone located at the seventh periodic
pressure, reaching 565.8 mm.
Analysis of water flow evolution law of overburden roof. To analyse the seepage law of the over-
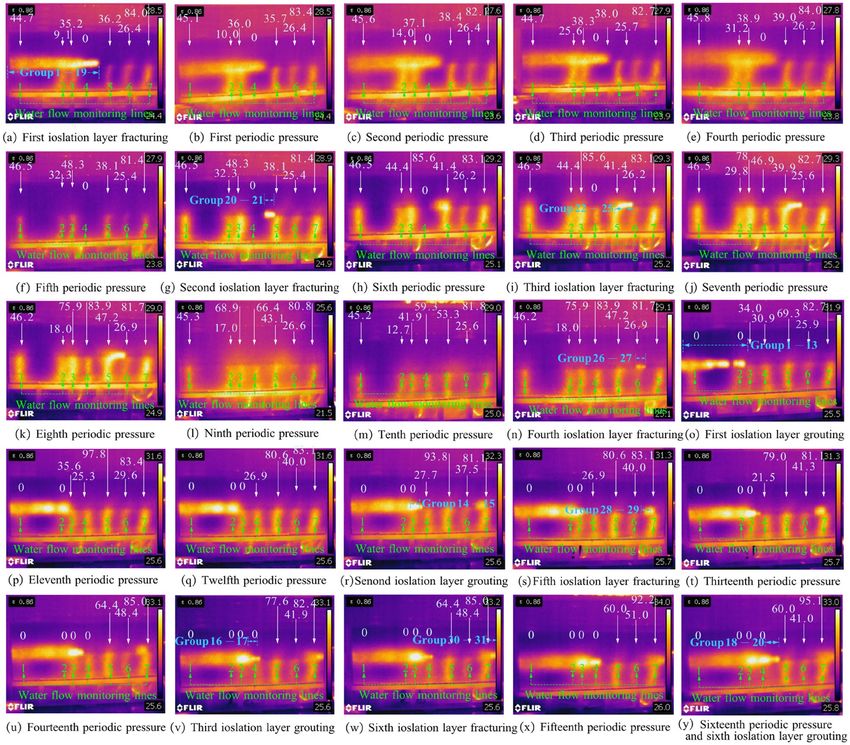
burden roof, seven water flow monitoring lines were arranged from the top of the flexible isolation layer to the
direct roof of the coal seam. The No. 1 water flow monitoring line was placed in the position of the third group of
the isolation layer, which is initially located outside the deformation range of bedrock disturbed by mining and
outside the stop line. The flow line was mainly used to monitor the influence of the rock disturbance boundary
above the open cut on isolated seam fracturing and grouting. No 2–3 water flow monitoring lines were placed at
the isolation layer positions of Group 12 and Group 14, which were initially located near the maximum height of
the water-conducting fracture zone and were mainly used to monitor the change laws of the water-conducting
fracture zone with mining impact. Monitoring Lines 4–6 were placed in isolation layers No. 17, No. 22 and No.
26 to study the impact of water flow changes with mining disturbance and the advanced influence scope. Water
flow monitoring line No. 7 was placed in the thirtieth group of isolated layers, which was originally outside the
cut-off line. As shown in Fig. 13, white arrows are water flow vectors in mL/min. Fracturing the 1–18 isolation
layers before mining, the water tank hot water was injected into the flexible isolation layer such that the iodized
salt in the flexible isolation layer was completely dissolved, and the infrared monitor showed the yellow area in
the image. At this point, the water flow monitoring Lines 1–3 and 5–7 show yellow status, indicating that after
the fracturing of the isolation layer, the aquifer water flows downwards along the fracture. The lower part of
Scientific Reports | (2022) 12:875 | https://doi.org/10.1038/s41598-022-04813-y 12
Vol:.(1234567890)www.nature.com/scientificreports/
Figure 13. Water flow evolution of the overburden roof with coal mining.
monitoring Line 4 was compacted at the top of the coal seam, indicating that the cracks between the roof and
the aquifer had not been communicated. Therefore, the water flow rate was 0 mL/min until the sixth periodic
pressure. Mining was then undertaken on the working face. The No. 1 monitoring line was therefore less affected
by mining due to its layout outside the stop line, and there was no significant change in water flow before the
first grouting.
As shown in Fig. 13, when the working face progressed to second periodic pressure, with the collapse of the
coal seam, the stress of the surrounding rock was redistributed, the height of the water flowing fractured zone
of the roof increased, and the water flow of the No. 2 monitoring line increased from the initial 9.1 mL/min to
14.0 mL/min. As the working face was advanced above the No. 2 monitoring line, the fifth periodic of pressure
were generated in the roof. The development height of the roof water flowing fractured zone reached 504.4 mm.
The roof was separated and collapsed, the cracks in the monitoring line communicated with each other, and the
rock stress was released. The water flow in the No. 2 monitoring line increased significantly. Monitoring line No.
3 was affected by advanced mining, resulting in the coal seam roof ’s increased rock fissures, the water flow path
and resistance were reduced, and the water flow reached 48.3 mL/min. At the same time, the influence range of
working face bedrock was close to the boundary of the first fracturing of the flexible isolation layer, and Groups
20–22 of isolation lays had been fractured.
When mining started at the sixth periodic pressure, the roof water-conducting fracture zone gradually reached
the maximum height and penetrated the fractured isolation layer, and the fracture of the roof rock increased.
Lines No. 2 and No. 3 reached 44.4 mL/min and 85.6 mL/min, respectively. In fact, the encounter may indicate
that the confined water of the gritstone aquifer was released, and the water flow of the working face increased.
Then, the working face progressed, and the collapsed gangue above the mining-out area was compacted into
the bedrock roof. The stress in the goaf did not change significantly, and the cracks in the strata decreased. The
Scientific Reports | (2022) 12:875 | https://doi.org/10.1038/s41598-022-04813-y 13
Vol.:(0123456789)www.nature.com/scientificreports/
No. 2 and No. 3 water flows of the monitoring line gradually dropped. During this period, the change law of
monitoring Lines 4–7 was similar to that of No. 2 and No. 3. During coal seam mining, the roof underwent a
process of fracture, collapse, compaction and full mining, and the water flow monitoring line also went through
a process of rising and then falling.
When the working face was advanced to the eleventh periodic pressure, the grouting transformation of isola-
tion layers 1–12 was conducted. The slurry was injected into the flexible isolation layer by hand pressure pump
along the grouting pipe. After the slurry solidified, the colour of the No. 1 and No. 2 monitoring lines gradually
became shallow, and the water flow gradually decreased under infrared observation. As the extraction of the
coal seam progressed and the flexible insulation layer was broken and grouted, the colour of observation Lines
1–4 turned black in the infrared observation until the fourth grouting of insulation layer 18–19, and the water
flow rate all showed 0 mL/min. However, the lower strata of the flexible isolation layer were not yet stabilized, so
monitoring Lines 5–7 did not undergo any grouting transformation and still had a large water flow until the end
of mining. Flow metre and infrared observations show that the destruction and grouting of the flexible isolation
layer had a noticeable effect on the seepage characteristics of the overburden. In particular, after the grouting of
the isolation layer, the slurry filled and solidified rapidly, the water flow decreased rapidly, and the water plugging
effect of flexible isolation layer grouting was remarkable.
Discussion and analysis. During coal seam mining, the fracturing of the flexible isolation layer should
be based on the premining overtopping influence range; that is, when the boundary line of bedrock influence
extends to the range of the flexible isolation layer reached by the fracturing area of the flexible isolation layer, the
next fracturing should continue. The average boundary angle range of the bedrock was 76.7°, and the field angle
should not be less than 73.57°. The grouting of the flexible isolation layer considers the full mining degree of
the coal seam. When there is no significant change in stress in the mined area, grouting of the flexible isolation
layer at the top of the goaf is conducted. According to the simulation experiment in this paper, the full mining
distance of the working face is 1338.9 mm, and the actual distance on site is 187.446 m. It is calculated that the
distance between the fracture of the flexible isolation layer should be no less than 854.8 mm away from the
working face, and the actual distance on site is 119.672 m. After the working face enters full mining, the shortest
distance between the fracturing grouting range of the flexible isolation layer and the working face is not less than
242.6 mm, and the actual distance on site is 33.964 m.
As seen from the previous analysis, with the advancement of the working face, the bedrock influence bound-
ary angle of the coal seam does not change significantly, which only plays a guiding role in the fracturing sequence
of the flexible isolation layer. The fracturing of the flexible isolation layer had an clear influence on the seepage
of water-rich bedrock at the bottom of the Zhiluo Formation. The water-flowing fractured zone formed in the
process of coal seam mining promoted the release of fractured water in the water-rich bedrock at the bottom of
the Zhiluo Formation. The higher the height of the water-flowing fractured zone is, the greater the seepage of the
water-rich bedrock. Coal seam mining had little effect on the seepage characteristics of the water-rich bedrock
layer at the bottom of the Zhiluo Formation in the range of not disturbed by mining and advanced influence.
In accordance with the stress sensor data, when the working face passed a certain distance, the bottom plate
of the extraction area was compacted by the falling gangue, and the sensor pressure data did not change with
the mining face. At this time, the grouting of the fracturing area of the flexible isolation layer corresponding to
the above goaf was not affected by the mining face. For example, the stress in the goaf of 1200 mm had no clear
change. Therefore, the first grouting was conducted in the fracturing area. After the solidification of the grouting
slurry, the water flow of monitoring lines No. 1 and No. 2 decreased significantly. This minimized the impact on
the original geological environment and at the same time reduced the goaf water drainage of the working face.
The sealing effect of the isolation layer has an important influence on promoting water-retaining coal mining.
The experimental application of the flexible isolation layer has realized its feasibility from the physical simu-
lation test method in this paper. The realization of a flexible isolation layer requires premining fracturing and
postmining isolation grouting. At present, premining fracturing can be achieved by directional drilling tech-
nology. There are also examples of roof separation grouting for postmining flexible isolation layer grouting28,29.
Therefore, there is no technical bottleneck in field applications. Moreover, there is still a certain distance from the
specific engineering application. According to the results of this study, it is predicted that the implementation of
a flexible isolation layer will have great significance for water conservation coal mining in western China, which
can reduce soil erosion and protect surface ecology.
Conclusions
In this paper, an investigation on the mechanism of the multiphase and multifield coupling mechanism of deep
mining in the western mining area was conducted. The whole process of the "flexible isolation layer" from frac-
turing to grouting transformation was realized through physical simulation, and the evolution law of the water-
conducting fracture zone, stress variations, periodic roof pressure and overburden deformation characteristics
were obtained for coal seam mining.
In terms of the challenges existing in conventional similar simulation materials, a new type of block similar
material and flexible isolation layer similar material were innovatively developed, which have a simple structure,
easy operation, cost and labour savings in the production process and can be widely used in similar simulation
experiments of coal seam mining, laying an experimental foundation for the simulation of fracturing and grout-
ing processes of flexible isolation layers in this paper.
In the experimental simulation, a total of four grouting transformations and six isolation layer fracturing
cycles were conducted. The maximum height of the water-flowing fractured zone was 565.8 mm. The average
bedrock influence boundary angle was 76.7°, and the average rock fracture angle in the goaf was 50.36°. The
Scientific Reports | (2022) 12:875 | https://doi.org/10.1038/s41598-022-04813-y 14
Vol:.(1234567890)www.nature.com/scientificreports/
flexible isolated layer fracturing area should exceed the bedrock roof disturbance boundary, and the top collapsed
rock layer in the mining void area must wait until its top collapsed rock layer is fully and adequately compacted
before the isolated layer grouting transformation process can be carried out.
This physical simulation experiment successfully conducted the fracturing and grouting technology of a flex-
ible isolation layer, verifying the feasibility of the technology of a flexible isolation layer forming a water isolation
layer from fracturing to grouting reconstruction. Coal seam excavation had almost no effect on the seepage
characteristics of overlying strata in the range of undisturbed mining and advanced influence. The increase in
the water-flowing fractured zone and roof caving height caused by coal seam mining had an clear influence on
the seepage characteristics of the roof, and the fracturing grouting of the flexible isolation layer had a significant
influence on the seepage characteristics of the roof.
Received: 13 July 2021; Accepted: 28 December 2021
References
1. Sun, W. et al. Development status and prospects of mine physical similar material simulation experiments. Geotech. Geol. Eng.
37(4), 3025–3036 (2019).
2. Yin, H. Numerical simulation of water flow from the coal seam floor in a deep longwall mine in China. Mine Water Environ. 35,
243–252 (2016).
3. Qiao, W. et al. Effects of coal mining on shallow water resources in semiarid regions: A case study in the Shennan mining area,
Shaanxi, China. Mine Water Environ 36, 104–113 (2017).
4. Zhao, C. et al. Numerical simulation of the groundwater system for mining shallow buried coal seams in the ecologically fragile
areas of Western China. Mine Water Environ. 38, 158–165 (2019).
5. Liu, S. et al. Fuzzy comprehensive risk evaluation of roof water inrush based on catastrophe theory in the Jurassic coalfield of
northwest China. J. Intell. Fuzzy Syst. 37(2), 2101–2111 (2019).
6. Liu, S. et al. Zoning and management of phreatic water resource conservation impacted by underground coal mining: A case study
in arid and semiarid areas. J. Clean. Prod. 224, 677–685 (2019).
7. Wang, J. Effects of soil and topographic factors on vegetation restoration in opencast coal mine dumps located in a loess area. Sci.
Rep. 6, 22058 (2016).
8. Xiaodan, L. et al. Design strategy of water circulation system above and below ground in western mining area. Earth Environ. Sci.
358, 032025 (2019).
9. Sun, Q. et al. Analysis and prevention of geo-environmental hazards with high-intensive coal mining: A case study in China’s
western eco-environment frangible area. Energies 10(6), 786 (2017).
10. Yao, Q. et al. Discussion on coal and water co-mining in ecologically fragile mining areas in western China. Coal Sci. Technol.
2020, 20200215 (2020).
11. Sun, Y. et al. Research progress of water environment, treatment and utilization in coal mining areas of China. J. China Coal Soc.
45(08), 304–316 (2020).
12. Yang, Z. et al. Classification of the type of eco-geological environment of a coal mine district: A case study of an ecologically fragile
region in Western China. J. Clean. Prod. 174, 1513–1526 (2018).
13. Chi, M. et al. Simulation analysis of water resource damage feature and development degree of mining-induced fracture at ecologi-
cally fragile mining area. Environ. Earth Sci. 78, 88 (2019).
14. Islam, M. et al. ABM Finite element modeling of stress distributions and problems for multi-slice longwall mining in Bangladesh,
with special reference to the Barapukuria coal mine. Int. J. Coal Geol. 78, 91–109 (2009).
15. Newman, C. et al. Assessment of potential impacts to surface and subsurface water bodies due to longwall mining. Int. J. Min. Sci.
Technol. 27, 57–64 (2017).
16. Scanlon, B. et al. Global synthesis of groundwater recharge in semiarid and arid regions. Hydrol. Process 20, 3335–3370 (2006).
17. Gu, D. Water resource and surface ecology protection technology of modern coal mining in China’s energy “Golden Triangle.”.
Strateg. Study CAE 15(04), 102–107 (2013).
18. Gu, D. Theory framework and technological system of coal mine underground reservoir. J. China Coal Soc. 40(02), 239–246 (2015).
19. Wang, S. et al. Study on coal mining for protecting ecological water level in the ecological fragile minging area. Metal Mine S1,
697–702 (2009).
20. Wang, S. et al. Study on overburden aquclude and water protection mining regionazation in the ecological fragile mining area. J.
China Coal Soc. 35(01), 7–14 (2010).
21. Fan, L. et al. Progress in engineering practice of water-preserved coal mining in western eco-environment frangible area. Coal
Geol. Explor. 40(28), 1711–1717 (2015).
22. Stachowski, P. et al. Water reservoirs as an element of shaping water resources of post-mining areas. J. Ecol. Eng. 19, 217–225 (2018).
23. Ma, L. et al. Water conservation when mining multiple, thick, closely-spaced coal seams: A case study of mining under Weishan
Lake. Mine Water Environ. 38, 643–657 (2019).
24. Meng, G. et al. Physical simulation experiment on prevention and control of water inrush disaster by backfilling mining under
aquifer. Environ. Earth Sci. 79(18), 429 (2020).
25. Wang, P. Physical simulation of mining effect caused by a fault tectonic. Arab. J. Geosci. 11, 741 (2018).
26. Xu, S. et al. Impacts of aquitard properties on an overlying unconsolidated aquifer in a mining area of the loess plateau: Case study
of the Changcun colliery, Shanxi. Mine Water Environ. 39, 121–134 (2020).
27. Zhang, S. et al. Physical simulation research on evolution laws of clay aquifuge stability during slice mining. Environ. Earth Sci.
77, 278 (2018).
28. Feng, Y. J. et al. Test on hard and stable roof control by means of directional hydraulic fracturing in coal mine. Chin. J. Rock Mech.
Eng. 31(6), 1148–1155 (2012).
29. Yang, J. et al. Application of long borehole directional drilling hydraulic fracturing technology in buertai coal mine of Shendong
coal group. Coal Geol. Explor. 2021, 1–8 (2021).
Acknowledgements
The authors are grateful for financial assistance provided by the Open Projects of Key Laboratory of Coal
Resources Exploration and Comprehensive Utilization, Ministry of Land and Resources (KF2020-5), the National
Natural Science Foundation of China (Nos. 41402265 and 51874229) and the Natural Science Foundation of
Shaanxi Province (2020JZ-52).
Scientific Reports | (2022) 12:875 | https://doi.org/10.1038/s41598-022-04813-y 15
Vol.:(0123456789)You can also read


