Pinellas County - Florida Department of Elder ...
←
→
Page content transcription
If your browser does not render page correctly, please read the page content below
2021 Profile of Older Floridians

Pinellas County
 This profile of older Floridians is a source of current information related to seniors in the county. Topics include the current
 and future population of older adults, the prevalence of older    adults who experience financial and housing issues, the array of
                                                             Column1
 health and medical resources, and information related toAge  disasters.
                                                                 Friendly As Florida's older adult population grows, awareness of
 these issues is needed to ensure that elders continue to be vital participants in their communities.

Elder Needs Index
Column1

    The Elder Needs Index (ENI) is a measure that includes: (1) the percentage of the 60 and older population that is age 85 and older; (2) the percentage of the 55 and
    older population that are members of racial or ethnic minority groups; (3) the percentage of the 65 and older population with one or more disability; and (4) the
    percentage of the 55 and older population living below 125 percent of the Federal Poverty Level. ENI is an averaged score indicating older adults who may need social
    services within a geographic area. It is not a percentage of the area’s population. Areas are color coded by their level of need, with light purple/blue areas representing
    areas with comparatively less need while the darker blue areas represent areas with high levels of need. The boundaries of Census Tracts correspond to the shape of
    each area on these maps. Interactive maps, viewing software, and a detailed user's guide are available at http://elderaffairs.state.fl.us/doea/eni_home.php

    The index cutpoints in the ENI is scaled at the PSA-level for the PSA and County Profiles Maps, and at the State-Level for the State of Florida map.
Source: Florida Department of Elder Affairs using U.S. Census Bureau, 2015-2019 American Community Survey 5-Year Estimates
Source: Florida Department of Elder Affairs using U.S. Census Bureau, 2015-2019 American Community Survey 5-Year Estimates
Column1
Useful Websites
Column1                                                                                                      Column1
   Bureau of Economic and Business Research (BEBR)                                                           Florida Division of Emergency Management (Shelters)
   U.S. Census Bureau, American Community Survey (ACS)                                                       Florida Housing Data Clearinghouse
   U.S. Census Bureau, Quick Facts                                                                           County Chronic Disease Profile
   Florida Agency for Health Care Administration (AHCA)                                                      Aging Integrated Database (AGID)
   Florida Department of Elder Affairs (DOEA)                                                                Florida DOEA ENI Maps
   How to Become an Age Friendly Community

Unless otherwise noted, the data presented in this Profile refer to populations in Florida age 60 and older.                                                                      1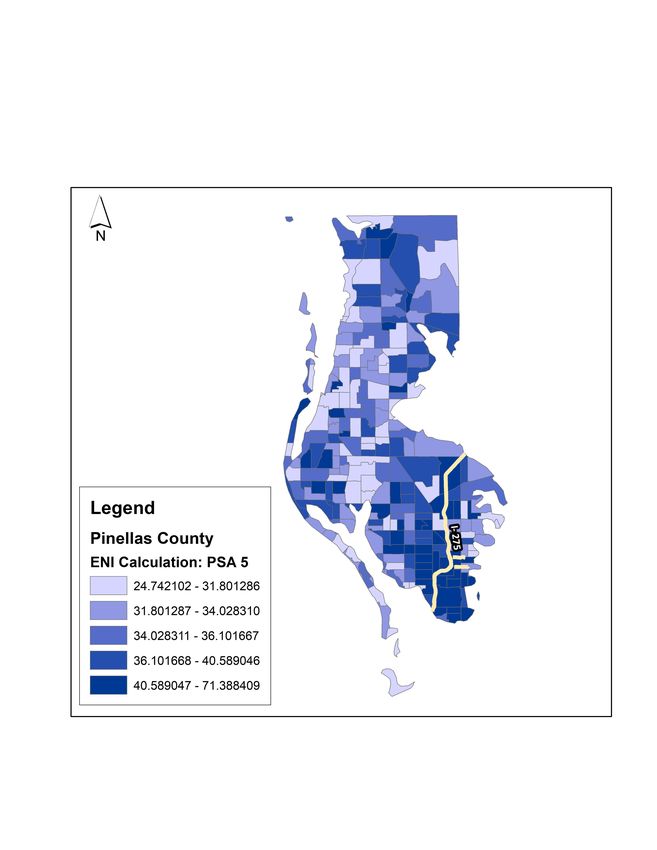
2021 Profile of Older Floridians

                           Column1

Pinellas County Demographic Profile
      The demographics section presents the population characteristics of those age 60 and older and examines traits
      about older Floridians, such as the number of veterans, voters, and drivers.

Age Category                                            Value     Percent           Race and Ethnicity                                                        Value Percent
All Ages                                              984,054       100%            White                                                                    307,522    92%
Under 18                                              165,132        17%            Black                                                                     20,371     6%
Under 60                                              648,612        66%            Other Minorities                                                           7,549     2%
18-59                                                 483,480        49%            Total Hispanic                                                            13,926     4%
60+                                                   335,442        34%               White Hispanic                                                         12,547     4%
65+                                                   253,304        26%               Non-White Hispanic                                                      1,379     0%
70+                                                   179,692        18%            Total Non-Hispanic                                                       321,516    96%
75+                                                   115,518        12%            Total Minority                                                            41,846    12%
80+                                                    68,341         7%            The minority population is the summation of black, other, and Hispanic
                                                                                    Source: BEBR, 2021
85+                                                    36,507          4%
Source: BEBR, 2021
                                                                                    Driver License Holders                                                     Value Percent
Gender                                                  Value     Percent           Drivers                                                                  147,771    33%
Male                                                  151,901        45%            Source: Florida Department of Highway Safety and Motor Vehicles, 2021

Female                                                183,541        55%
Source: BEBR, 2021                                                                  Registered Voters                                                          Value Percent
                                                                                    Registered Voters                                                        186,696    27%
Living Alone                                            Value     Percent           Source: Florida Department of State, 2018
Male Living Alone                                      29,610         9%
Female Living Alone                                    56,925        17%            Veterans                                                                   Value Percent
Source: AGID 2014-18 ACS                                                            Age 45-64                                                                 26,227    31%
                                                                                    Age 65-84                                                                 38,043    45%
Educational Attainment (65+)                            Value     Percent           Age 85+                                                                    8,385    10%
Less than High School                                  24,000         7%            Source: U.S. Department of Veterans Affairs, 2018

High School Diploma                                    74,105        21%
Some College, No Degree                                50,666        14%            Grandparents                                                               Value Percent
Associates Degree or Higher                            86,044        24%            Living With Grandchildren                                                  9,045     3%
Source: U.S. Census Bureau, 2015-2019 ACS                                                                                                                      2,895
                                                                                      Grandparent Responsible for Grandchildren                                          1%
                                                                                      Grandparent Not Responsible for Grandchildren                            6,150     2%
Marital Status                                          Male      Female            Not Living With Grandchildren                                            285,815    85%
Never Married                                          10,085       9,285           Grandchildren are defined as being under the age of 18.

  Percentage Never Married                                 7%          6%           Source: AGID 2014-18 ACS

Married                                                87,605      72,480
  Percentage Married                                     64%         44%            English Proficiency                                                       Value Percent
Widowed                                                13,740      50,030           With Limited English Proficiency                                          7,905     2%
  Percentage Widowed                                     10%         30%            Source: AGID 2014-18 ACS

Divorced                                               24,825      34,535
  Percentage Divorced                                    18%         21%
Source: AGID 2014-18 ACS

Note: The American Community Survey (ACS) requires a minimum of 50 cases in

a geographic area and therefore a value of 0 may denote fewer than 50 seniors in a region.

Unless otherwise noted, the data presented in this Profile refer to populations in Florida age 60 and older.                                                                   2
2021 Profile of Older Floridians
Column1
Pinellas County Demographic Profile
The population pyramid below compares the projected older adult population by gender between 2018 and
2030, demonstrating the changes expected in the next decade. As a whole, Florida is expected to experience
population growth, with some areas expecting notable growth in the proportion of those age 65 and older.
85+
80-84
75-79
70-74
65-69
60-64
55-59
50-54
45-49
2020 Female
Age
40-44
35-39
30-34 2020 Male
25-29
20-24
2030 Female
15-19
10-14
5-9 2030 Male
0-4
50,000 40,000 30,000 20,000 10,000 10,000 20,000 30,000 40,000 50,000
Population
Source: BEBR, 2021
Older Adult Dependency Ratio
The dependency ratio contrasts the number of working-age (15-64) individuals compared to the number of
individuals age 65 and older who are likely retired from the workforce. This ratio reflects the ongoing
contributions of taxes and wages to support the health care and retirement systems used by retirees, as well
as the availability of younger individuals to serve as caregivers to older loved ones.
1,000,000
900,000
800,000
5:10
2:10 6:10 6:10
700,000
600,000
500,000
400,000
300,000
200,000
100,000
0
2018 2020 2030 2040
Retired Age Population
358,152 253,304 324,967 343,918
(65+)
Working-Age
593,076 593,076 561,377 566,257
(15-64)
Source: BEBR, 2021 Working-Age (15-64) Retired Age (65+)
Unless otherwise noted, the data presented in this Profile refer to populations in Florida age 60 and older. 32021 Profile of Older Floridians
Column1
Pinellas County Financial Profile
This section examines financial conditions, poverty rates, and the cost of living for older Floridians.
The ratio of income to poverty level graphic below shows the distribution of older adults relative to
the poverty level to show the proportion of the senior population who fall below the Federal Poverty
Level (FPL). The portrayal of the financial conditions of older adults is detailed in the final graphic,
which includes information about income relative to rates of homeownership and partnership status
in the consideration of cost of living.
Federal Poverty Level Value Poverty Value Percent
Single-Person Household $12,140 At Poverty Level 264,995 79%
Two-Person Household $16,460 Below 125% of Poverty Level 31,159 9%
125% Single-Person Household $15,175 Minority At Poverty Level 30,515 9%
125% Two-Person Household $20,575 Minority Below 125% of Poverty Level 6,314 2%
Source: U.S. Department of Health & Human Services, 2021 Source: AGID 2014-18 ACS
Ratio of Income to Poverty Level
Column1 100% Federal Poverty Level 125% Federal Poverty Level
160,000
140,000
120,000
100,000
Population
80,000
54%
60,000
40,000
20,000
79% 11% 10% 9%
-70% 6%
0
Under 1.00 1.00 to 1.24 1.25 to 1.49 1.50 to 1.99 2.00 to 2.49 2.50 to 2.99 3.00 and over
Poverty Level
Value is expressed as the percentage of the 60+ population, with the dotted lines representing the Federal Poverty Level.
Source: AGID 2014-18 ACS
Financial Conditions
Median Income Cost of Living Based on Conditions
$60,000 $54,090
$50,000
$41,112
$40,000 $37,152
$32,472
$28,248 $27,924
$30,000
$23,568
$19,020
$20,000
$10,000
$0
Overall 65+ Single Owner Single Renter, Single Owner Couple Owner Couple Renter, Couple Owner
without One Bedroom with Mortgage without One Bedroom with Mortgage
Mortgage Mortgage
FPL Single-Person Household FPL Two-Person Household
Cost of living is an index of how much income retired older adults require to meet their basic needs to live in their community without assistance.
Source: U.S. Census Bureau, 2015-2019 ACS and Elder Index. (2020). The Elder Index™ [Public Dataset]. Boston, MA: Gerontology Institute, University of Massachusetts Boston. Retrieved from ElderIndex.org, 2016
Unless otherwise noted, the data presented in this Profile refer to populations in Florida age 60 and older. 42021 Profile of Older Floridians
Column1
Pinellas County Livability Profile
The livability section presents new elements, such as available affordable housing for older adults. Many essential
community elements are also included below, such as sidewalk safety, the safety of roadways, and availability of green
spaces. The rates of older Floridians who have access to a vehicle or public transportation, as well as the availability of
internet access and various food resources, are also provided. These provide estimates of older adults' ability to access
community resources.
Pedestrian Safety Percent Households With High Cost Burden (65+) Column1 Value
Sidewalks with Barriers 24% Owner-Occupied Households 69,824
Physical barriers are those that separate motorized vehicle lanes from Percent of Owners with High Cost Burden 12%
sidewalks or shared path (e.g. areas for parking lots, guardrail, trees, etc.). Renter-Occupied Households 33,664
Source: Florida Department of Transportation, 2021 Percent of Renters with High Cost Burden 27%
Households with a high cost burden have occupants age 65+ paying more than 30% of
Road Incidents Value income for housing costs and having an income below 50% of the area median income.
Total Involved in Fatal Car Crashes per 100,000 64 Source: The Shimberg Center for Housing Studies, 2020
This figure includes occupants and non-occupants involved in a crash.
Source: Florida Department of Highway Safety and Motor Vehicles, 2020 Affordable Housing Inventory Column1 Value
Properties 45
Internet Access (65+) Percent Properties Ready for Occupancy 44
Have Internet Access 86% Total Units 5,702
Source: U.S. Census Bureau, 2015-2019 ACS Units with Rent and/or Income Restrictions 5,264
Units Receiving Monthly Rental Assistance 2,529
Food Resource Centers Value Affordable housing inventory receives funding from HUD, Florida Housing Financing Corp.,
and the USDA. The inventory above includes older adults as its target population.
SNAP Access Sites 51
Fresh Access Bucks Outlet 3 Source: The Shimberg Center for Housing Studies, 2020
Farmer's Market 9
Food Distribution (No Cost) 32 Housing Units by Occupancy (65+) Column1 Percent
SNAP Retailers 774 Owner-Occupied Housing Units 43%
Congregate Meal Sites 19 Renter-Occupied Housing Units 21%
Food Distribution (No Cost) is the number of food pantries, soup kitchens, Source: U.S. Census Bureau, 2015-2019 ACS
and food banks in the area.
Source: Feeding Florida.org, USDA, FDACS, 2021, and Florida DOEA, 2019 Vehicle Access (65+) Column1 Percent
Owner-Occupied Households with Access to Vehicle(s) 93%
Public Transportation Options Value Renter-Occupied Households with Access to Vehicle(s) 67%
Bus Operations at least at the County 1 Source: U.S. Census Bureau, 2015-2019 ACS
Rail Operations at least at the County 0
Public Transit Service Area (sq. mi.) 304 Employment Status (65+) Value Percent
Public Transit Service Area Population 1,075,854 Number of Seniors Employed 69,640 19%
Annual Unlinked Trips 13,236,380 Number of Seniors Unemployed 3,465 1%
278 Source: U.S. Census Bureau, 2015-2019 ACS
Vehicles Operated in Maximum Service (VOMS)
Total Miles of Bike Lanes 361
Information on service area is not reported by rural and intercity public transit. Retirement (65+) Value Percent
VOMS are the number of vehicles operated to meet the annual max service, Social Security Beneficiaries 201,135 79%
and unlinked trips are the number of passengers boarding public transit. SSI Recipients 5,433 26%
Source: Federal Transit Administration, 2017, and FDOT, 2019 SSI stands for Supplemental Security Income. To qualify, a person must be at least age 65
OR be blind or disabled. Also, the person must have limited income and resources.
Green Space Value Source: U.S. Social Security Administration, 2019
Number of Nearby State Parks 4
Nearby refers to the park that has the shortest distance from the center SNAP or Food Stamps Value
of the county. Potentially Eligible 31,159
Source: Florida Department of Environmental Protection, 2021 Annual Participants 29,531
Current Beneficiaries as of Dec-20 24,468
Rural-Urban Designation Value Percent of Total Population Receiving Benefits 9%
Census Tracts Rural 0% Potentially Eligible are individuals below 125% of the Federal Poverty Level
Census Tracts Urban 100% Source: Florida Department of Children and Families, 2020
Number of Census Tracts 246
Source: U.S. Department of Agriculture, 2019
Unless otherwise noted, the data presented in this Profile refer to populations in Florida age 60 and older. 52021 Profile of Older Floridians
Column1
Pinellas County Health Profile and Medical Resources
The health and medical section presents the variety and availability of different types of facilities, medical
professionals, and treatment services in the community. This includes complex estimates based on probable usage by
older adults. For example, the "Medically Underserved" are areas designated by the U.S. Department of Health and
Human Services as having too few primary care providers, high infant mortality, high poverty, or a high elderly
population. Medical access and health support services information is an important area for community planners to
ensure that support is in place to accommodate an older population.
Ambulatory Surgical Centers Column1 Value Medically Underserved Value Percent
Facilities 30 Total Medically Underserved 118,395 35%
Operating Rooms 80 Living in Areas Defined as Having Medically 79,202 24%
Recovery Beds 242 Underserved Populations
Source: Florida AHCA, 2021 Living in Medically Underserved Areas 39,193 12%
Source: Calculated using U.S. Health Resources & Services Administration and AGID
Hospitals Column1 Value
Hospitals 16 Health Insurance 65+ Value Percent
Hospitals with Skilled Nursing Units 1 Insured 227,817 64%
Hospital Beds 3,939 Uninsured 1,325 36%
Skilled Nursing Unit Beds 168 Source: U.S. Census Bureau, 2015-2019 ACS
Source: Florida AHCA, 2021
Disability Status Value Percent
Medical Professionals Column1 Value With One Type of Disability 42,755 13%
Medical Doctors With Two or More Disabilities 44,110 13%
Licensed 1,191 Total With Any Disability
Limited License 5 Hearing 35,120 10%
Critical Need Area License 10 Vision 15,585 5%
Restricted 0 Cognitive 21,220 6%
Medical Faculty Certification 0 Ambulatory 54,685 16%
Public Health Certificate 0 Self-Care 18,090 5%
Other Professionals Independent Living 32,615 10%
Licensed Podiatric Physicians 91 With No Disabilities 209,300 62%
Licensed Osteopathic Physicians 686 Probable Alzheimer's Cases (65+) 34,655 10%
Dentists 669 Source: AGID 2014-18 ACS
Licensed Registered Nurses 16,654
Pharmacies 298 Medicaid & Medicare Beneficiaries Value Percent
Source: Florida Department of Health, 2021 60+ Medicaid Eligible 33,240 21%
60+ Dual Eligible 29,725 74%
Assisted Living Facility Column1 Value Source: Florida AHCA, 2021
Total ALF Beds 8,557
726 Adult Day Care (ADC)
Optional State Supplementation (OSS) Beds Column1 Value
Non-OSS Beds 7,831 ADC Facilities 12
Total ALF Facilities 171 Capacity 556
Facilities with Extended Congregate Care License 17 Source: Florida AHCA, 2021
Facilities with Limited Mental Health License 27
Facilities with Limited Nursing Service License 23 Home Health Agencies Column1 Value
Source: Florida AHCA, 2021 Agencies 109
Medicaid Certified Agencies 1
Medicare Certified Agencies 37
Homemaker and Companion Service Companies 131
Source: Florida AHCA, 2021
Unless otherwise noted, the data presented in this Profile refer to populations in Florida age 60 and older. 62021 Profile of Older Floridians
Column1
Pinellas County Health Profile and Medical Resources
Skilled Nursing Facility (SNF) Use Value Emergency Medical Services (EMS) Value
SNFs With Beds 71 Providers 24
Community Beds 69 EMS providers include air ambulances and ambulances with Basic Life
Sheltered Beds 3 Support (BLS) or Advanced Life Support (ALS).
Veterans Administration Beds 0 Source: Florida Department of Health, 2021
Other Beds 1
SNF Beds 7,893 Adult Family Care Homes Value
Community Beds 7,724 Homes 10
Sheltered Beds 135 Beds 47
Veterans Administration Beds 0 Source: Florida AHCA, 2021
Other Beds 34
SNFs With Community Beds 69 Memory Disorder Clinics Value
Community Bed Days 3,539,952 Total 0
Community Patient Days 2,846,880 Source: Florida DOEA's Summary of Programs and Services (SOPS), 2020
Medicaid Patient Days 1,915,172
Occupancy Rate 80% Dialysis Value
Percent Medicaid 67% End-Stage Renal Disease Centers 23
The day the patient is admitted is a patient day. A bed day is a day during which a Source: Florida Department of Health, 2021
person is confined to a bed and in which the patient stays overnight in a hospital.
Source: Florida AHCA, 2021
Column2
Pinellas County Disaster Preparedness
The disaster preparedness section presents the count and percentage of people age 60 or older living in the legislative
district that fall within particular storm surge evacuation zones, as well as the number of DOEA Home and Community-
Based Services (HCBS) clients who reside in these zones. The estimate of electricity-dependent individuals is presented
by insurance type to show the number of people who use electricity-dependent medical equipment necessary for things
such as survival or mobility. This information can also be used to evaluate the sufficiency of shelters, generators, and
evacuation route roadways to handle the needs of seniors and medically fragile adults in emergencies.
Electricity-Dependent Value Shelter Resources Value
Medicare Beneficiary 8,331 Number of General Shelters 58
Medicaid Beneficiary 8,896 General Shelter Max Capacity in People 29,667
Medicare beneficiary includes the entire Medicare population (65+ and SSI Recipients). Number of Special Needs Shelters 6
Medicaid beneficiaries are individuals age 60 to 64. Special Needs Shelters Max Capacity in People 1,745
Source: Florida AHCA and U.S. Centers for Medicare & Medicaid Services, 2021 Source: FDEM, 2021
Evacuation Zones Value Percent
DOEA HCBS Clients Residing in Evac Zone: 1,362 0%
Zone A 334 0%
Zone B 227 0%
Zone C 430 0%
Zone D 266 0%
Zone E 105 0%
DOEA HCBS Clients 6,011
Lives in an Evac Zone and Has Memory Problems 337 6%
Lives in an Evac Zone and Lives Alone 707 12%
Zones are associated with the following surge heights: Zone A up to 11 feet, Zone B up to 15 feet,
Zone C up to 20 feet, Zone D up to 28 feet, and Zone E up to 35 feet.
Source: Florida DOEA CIRTS, Florida Division of Emergency Management (FDEM), 2021
Unless otherwise noted, the data presented in this Profile refer to populations in Florida age 60 and older. 72021 Profile of Older Floridians
Column2
Pinellas County Disaster Preparedness
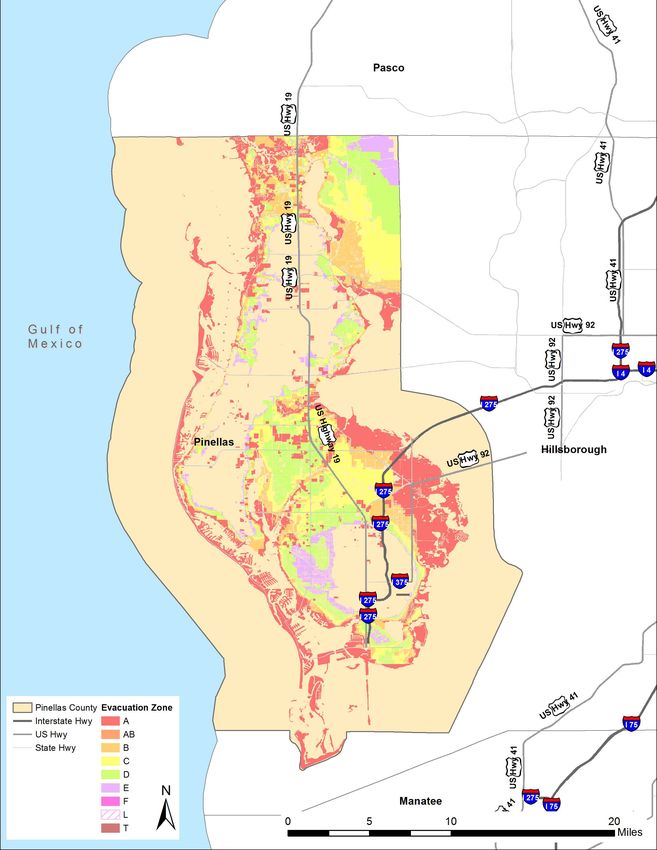
Evacuation Zones
Column1
Zones are associated with the following surge heights: Zone A up to 11 feet, Zone B up to 15 feet, Zone C up to 20 feet, Zone D up to 28 feet, and Zone E up to 35 feet.
Source: FDEM, 2021
Unless otherwise noted, the data presented in this Profile refer to populations in Florida age 60 and older. 8You can also read


