MI COVID response Data and modeling update - May 11, 2021 - State of ...
←
→
Page content transcription
If your browser does not render page correctly, please read the page content below

MI COVID response
Data and modeling update
May 11, 2021

NOTE: all data as of May 8 unless otherwise noted
Executive summary
Percent Positivity is down 14% and Case Rate is down 24% since last week. Positivity (10.8%, ↓1.8%) and case rates
(311.5, ↓86.3) have decreased for four weeks

  Michigan has the 2nd highest number of cases (↔), and highest case rate (↔) in the last 7 days (source: CDC
  COVID Data Tracker)

Percent of inpatient beds occupied by individuals with COVID has decreased 17% since last week and are
decreasing for 2 weeks. There are 13.2% (↓6.7%) inpatient beds occupied by COVID-19 patients.

  Michigan has the highest inpatient bed utilization (↔), and the highest adult ICU bed utilization (↑1) (source: US
  HHS Protect)

Deaths have decreased 14% since last week. There were 431 COVID deaths (↓21) between April 25 and May 1, and the
Death Rate is 6.2 deaths per million residents (↓0.3)

  Michigan has the 5th highest number of deaths (↔), and highest death rate (↑1) in the last 7 days (source: CDC
  COVID Data Tracker)

The 7-day average state testing rate has decreased to 3,198.1 tests/million/day (↓463.9). Daily diagnostic tests (PCR)
is 31.8K per day (↓4.6), and the weekly average for PCR and antigen tests conducted in Michigan is 61.0K (↓7.7K).

7.5 million COVID-19 vaccine doses reported to MDHHS, 55% of Michigan population 16+ has at least one dose

Comparison across states: Summary
What we see today (data through 5/8):
• 0 states are seeing increasing 1 week case trends (>=10%) (down vs. 5 last week)
• 6 states are seeing 1 week increases (>=10%) in new COVID hospital admissions (down vs.
  14 last week)
• Michigan, DC, Pennsylvania, Maryland and Florida have highest per capita hospitalized
  patient numbers.
• Midwest (case data from CDC as of 5/9):
   –   Wisconsin with slight decrease in hospitalizations (63/M) and decrease in cases (77/100k last 7d)
   –   Indiana with slight increase in hospitalizations (132/M), and decrease in cases (105/100k last 7d)
   –   Illinois showing stable hospitalizations (152/M), and decrease cases (120/100k last 7d)
   –   Ohio with stable hospitalizations (128/M) and decrease in cases (74/100k last 7d)
   –   Michigan showing decrease in hospitalizations (252/M) and decrease in cases (190/100k last 7d)

                                                                                                            3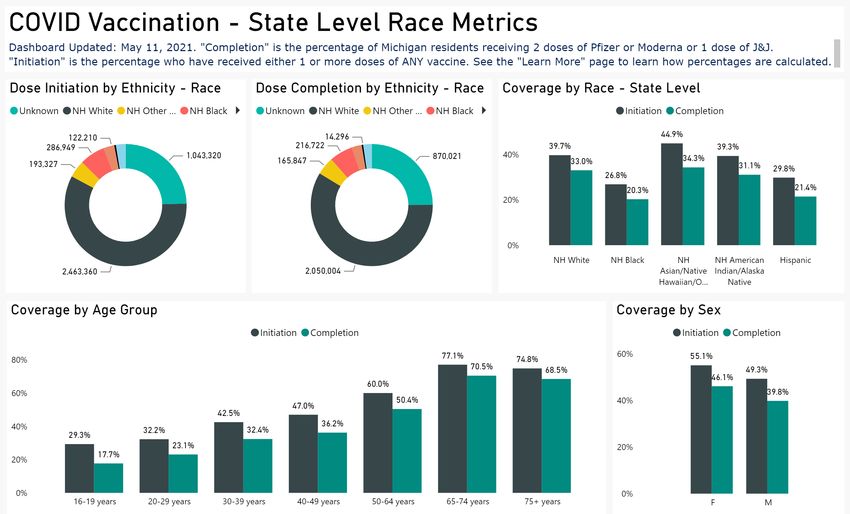
COVID-19 Spread
Statewide positivity has decreased to 10.8%
• One week decrease of 14% (vs. 11% decrease last week)
• Decreasing for four weeks (41% decrease since April 8 high)
• Positivity is declining in most MERC regions and remains above 10% in four regions
• Traverse City saw a slight increase in positivity since last week
Case rates (311.5 cases/million) are decreasing in the state (397.8 cases/million last week)
• One week decrease of 24% (vs. 30% decrease last week)
• Decreasing for four weeks (53% decrease since April 11 high)
• Cases per million are declining in all MERC regions
• Variants in Michigan: 7,764 confirmed B.1.1.7; 41 confirmed B.1.351; 259 confirmed B.1.427/B.1.429 ; 122 confirmed P.1
Number of active outbreaks is up 4% from previous week
— Reported school outbreaks have increased since last week (311 to 345)
— In the past week, the highest number of new clusters have been identified in baseball/softball, volleyball, track and
field, lacrosse, and soccer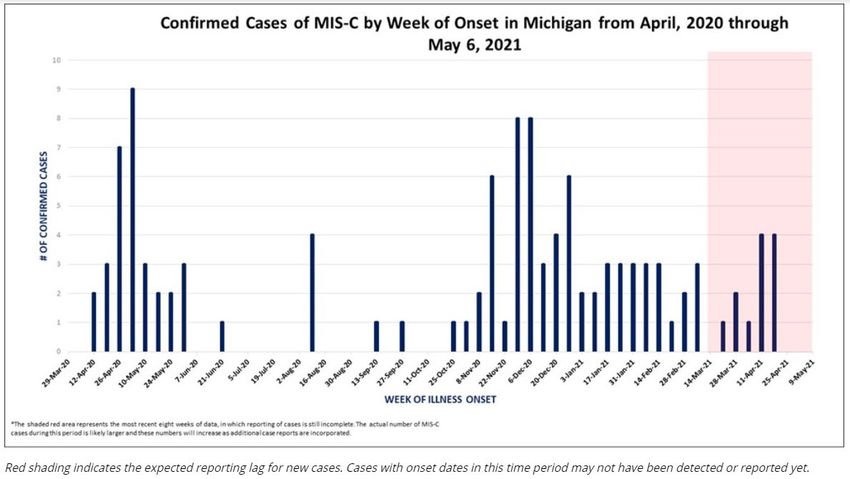
Confirmed and probable case indicators                                           Risk levels
Table Date: 5/8/2021 (7 days from date table was produced: 5/1/2021)   Low   A   B       C     D   E

 Cases                                             Positivity
Statewide Positivity Trends
Daily positivity and 7-day rolling average positivity for Michigan
    70%
                                                                                                                                           7-day average     Daily values

    60%

    50%

    40%

    30%

    20%

    10%

     0%
          3/10           4/10           5/10            6/10            7/10           8/10   9/10   10/10   11/10   12/10   1/10   2/10    3/10           4/10

•      Early in the pandemic, testing was not as robust as it has been since July 2020 to present
•      Positivity is an indicator of whether we are testing enough to identify cases and an early indicator of SARS-CoV-2
       transmission (as positivity decreases, we expect case rates to follow)
•      Positivity decreased by 14% between this week and last
•      Note: These are for PCR tests only and exclude tests conducted with Michigan Department of Corrections
    Note: Case information sourced from MDHHS and reflects date of onset of symptoms
    Source: MDHHS – Michigan Disease Surveillance System
Positivity by county, 4/30-5/6
                                                Average            # of counties        This week
                                                positivity per day                      Last week

                                                      =20%          0
                                                                         5

                                                Updates since last week:
                                                55 of 83 counties saw double digit positivity
                                                in the last week (9 county decrease)
                                                73 of 83 counties saw positivity > 7% in the
                                                last week (3 county increase)

Source: SEOC Testing Results – Excluding MDOC
COVID-19 cases by onset date: State of Michigan

            Cumulative confirmed and probable cases, by date of                                                            New confirmed and probable cases, by date of
            onset of symptoms                                                                                              onset of symptoms
              1000000                                                                                                       10000

                750000                                                                                                        7500

                500000                                                                                                        5000

                250000                                                                                                        2500

                         0                                                                                                          0
                             3/1       5/1         7/1          9/1        11/1        1/1         3/1         5/1                      3/1        5/1         7/1          9/1         11/1          1/1         3/1         5/1

Updates since last week:
•     Cases have decreased for four weeks
•     Statewide case rate is at risk level E (above 150 cases/million)
•     There are over 3,100 new cases per day (data through 4/24) which is down 855 from the prior week
•     Over 960,000 cases since Mar 1, 2020
Note: Case information sourced from MDHHS and reflects date of onset of symptoms (refers to lab-confirmed cases). Case spike on 5/12 is a result of batch of test results, not all of which have onset date of symptoms completed
Source: MDHHS – Michigan Disease Surveillance System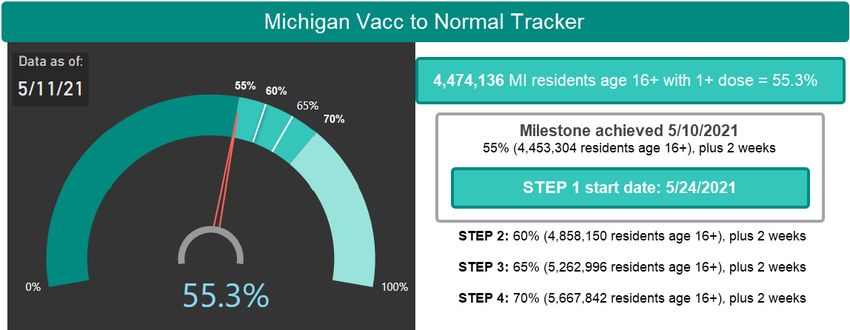
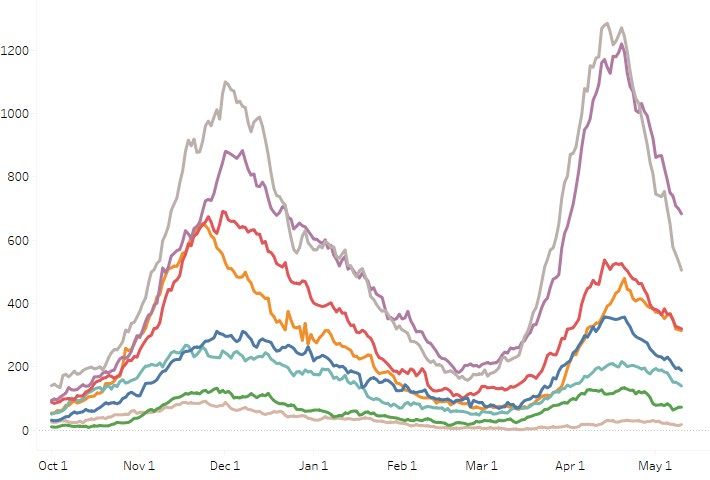
Age group: average new daily cases
Daily new confirmed and probable cases per million by age group (7-day rolling average)
    1200
                                   0-9                 30-39               60-69             State Rate
                                   10-19               40-49               70-79
    1000                           20-29               50-59               80+

     800

     600

     400

     200

        0
            3/1           4/1            5/1             6/1            7/1            8/1         9/1    10/1   11/1   12/1   1/1   2/1   3/1   4/1   5/1

•      All age groups by decade are decreasing
•      Those aged 10-19 have the highest case rates, followed by 20-29 and 30-39 age groups
•      Case rates for all age groups under 70 years are above 150 cases per million (Risk Level E)
    Note: Case information sourced from MDHHS and reflects date of onset of symptoms
    Source: MDHHS – Michigan Disease Surveillance System
Age group: average new daily cases
Daily new confirmed and probable cases per million by age group (7-day rolling average)
400 2-4
0-9
300
200
100
0
3/1 4/1 5/1 6/1 7/1 8/1 9/1 10/1 11/1 12/1 1/1 2/1 3/1 4/1 5/1
Note: y-axis
• Ages 0-9, including those 2-4, have seen case trends similar to the state
• Daily case rates for those aged 2-4 have peaked over 300 cases/mil in April
• Daily case rates for those aged 2-4 have been above 150 cases/million (Risk Level E) for over a month
Note: Case information sourced from MDHHS and reflects date of onset of symptoms
Source: MDHHS – Michigan Disease Surveillance SystemAge group: average new daily cases and daily case rate
Daily new confirmed and probable cases per million by age group (7-day rolling average)
Age Average Average One Week % Change since
Group daily cases Daily Case % Change (Δ #) 4/11/21* (Δ #)
Rate
0-9 269.6 233.8 -22% (-66) -38% (-141)
10-19 600.9 478.8 -21% (-129) -51% (-492)
20-29 572.9 415.2 -23% (-121) -53% (-475)
30-39 507.9 418.6 -20% (-107) -52% (-458)
40-49 415.4 352.2 -25% (-117) -56% (-456)
50-59 351.1 260.0 -29% (-108) -61% (-399)
60-69 231.6 181.5 -28% (-70) -56% (-231)
70-79 93.0 121.3 -32% (-57) -53% (-139)
80+ 56.9 137.3 -11% (-17) -35% (-75)
* Highest 7-day avg. following spring 2021 surge
Total¶ 3,122.3 311.5 -24% (-855) -53% (-3,512) ¶ Total may not reflect state due to missing age data
• Daily number of cases (600.9) and daily case rate (478.8 cases/mil) are currently highest for those 10-19
• All age groups under 60 are experiencing an average of more than 200 cases per day
• Since April 11, case rates have decreased more than 50% for those between the ages of 50 and 79
Note: Case information sourced from MDHHS and reflects date of onset of symptoms
Source: MDHHS – Michigan Disease Surveillance SystemAverage daily new cases per million people by race and ethnicity
Daily new confirmed and probable cases per million Daily new confirmed and probable cases per
(7 day rolling average) by race category million (7 day rolling average) by ethnicity category
American Indian/Alaska Native Black/African American Hispanic or Latino Not Hispanic or Latino
600 Asian/Pacific Islander White 600
500 500
400 400
300 300
200 200
100 100
0 0
2/8 2/22 3/8 3/22 4/5 4/19 5/3 2/8 2/22 3/8 3/22 4/5 4/19 5/3
Updates since last week:
• Cases per million are decreasing for all races and ethnicities
• Blacks and Hispanic/Latinos continue to have the highest case rates
• In the past 30 days, 33% of all cases represent unknown, multiple, or other races (27% of race is unknown, ↓3%)
• In the past 30 days, 31% of all cases have an unknown ethnicity reported (↓3%)
Note: Case information sourced from MDHHS and reflects date of death of confirmed and probable cases.
Source: MDHHS – Michigan Disease Surveillance SystemIdentified COVID-19 Cases Caused by All Variants of Concern
(VOC) in US and Michigan
SARS-CoV-2 Variants Circulating in the Variants of Concern in Michigan, May 8 .
United States, Mar 28 – Apr 10
233 cases in Wayne attributed to Detroit
Variant MI Reported Cases¶ # of Counties CDC est. prevalence
B.1.1.7 7,764* 70 70.8%
B.1.351 41 18 0.4%
B.1.427/B.1.429 259 39 3.7%
P.1 122 21 1.2%
Data last updated May 10, 2021 * 519 cases within MDOC; ¶ Numerous cases with county not yet determined
Source: https://covid.cdc.gov/covid-data-tracker/#variant-proportions and Michigan Disease Surveillance System (MDSS)Number of outbreak investigations by site type, week ending May 6
Easier to identify outbreak
Pre-decisional, for discussion only Draft Harder to identify outbreak
Site type Outbreaks by ongoing/new classification, # Visibility1 Total number of active
Ongoing New Total outbreaks is about the same
from previous week
K-12 SCHOOL 278 67 345
MANUFACTURING, CONSTRUCTION 220 24 244
SNF/LTC/OTHER ASSISTED LIVING 156 24 180 Following K-12 (67), the
*RETAIL 97 14 111 greatest number of new
CHILDCARE/YOUTH PROGRAM 59 14 73 outbreaks were reported in
*RESTAURANTS AND BARS 61 11 72 manufacturing/construction
OFFICE SETTING 50 5 55 (24), SNF/LTC (24), childcare/
HEALTHCARE 28 7 35 youth programs (14), retail
*SOCIAL GATHERING 21 4 25 (14), and bars & restaurants
OTHER 17 5 22 (11).
COLLEGE/UNIVERSITY 19 0 19
*PERSONAL SERVICES 12 2 14 LHDs reported new outbreaks
*RELIGIOUS SERVICES 14 0 14 in all settings except in College
AGRICULTURAL/FOOD PROCESSING 13 1 14 and Universities, Religious
CORRECTIONS 13 0 13 Services, Agriculture and Food
*SHELTERS 5 0 5 Processing, Corrections,
*COMMUNITY EXPOSURE - OUTDOOR 2 0 2 Shelters, and both Indoor and
*COMMUNITY EXPOSURE - INDOOR 0 0 0 Outdoor Community
TOTAL 1065 178 1243 Exposures.
1. Based on a setting’s level of control and the extent of time patrons/residents spend in the particular setting, different settings have differing levels of ability to ascertain whether a case derived from that setting
NOTE: Many factors, including the lack of ability to conduct effective contact tracing in certain settings, may result in significant underreporting of outbreaks. This chart does not provide a complete picture of
outbreaks in Michigan and the absence of identified outbreaks in a particular setting in no way provides evidence that, in fact, that setting is not having outbreaks.
Source: LHD Weekly SitrepsCOVID-19 K-12 Sports Related Clusters and Cases
Cumulative Since Jan 2021 through May 2021
491 cases 363 cases 280 cases 108 cases 65 cases 44 cases 48 cases 36 cases
123 clusters 56 clusters 72 clusters 23 clusters 33 clusters 4 clusters 15 clusters 9 clusters
27 cases 24 cases 19 cases 15 cases 14 cases 28 cases
13 clusters 11 clusters 10 clusters 8 clusters 3 clusters 17 clusters
• Cases identified by local public health which include school-affiliated and club/travel/regional sports (spectators,
collegiate, and professional sports as well as secondary cases to collegiate/professional sports are excluded)
• Since January 2021, basketball, hockey, and wrestling have had the highest number of cases and clusters
• Largest number of new clusters identified in spring sports of baseball/softball, volleyball, lacrosse, soccer, and track
• Cases and clusters have occurred in 24 different sport settings
Source: MDHHS – Michigan Disease Surveillance SystemCOVID-19 and Healthcare Capacity and COVID Severity Multisystem Inflammatory Syndrome in Children (MIS-C) has been identified in 115 (↑9) children in Michigan • Majority of cases are male, between the ages of 5-10, Caucasian, and non-Hispanic/Latino Hospitalizations and ICU utilization are decreasing COVID-like illness (CLI) has fallen to 5.3% (vs. 6.4% last week) Hospital admissions are decreasing statewide and for most age groups Hospitalizations down 22% since last week (vs. 19% decline week prior) All regions are showing decline in hospitalization trends this week Volume of COVID-19 patients in intensive care has decreased 15% since last week (vs. 10% decline week prior) Death rate has decreased to 6.2 daily deaths per million people First decrease in mortality in two months 12% decrease since last week Proportion of deaths among those under 60 years of age is increasing
Multisystem Inflammatory Syndrome in Children (MIS-C)

Source: MDHHS – Michigan Disease Surveillance System and Michigan.gov/coronavirus dashboard
Michigan Trends in Emergency Department Visits for COVID-19-Like
Illness (CLI)

                                                                                        5.3%

                                            Source: https://covid.cdc.gov/covid-data-tracker/#ed-visits
Average Hospital Admissions by Age
Confirmed COVID-19 Hospital Admissions by Age Group - Statewide Rolling Weekly Average
Age Daily Avg One Week % % Change
140 Group Adm. Change (#) since 4/14*
(#)
120
Peds 1-5 -56% (-5.9) -38% (-1-5)
100
18-19 1-5 40% (1-5) -38% (-1-5)
80 20-29 20.7 -26% (-7.4) -39% (-13.0)
60 30-39 28.4 -20% (-7.3) -41% (-20.0)
40 40-49 36.0 -19% (-8.4) -54% (-41.9)
20 50-59 56.3 -23% (-16.4) -51% (-58.1)
60-69 63.3 -18% (-14.1) -51% (-65.0)
0
4/11 4/14 4/17 4/20 4/23 4/26 4/29 5/2 5/5 5/8 70-79 48.3 -17% (-9.9) -43% (-37.1)
Peds 18 - 19 20 - 29 30 - 39 40 - 49
80+ 36.0 -18% (-8.0) -41% (-24.7)
50 - 59 60 - 69 70 - 79 80+ Age
Unkn Total¶ 309.6 -20% (79.6) -48% (-291)
* Highest 7-day avg. hosp. adm. following Spring 2021 surge
¶ Total may not reflect state due to missing age data
• Currently, there are approximately 310 daily hospital admissions for COVID-19
• Over the past week, those 60-69 have seen the highest avg. daily hospital admissions (63 admissions)
• Since the Apr 14 high, those 40-69 have seen the > 50% decrease in avg. daily hospital admissions
Source: CHECC & EM ResourceStatewide Hospitalization Trends: Total COVID+ Census
Hospitalization Trends 10/1/2020 – 5/10/2021 COVID+ census in hospitals continues to
Confirmed Positive & Persons Under Investigation (PUI) decline from the April 19th peak.
This week is down 22% from the previous
Confirmed Positive week (previous week was down 19%).
Hospitalized COVID Positive Long Term
Trend (beginning March 2020)
PUI
20Statewide Hospitalization Trends: Regional COVID+ Census
All regions are showing decreasing COVID+
Hospitalization Trends 10/1/2020 – 5/10/2021 census trends this week.
Confirmed Positive by Region
Only Region 2S is above 300/M population
Region 1 hospitalized and 4 regions (Regions 1, 5, 7, and
Region 2N
Region 2S 8) are now below 200/M hospitalized.
Region 3
Region 5
Region 6
Region 7 Region COVID+ COVID+
Region 8 Hospitalizations (% Δ Hospitalizations
from last week) / MM
Region 1 188 (-19%) 174/M
Region 2N 505 (-31%) 228/M
Region 2S 683 (-21%) 307/M
Region 3 320 (-12%) 282/M
Region 5 139 (-27%) 146/M
Region 6 314 (-14%) 214/M
Region 7 72 (-10%) 144/M
Region 8 17 (-23%) 55/M
21Statewide Hospitalization Trends: ICU COVID+ Census
Hospitalization Trends 8/1/2020 – 5/10/2021 Overall, the census of COVID+ patients in ICUs has
Confirmed Positive in ICUs decreased 15% from last week, with all regions
showing decreases.
Region 6 continue to have >35% ICU beds occupied
with COVID patients.
Region Adult COVID+ in Adult ICU % of Adult ICU
ICU (% Δ from Occupancy beds COVID+
last week)
Region 1 50 (-11%) 93% 25%
Region 2N 122 (-22%) 85% 20%
Region 2S 214 (-14%) 86% 27%
Confirmed
Positive in ICU Region 3 97 (-9%) 90% 26%
Region 5 36 (-16%) 77% 22%
Region 6 102 (-6%) 85% 38%
Region 7 27 (-33%) 71% 15%
Region 8 6 (-26%) 66% 10%
Hospital bed capacity updated as of 5/7
22Average and total new deaths, by age group
Daily confirmed and probable deaths per million by Total confirmed and probable deaths by age group
age group (7 day rolling average) (past 30 days, ending 5/1/2021)
0-19 40-49 70-79 • 22% of deaths below age 489
20-29 50-59 80+ sixty 462
50 30-39 60-69 Total 440
40
30
221
20
100
10
54
18
0 8
2/8 2/22 3/8 3/22 4/5 4/19 5/3
0-19 20-29 30-39 40-49 50-59 60-69 70-79 80+
Note: Death information sourced from MDHHS and reflects date of death of confirmed and probable cases.
Source: MDHHS – Michigan Disease Surveillance System30-day rolling average daily deaths per million people by race and
ethnicity
Average daily deaths per million people by race Average daily deaths per million people by
ethnicity
10 American Indian/Alaska Native Black/African American 10 Hispanic or Latino Not Hispanic or Latino
Asian/Pacific Islander White
7.5 7.5
5 5
2.5 2.5
0 0
2/8 2/22 3/8 3/22 4/5 4/19 5/3 2/8 2/22 3/8 3/22 4/5 4/19 5/3
Updates since last week:
• Deaths are a lagging indicator of cases
• Several racial and ethnic groups are seeing an increase in COVID deaths
• American Indian/Alaskan Natives, Blacks and Non-Hispanics/Latinos have the most reported deaths per capita
• Deaths are not adjusted for confounders (e.g., age, sex, comorbidities)
Note: Death information sourced from MDHHS and reflects date of death of confirmed and probable cases.
Source: MDHHS – Michigan Disease Surveillance SystemHow is public health capacity?
Diagnostic testing volume (PCR and antigen) has decreased slightly from last week
• PCR testing decreased since last week
• Percent of antigen tests have increased since last week
Cases identified for investigations has declined
• Number of cases not investigated this week (10,165) is 36% lower than prior week (15,881)
• As cases have decreased, the percent of interviews attempted has improved
• Consistent low proportion of cases interviewed with a source of known infection (indicating community acquisition)
• Consistent low proportion of those quarantining when their symptoms begin (indicating no effective halt in community
transmission)`
Daily diagnostic tests, by message date
Last 90 Days Tests By Test Type and Message Date Weekly Update
120,000 • 60,950 rolling 7-day
average daily
100,000
diagnostic tests
reported to MDHHS
(PCR + Ag) (↓)
80,000
• 36,556 average daily
PCR tests (↓)
60,000
• 40.0% are antigen
tests over the past
40,000 week (↑)
20,000 • 10.8% positivity in
PCR tests (↓)
-
2/6 2/13 2/20 2/27 3/6 3/13 3/20 3/27 4/3 4/10 4/17 4/24 5/1
Total Diagnostic Tests Total Antigen Tests 7 day moving average, diag. tests
Source: MDSS/Michigan Medical Advantage Group, MDHHS, testing labsNew Case Investigation Metrics (Statewide)
New Communicable Disease metrics this week:
• Number of cases identified for investigations (↓), and percent of completed interviews (↑) have improved from prior week
• 42% of investigated cases having a known source (43% last week, 50% week prior)
• 29% of investigated cases noted that they were quarantining before symptoms (29% last week)
04/24-04/30 Case report form information 05/01-05/07 Case report form information
24,327
Yes No Not answered
17,748
15,881
10,165
8,446 8,446
20% 30% 7,583 7,583
36% 20% 27%
8,446 41%
7,583 39%
(35%) 43%
43% (43%)
29% 42% 29%
Case investigation complete? Known source of infection? Already quarantining at time Case investigation complete? Known source of infection? Already quarantining at time
of symptom onset? of symptom onset?
Source: MDHHS – Michigan Disease Surveillance SystemCOVID-19 Vaccination
Eligibility
• FDA authorized Pfizer-BioNTech COVID-19 Vaccine for emergency use in adolescents 12 and older.
• Advisory Committee on Immunization Practices meeting on May 12 to discuss a recommendation for the use
of this vaccine for the prevention of COVID-19 in persons aged 12 years and older.
Administration
• 8th among all states for doses administered; 8th for number fully vaccinated (CDC data tracker 5/10/2021)
• 77.2% adjusted administration ratio (excluding federal entities, CDC channel portfolio 5/9/2021)
• Weekly doses administered declined for four weeks
Coverage
• 55% of MI residents age 16+ initiated vaccination and 44.7% completed the series (CDC data tracker 5/10/21)
• Coverage is highest among 65-75 and 75+ age groups, but more than 67% of people 50-64 have started vaccine
• Initiation coverage was highest among Asian, Native Hawaiian or Pacific Islander individuals (MI Covid Vaccine
Dashboard 5/11/21)
Vaccinated Individuals Who Test Positive
• Number of cases who are fully vaccinated (n=4,031) is not in excess of what might be expected with vaccines
with 95% efficacy.Doses Delivered and Administered, and Coverage as of 5/11
10,118,055 doses delivered to Michigan providers*
7,735,604 doses Administered (CDC tracker) – MI detail on 7,489,457
• 61,550 in Ohio
77.2% adjusted administration ratio (excluding federal entities, CDC channel portfolio 5/9/2021)
• Last two weeks less than 500,000 doses administered in a week
• 386,069 doses administered last week (down ~48,800 doses over previous week). Loss is in first doses.
*Includes state allocated doses ordered by State of Michigan, SOM allocation transferred to federal programs, and federal doses from federal programs to Michigan providers. Does not
include federal doses sent to federal providers (i.e., Veteran’s Administration hospitals, federal prison system, or Department of Defense programs). The State of Michigan does not
have control over how much vaccine is allocated or administered by Federal program.55.3% of 16+ years have had at least one dose of vaccine
Coverage Demographics as of 5/11/2021

55% of MI residents age 16+ have
initiated COVID vaccination (CDC)
3,621,896 people completed series
(CDC)
Age Group (Michigan dashboard)
•   67.5% of those 50+ started vaccine
    series vs 38.8% of 16-49 years
•   69.6% people aged 65 or older have
    completed their vaccine series
Race/Ethnicity
•     Initiation coverage highest among
      those of Asian, Native Hawaiian or
      Pacific Islander Race (44.9%) then
      NH (Non-Hispanic) White (39.7%),
      American Indian (39.3%), NH Black
      or African American (26.8%) Races,
      and Hispanic (29.8%) ethnicity

•   24.6% data missing or unknown

Source: Michigan Coronavirus Dashboard https://www.michigan.gov/coronavirus/0,9753,7-406-98178_103214-547150--,00.html
Potential COVID-19 Vaccination Breakthrough Cases
Process:
Michigan part of CDC’s nationwide investigation (COVID-19 Breakthrough Case Investigations and Reporting | CDC)
Weekly match COVID-19 cases to records of all fully vaccinated persons
Absence of a positive test less than 45 days prior to the post-vaccination positive test
Send data to CDC and, if available, gather respiratory specimens for whole genome sequencing
Michigan Data (1/1/21 through 5/4/21):
4,937 cases met criteria based on a positive test 14 or more days after being fully vaccinated
Less than 1% of people who were fully vaccinated met this case definition
— Includes 59 deaths (56 persons age 65 years or older)
— 199 cases were hospitalized
Summary Points:
• Number of potential cases identified to date is not in excess of what might be expected with vaccines with 95% efficacy.
• Proportions of those symptomatic, hospitalized, and who died are all lower than those who are unvaccinated.
• Continue to encourage precautions while out in public, including wearing masks, washing hands and social distancing,
even after receiving the vaccine until more Michiganders have been able to be vaccinated.Other Public Health Indicators Provisional Data on Suicide Deaths • Compared to 2019, the provisional number of suicide deaths in Michigan in 2020 have not increased • Nationally, provisional death data also does not show increases in suicide deaths
Provisional Data on Suicide Deaths in 2020                                                                                                                2017
                                                                                                                                                             2018
                                                                                                                                                                          2019
                                                                                                                                                                          2020
                                                                                                       Michigan Suicide Deaths by Month, 2019 and 2020
                                                                                     180
  •   Compared to data from 2017-2019, the                                           160
                                                                                     140
      provisional number of suicide deaths in                                        120
      Michigan in 2020 have not increased1                                           100
                                                                                      80
                                                                                      60
                                                                                      40
  •   Nationally, provisional death data also does not                                20
      show increases in suicide deaths2                                                0

  •   Future years may see an increase in suicide
      deaths as mental health has been negatively
      impacted due to the pandemic

  •   Nationally, declined mental health has also
      impacted deaths due to other causes (e.g.,
      unintentional injuries and drug overdoses) which
      were increasing prior to the pandemic but have
      continued to increase2 but this occurrence hasn’t
      been seen in NVDRS data in Michigan1

Sources: 1. National Violent Death Reporting System, 2. Ahmad (2021) The Leading Causes of Death in the US for 2020. JAMA. 2021;325(18):1829-1830. doi:10.1001/jama.2021.5469
Michigan cases
projected to continue
decline in coming
weeks—potentially
some slowing
• All regions also projected to decline or
plateau
• Projections suggest statewide 7-day
average will be below 250 cases/million
in coming weeks
• Line is the ridge regression model projection, and
the shaded region represents the 95% + Upper Peninsula
confidence region (2.5% and 97.5% quantiles).
• Projections are based on previous data on cases,
hospitalizations, and deaths, as well as data on
mobility and vaccinations. Sources: Data from MDHHS/JHU,
• Cases are plotted by report date. UM Ridge Regression ModelCOVID-19 and Vaccination in Israel
• Israel has had one of the fastest
national vaccination campaigns
• Nearly 60% of population in
Israel fully vaccinated against
SARS-CoV-2
• Israel’s campaigned focused on
those most susceptible to severe
outcomes of COVID-19, with
over 85% of those 60+
vaccinated within two months
Sources: Our World In Data; Rossman (2021) COVID-19 dynamics after a national immunization program in IsraelCOVID-19 and Vaccination in Israel
• Compared to peak values, there was
• 77% drop in cases
• 45% drop in positive test
percentage
• 68% drop in hospitalizations
• 67% drop in severe
hospitalizations
• Even after adjusting for other factors
like lockdowns, case rates dropped
more dramatically for those of older
age and in cities with higher
vaccination coverage
• Recently, Israel has lifted outdoor
mask mandate and resumed in
person schooling
Sources: Our World In Data; Rossman (2021) COVID-19 dynamics after a national immunization program in IsraelYou can also read