Polarization in Monte Carlo radiative transfer and dust scattering polarization signatures of spiral galaxies
←
→
Page content transcription
If your browser does not render page correctly, please read the page content below
Astronomy & Astrophysics manuscript no. main                                                                                           c ESO 2018
                                                September 22, 2018

                                                               Polarization in Monte Carlo radiative transfer and dust
                                                                scattering polarization signatures of spiral galaxies
                                                                           C. Peest?1,2 , P. Camps1 , M. Stalevski1,3,4 , M. Baes1 , and R. Siebenmorgen2

                                                      1
                                                          Sterrenkundig Observatorium, Universiteit Gent, Krijgslaan 281 S9, B-9000 Gent, Belgium
                                                      2
                                                          European Southern Observatory, Karl-Schwarzschild-Str. 2, D-85748 Garching b. München, Germany
                                                      3
                                                          Universidad de Chile, Observatorio Astronomico Nacional Cerro Calan, Camino El Observatorio 1515, Santiago, Chile
                                                      4
                                                          Astronomical Observatory, Volgina 7, 11060 Belgrade, Serbia

                                                      Preprint online version: September 22, 2018
arXiv:1702.07354v1 [astro-ph.IM] 23 Feb 2017

                                                                                                                    ABSTRACT

                                                      Polarization is an important tool to further the understanding of interstellar dust and the sources behind it. In this paper we describe
                                                      our implementation of polarization that is due to scattering of light by spherical grains and electrons in the dust Monte Carlo radiative
                                                      transfer code SKIRT. In contrast to the implementations of other Monte Carlo radiative transfer codes, ours uses co-moving reference
                                                      frames that rely solely on the scattering processes. It fully supports the peel-off mechanism that is crucial for the efficient calculation
                                                      of images in 3D Monte Carlo codes. We develop reproducible test cases that push the limits of our code. The results of our program are
                                                      validated by comparison with analytically calculated solutions. Additionally, we compare results of our code to previously published
                                                      results. We apply our method to models of dusty spiral galaxies at near-infrared and optical wavelengths. We calculate polarization
                                                      degree maps and show them to contain signatures that trace characteristics of the dust arms independent of the inclination or rotation
                                                      of the galaxy.
                                                      Key words. Polarization – Radiative transfer – Methods: numerical – ISM: dust, extinction – Galaxies: spiral

                                               1. Introduction                                                               culate the changes to the polarization state for each interaction
                                                                                                                             with a dust grain.
                                               Many astronomical objects contain or are shrouded by dust.                        As a result, various authors have made different choices
                                               Often, a non-negligible fraction of ultraviolet (UV) to near-                 for implementing polarization in Monte Carlo radiative trans-
                                               infrared (NIR) radiation emitted by embedded sources is scat-                 fer (MCRT) codes. Most commonly, the MCRT codes consider
                                               tered or absorbed by dust grains before leaving the system.                   only scattering by spherical dust grains (e.g., Bianchi et al. 1996;
                                               Scattered radiation is generally polarized. The polarization state            Pinte et al. 2006; Min et al. 2009; Robitaille 2011; Goosmann
                                               of the light can be used to deduce information about the grains               et al. 2014). Some codes include more advanced support for
                                               that would not be available using intensity measurements alone                polarization by absorption and scattering off aligned spheroids
                                               (Scicluna et al. 2015). There are indications that dust properties            (Whitney & Wolff 2002; Lucas 2003; Reissl et al. 2016) and/or
                                               differ widely and systematically between galaxies (Fitzpatrick                for polarized dust emission (Reissl et al. 2016).
                                               & Massa 1990; Gordon et al. 2003; Rémy-Ruyer et al. 2015;                        To verify the correctness of the various polarization im-
                                               Dale et al. 2012; De Vis et al. 2016) and that they can vary sig-             plementations, authors sometimes compare the results between
                                               nificantly within a galaxy (Draine et al. 2014; Mattsson et al.               codes (e.g. Pinte et al. 2009). Because of the variations in as-
                                               2014). Polarimetric studies can help in constraining these prop-              sumptions and capabilities, however, such a comparison is tricky
                                               erties. Theoretical frameworks for modeling radiative transfer                and the ‘correct’ result is usually simply assumed to be the re-
                                               therefore usually include a section on polarization (see, e.g.,               sult obtained by a majority of the codes. Even when the basic
                                               Chandrasekhar 1950; Van De Hulst 1957).                                       assumptions about grain shape and alignment as well as the dust
                                                    Numerical simulations of dust radiative transfer most com-               mixture are the same and the codes support the same polarization
                                               monly use the Monte Carlo technique (see, e.g., Whitney 2011;                 processes, comparing results is usually complicated.
                                               Steinacker et al. 2013). Codes using this method track many in-                   In this paper we present a robust framework that is indepen-
                                               dividual photon packages as they propagate through the dusty                  dent of a coordinate system for implementing polarization in a
                                               medium, simulating emission, scattering, and absorption events                tree-dimensional (3D) MCRT code. The mathematical formu-
                                               based on random variables drawn from the appropriate proba-                   lation and the numerical calculations in our method rely solely
                                               bility distributions. While it is conceptually straightforward to             on reference frames determined by the physical processes un-
                                               track the polarization state of a photon package as part of this              der study (i.e., the propagation direction or the scattering plane)
                                               process, there are many details to be considered, and the imple-              and not on those determined by the coordinate system (i.e., the
                                               mentation complexity depends on the assumptions and approxi-                  z-axis). This approach avoids numerical instabilities for special
                                               mations one is willing to make. Moreover, the dust model used                 cases (i.e., a photon package propagating in the direction of the
                                               by the code must provide the extra properties necessary to cal-               z-axis or close to it) and enables a more streamlined implemen-
                                                ?
                                                    christian.peest@ugent.be                                                 tation.

                                                                                                                                                                                                    1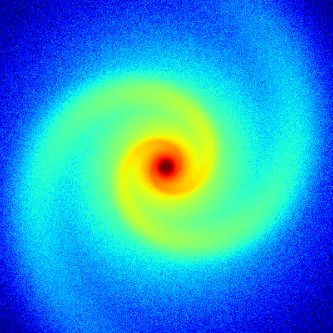
C. Peest et al.: Polarization in RT simulations
We have implemented this framework in SKIRT1 (Baes et al. d
2003; Baes et al. 2011; Camps & Baes 2015), a versatile multi- +U −U
purpose Monte Carlo dust radiative transfer code. It has been de-
signed and optimized for systems with a complex 3D structure,
as multiple components are configured separately and construct γ
el. field
a more complex model for the dust and/or radiation sources
vector
(Baes & Camps 2015). The code is equipped with a range of
efficient grid structures on which the dust can be spatially dis- −Q
cretized, including octree, k-d tree, and Voronoi grids (Saftly
et al. 2013, 2014; Camps et al. 2013). A powerful hybrid par-
allelization scheme has been developed that guarantees an op-
timal speed-up and load balancing (Verstocken et al. in prep.), k +Q
and it opens up a wide range of possible polarization applica-
tions. In order to test the correct behavior and the accuracy of Fig. 1. Illustration of the Stokes vector conventions recom-
our implementation, we have developed a number of analytical mended by IAU (1974) and used in this paper. The radiation
test cases designed to validate polarization implementations in beam travels along its propagation direction, k, out of the page.
a structured manner. Furthermore, we carefully match our po- The electric field vector describes an ellipse over time. The linear
larimetric conventions to the recommendations issued by the polarization angle, γ, is given by the angle between the primary
International Astronomical Union (IAU 1974). axis of the ellipse (green line) and the reference direction, d. The
In large-scale dust systems complex geometries arise and position angle of the electric field vector increases with time, the
need to be handled by the codes. We first apply our method beam has right-handed circular polarization.
to some elementary models of dusty disk galaxies, enabling a
qualitative comparison with the two-dimensional (2D) models
of Bianchi et al. (1996). We also perform the polarization part The (linear) polarization angle, γ, can be written as
of the Pinte et al. (2009) benchmark and compare with the pub- !
lished results. 1 U
γ = arctan2 , (4)
We then implement spiral arms into dusty disk galaxy mod- 2 Q
els and show that this produces a marked polarimetric signature
tracing the positions of the arms. Our current implementation where arctan2 denotes the inverse tangent function that preserves
supports only scattering by spherical grains. Dichroic extinction the quadrant. Combining Eqs. (3) and (4), we can also write
and more complex grain shapes may also have a strong influ-
Q = IPL cos 2γ, (5a)
ence (Voshchinnikov 2012; Siebenmorgen et al. 2014; Draine &
Fraisse 2009) and will be supported in future work. U = IPL sin 2γ. (5b)
In Sect. 2 we summarize the notation and conventions used
in this paper to describe the polarization state of electromagnetic The values of Q and U depend on the polarization angle γ,
radiation, and we provide recipes for translation into other con- which describes the angle between the direction of linear polar-
ventions. We then present our method and its implementation ization and a given reference direction, d, in the plane orthogonal
in Sect. 3, and the accompanying analytical test cases and their to the propagation direction, k. The angle is measured counter-
results in Sect. 4. The application of our method to benchmark clockwise when looking at the source, as illustrated in Fig. 1.
tests is described in Sect. 5. The dusty spiral galaxy model is de- A linear polarization angle in the range 0 < γ < π/2 implies a
scribed and implemented in Sect. 6. We summarize and conclude positive U value. A radiation beam is said to have right-handed
in Sect. 7. circular polarization (with V > 0) when the electric field vec-
tor position angle increases with time, and left-handed when it
decreases.
2. Polarization The reference direction, d, can be chosen arbitrarily as long
as it is well defined and perpendicular to the propagation direc-
2.1. Stokes vector
tion. However, when the polarization state changes as a result of
The polarization state of electromagnetic radiation is commonly an interaction (e.g., a scattering event), most recipes for prop-
described by the Stokes vector, S (see, e.g., Van De Hulst 1957; erly adjusting the Stokes vector require the reference direction
Chandrasekhar 1950; Bohren & Huffman 1998; Mishchenko to have a specific orientation (e.g., lying in the scattering plane).
et al. 1999), Before applying the recipe, the existing reference direction must
I be rotated about the propagation direction to match this require-
Q ment. This is accomplished by multiplying the Stokes vector by
S = , (1) a rotation matrix, R(ϕ),
U
V
Snew = R(ϕ) S. (6)
where I represents the intensity of the radiation, Q and U de-
scribe linear polarization, and V describes circular polarization. A rotation about the direction of propagation by an angle ϕ,
The degrees of total and linear polarization, P and PL , can be counter-clockwise when looking toward the source of the beam,
written as a function of the Stokes parameters, is described by the matrix
p
P = Q2 + U 2 + V 2 /I, (2) 1
0 0 0
p 0 cos 2ϕ sin 2ϕ 0
PL = Q2 + U 2 /I. (3) R(ϕ) = . (7)
0 − sin 2ϕ cos 2ϕ 0
1
http://www.skirt.ugent.be 0 0 0 1
2
C. Peest et al.: Polarization in RT simulations
To record the polarization state change for a scattering event, Table 1. Conventions adopted by various authors regarding the
the Stokes vector is multiplied by the Müller matrix, M, corre- sign of the Stokes parameters U and V relative to IAU (1974)
sponding to the event, assuming that the reference direction lies (+U,+V).
in the scattering plane (as well as in the plane orthogonal to the
propagation direction). The Müller matrix components depend +U −U
on the geometry of the scattering event and the physical proper- IAU (1974) Chandrasekhar (1950)
ties of the scatterer, and they often depend on the wavelength. In Martin (1974) Van De Hulst (1957)
general, the Müller matrix is Tsang et al. (1985) Hovenier & Van der Mee (1983)*
Trippe (2014) Fischer et al. (1994)*
S 11 S 12 S 13 S 14
+V
Code & Whitney (1995)*
S S S S Mishchenko et al. (1999)*
M(θ, λ) = 21 22 23 24 , (8)
S 31 S 32 S 33 S 34 Gordon et al. (2001)*
S 41 S 42 S 43 S 44 Lucas (2003)
Górski et al. (2005)
where θ is the angle between the propagation directions before Shurcliff (1962) Bohren & Huffman (1998)
−V
and after the scattering event, and λ is the wavelength of the Bianchi et al. (1996)* Mishchenko et al. (2002)
radiation. For clarity of presentation, we drop the dependencies * Convention indicated by citing papers with this convention
from the notation for the individual Müller matrix components.
Including the reference direction adjustments before and after
the actual scattering event, ϕ and ϕnew , the transformation of a constructed for different conventions, changes in the signs of U
Stokes vector for a scattering event can thus be written as and V affect the sign of the Müller matrix components (Eq. 8)
in the third row and column and fourth row and column, respec-
Snew = R(ϕnew ) M(θ, λ) R(ϕ) S. (9) tively. Mathematically this can be described by multiplying the
Müller matrix by signature matrices,
For scattering by spherical particles, the Müller matrix sim-
plifies to (Krügel 2002) 1 0 0 0
1 0 0 0
0 1 0 0 0 1 0 0
S 11 S 12 0 0 M+U,+V = MσU,ςV (12)
0 0 σ 0 0 0 σ 0
S 12 S 11 0 0
MSph (θ, λ) = , (10) 0 0 0 ς 0 0 0 ς
0 0 S 33 S 34
S 11 S 12 σS 13 ςS 14
0 0 −S 34 S 33
S 21 S 22 σS 23 ςS 24
= , (13)
again assuming that the reference direction lies in the scattering σS 31 σS 32 S 33 σςS 34
plane. The Müller matrices for a particular grain size and mate- ςS 41 ςS 42 σςS 43 S 44
rial can be calculated using Mie theory (see e.g., Voshchinnikov
& Farafonov 1993; Bohren & Huffman 1998; Peña & Pal 2009). with σ and ς being +1 or −1. In case of the rotation matrix,
For scattering by electrons, also called Thomson scattering, Eq. (7), this implies that the signs in front of the sine functions
the Müller matrix is wavelength-independent and can be ex- change based on the chosen convention.
pressed analytically as a function of the scattering angle (Bohren
& Huffman 1998),
3. Method
cos θ + 1 cos2 θ − 1
2
0 0
3.1. SKIRT code
1 cos θ − 1 cos θ + 1
2 2
0 0
MTh (θ) = .
(11)
2 0 0 2 cos θ 0 SKIRT (Baes et al. 2003; Baes et al. 2011; Camps & Baes 2015)
0 0 0 2 cos θ is a public multipurpose MCRT code for simulating the effect
of dust on radiation in astrophysical systems. It offers full treat-
ment of absorption and multiple anisotropic scattering by the
2.2. Conventions dust, self-consistently computes the temperature distribution of
In this paper we define the Stokes vector following the rec- the dust and the thermal dust reemission, and supports stochas-
ommendations of the International Astronomical Union (IAU tic heating of dust grains (Camps et al. 2015). The code handles
1974), as presented in Sect. 2.1 and illustrated in Fig. 1. multiple dust mixtures and arbitrary 3D geometries for radia-
Historically, however, authors have used various conventions tion sources and dust populations, including grid- or particle-
for the signs of the Stokes parameters U and V (Hamaker & based representations generated by hydrodynamical simulations
Bregman 1996, see also a recent IAU announcement2 ). For ex- (Camps et al. 2016).
ample, the polarization angle γ is sometimes measured while SKIRT is predominantly used to study dusty galaxies (Baes
looking toward the observer rather than toward the source, flip- et al. 2010; De Looze et al. 2012, 2014; De Geyter et al. 2014,
ping the sign of both U and V. Reversing the definition of cir- 2015; Saftly et al. 2015; Mosenkov et al. 2016; Viaene et al.
cular polarization handedness also flips the sign of V. Table 1 2016), but it has also been applied to active galactic nuclei
lists a number of references with the conventions adopted by the (Stalevski et al. 2012, 2016), molecular clouds (Hendrix et al.
authors. 2015), and binary systems (Deschamps et al. 2015; Hendrix et al.
Assuming that the adopted conventions are properly docu- 2016).
mented, translating the values of the Stokes parameters from one Employing the MCRT technique, SKIRT represents electro-
convention into another is straightforward – by flipping the signs magnetic radiation as a sequence of discrete photon packages.
appropriately. When comparing or mixing formulas and recipes Each photon package carries a specific amount of energy (lu-
minosity) at a given wavelength. A SKIRT simulation follows
2
http://iau.org/static/archives/announcements/pdf/ann16004a.pdf the individual paths of many photon packages as they propagate
3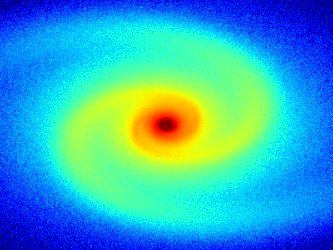
C. Peest et al.: Polarization in RT simulations

                                                                        propagation direction, k, and the reference direction, d, which
                                       n                                are perpendicular to each other as well, so that
                   nnew
                                                                                         n= k×d            and        d = n × k,           (14)
                             ϕ
                                                                        assuming all three vectors are unit vectors. By definition, the
                                                                        scattering plane contains both the incoming and outgoing prop-
                                                 knew                   agation directions k and knew . Consider the situation before the
                                   θ                                    event (also, see Fig. 2). If the reference direction d, which is
                                                                        always perpendicular to k, lies in the scattering plane as well,
                                                                        then n corresponds to the normal of the scattering plane. A sim-
                                                                        ilar situation applies after the scattering event. We store n rather
                                                                        than d with each photon package, and our procedures below are
                               k                                        described in terms of n.
                                                                             Some authors (e.g., Chandrasekhar 1950; Code & Whitney
                                                                        1995; Gordon et al. 2001) choose to rotate the Stokes reference
                                                                        direction in between scattering events into the meridional plane
Fig. 2. Geometry of a scattering event. The angle θ is between the      of the coordinate system. Their procedure uses two rotation op-
incoming and outgoing propagation directions k and knew . The           erations for each scattering event, one before and one after the
angle ϕ is given by the normals of the previous and the present         event, and requires special care to avoid numerical instabilities
scattering planes n and nnew .                                          when the propagation direction is close to the z-axis. The latter
                                                                        occurs because the meridional plane is then ill defined.
                                                                             We leave the reference direction unchanged after a scattering
through the dusty medium. The photon package life cycle is gov-         event and instead perform a single rotation as part of the next
erned by various events determined stochastically by drawing            scattering event. This method is also applied by Fischer et al.
random numbers from the appropriate probability distributions.          (1994) and Goosmann & Gaskell (2007) and illustrated in Fig. 2.
A photon package is created at a random position based on the           The current scattering plane (red) includes the incoming and out-
luminosities of the sources and is emitted in a random direction        going propagation directions k and knew , defining the scattering
depending on the (an)isotropy of the selected source. Depending         angle θ. After the previous scattering event, the reference direc-
on the dust material properties and spatial distribution, the pho-      tion has been left in the previous scattering plane (blue), so the
ton package then undergoes a number of scattering events at ran-        angle between the normals n and nnew to the previous and the
dom locations (using forced scattering; see Cashwell & Everett          current scattering planes determines the angle ϕ over which the
1959), and is attenuated by absorption along its path (using con-       Stokes vector must be rotated to end up in the current scattering
tinuous absorption; see Lucy 1999; Niccolini et al. 2003).              plane. The transformation of the Stokes vector given in Eq. (9)
    To boost the efficiency of the simulation and reduce the            can therefore be simplified to
noise levels at the simulated observers, SKIRT employs the com-
mon peel-off optimization technique (Yusef-Zadeh et al. 1984).                                   Snew = M(θ, λ) R(ϕ) S.                    (15)
Rather than waiting until a photon package happens to leave the
system under study in the direction of one of the observers, a              Care must be taken to properly set a reference normal n for
special photon package is peeled off in the direction of each           newly emitted photon packages that have not yet experienced a
observer at each emission and scattering event, including an            scattering event. Because we assume our sources to emit unpo-
appropriate luminosity bias for the probability that a photon           larized radiation, we can pick any direction perpendicular to the
package would indeed be emitted or scattered in that direction.         propagation direction. We postpone the details and justification
Meanwhile, the original or main photon package continues its            for this procedure to Sect. 3.7.
trajectory through the dust until its luminosity has become neg-
ligible and the package is discarded.                                   3.3. Scattering phase function
    For the purposes of this paper, we assume that a newly emit-
ted photon package represents unpolarized radiation, and its po-        The probability that a photon package leaves a scattering event
larization state is not affected by the attenuation along its path      along a particular direction knew for an incoming direction k is
through the dusty medium. We assume that the photon package             given by the phase function, Φ(k, knew ) ≡ Φ(θ, ϕ), where θ and
is scattered by spherical dust grains (which does affect the po-        ϕ represent the inclination and azimuthal angles of knew relative
larization state). This leaves us with three types of events: scat-     to k, and where we omit the wavelength dependency from the
tering the main photon package into a new direction, peeling off        notation. In the formulation of Sect. 2, we can say that the phase
a special photon package toward a given observer, and detecting         function is proportional to the ratio of the beam intensities, I and
a peel-off photon package at an observer. As a first step toward        Inew , before and after the scattering event,
describing the procedures for each of these events, we discuss
                                                                                                              Inew (θ, ϕ)
our approach for handling the Stokes vector reference direction.                                  Φ(θ, ϕ) ∝               .                (16)
                                                                                                                   I

3.2. Reference direction                                                For spherical grains, combining Eqs. (7), (10), and (15) leads to

As noted in Sect. 2, the Stokes vector describing the polarization                 Inew (θ, ϕ) = IS 11 + S 12 (Q cos 2ϕ + U sin 2ϕ)        (17)
state of a photon package is defined relative to a given reference
                                                                        and therefore,
direction, d, in the plane perpendicular to the propagation di-
rection. We define a new direction, n, perpendicular to both the                                           Q                 U
                                                                                   Φ(θ, ϕ) ∝ S 11 + S 12          cos 2ϕ +      sin 2ϕ .   (18)
                                                                                                              I               I

4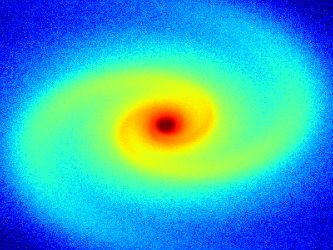
C. Peest et al.: Polarization in RT simulations

Using Equation (5) and introducing a proportionality factor, N,         use Euler’s finite rotation formula (Cheng & Gupta 1989) to ro-
we can write                                                            tate a vector v about an arbitrary axis a over a given angle β
                                                  !                     (clockwise while looking along a),
                                 S 12
         Φ(θ, ϕ) = N S 11 1 + PL      cos 2(ϕ − γ) .       (19)
                                 S 11                                         vnew = v cos β + (a × v) sin β + a(a · v)(1 − cos β).     (28)
The proportionality factor is determined by normalizing the             The last term of the right-hand side vanishes when the vector v
phase function (a probability distribution) to unity. Integration       is perpendicular to the rotation axis a.
over the unit sphere yields                                                 In our configuration, the reference normal n rotates about
                                                                        the incoming propagation direction k over the azimuthal angle
                                   1                                    ϕ. Because n is perpendicular to k, we have
     N = R 2π R π                                              (20)
               (S 11 + PL S 12 cos 2(ϕ − γ)) sin θ dθ dϕ
          0  0                                                                             nnew = n cos ϕ + (k × n) sin ϕ.              (29)
                1
       =    Rπ              .                                  (21)     Furthermore, the propagation direction rotates in the current
         2π 0 S 11 sin θ dθ
                                                                        scattering plane, that is, about nnew , over the scattering angle θ.
                                                                        Again, k is perpendicular to nnew , so that
3.4. Sampling the phase function
                                                                                          knew = k cos θ + (nnew × k) sin θ.            (30)
After scattering, a new direction of the photon package is de-
termined by sampling random values for θ and ϕ from the
phase function Φ(θ, ϕ). To accomplish this, we use the condi-           3.6. Peel-off photon package
tional probability technique. We reduce the phase function to the       As described in Sect. 3.1, a common MCRT optimization is to
marginal distribution Φ(θ),                                             send a peel-off photon package toward every observer from each
          Z 2π                                                          scattering site. The peel-off photon package must carry the polar-
                                                S 11
   Φ(θ) =      Φ(θ, ϕ) dϕ = 2π N S 11 = R π                  . (22)     ization state after the peel-off scattering event, and its luminosity
            0
                                          0
                                            S 11 sin θ 0 dθ0            must be weighted by the probability that a scattering event would
                                                                        indeed send the outgoing photon package toward the observer.
We sample a random θ value from this distribution through nu-           To obtain this information, we need to calculate the scattering
merical inversion, that is to say, by solving the equation              angles θobs and ϕobs , given the outgoing direction of the peel-off
                             Rθ                                         scattering event, or in other words, the direction toward the ob-
                                S 11 sin θ0 dθ0                         server, kobs . This is effectively the scattering problem in reverse,
                      X = R0π                              (23)         in which random angles were chosen based on their probabil-
                                S 11 sin θ0 dθ0
                              0                                         ity, and the new propagation direction was calculated from these
for θ, where X is a uniform deviate, that is, a random number           angles.
between 0 and 1 with uniform distribution.                                   Finally, when the peel-off photon package reaches the ob-
    Once we have selected a random scattering angle θ, we sam-          server, its Stokes reference direction must be rotated so that it
ple a random azimuthal angle ϕ from the normalized conditional          lines up with the direction of north in the observer frame, kN ,
distribution,                                                           according to the IAU (1974) conventions. The scattering angle
                                                                        θobs is easily found through the scalar product of the incoming
                             Φ(θ, ϕ)                                    and outgoing directions,
             Φθ (ϕ) = R 2π                                     (24)
                       0
                             Φ(θ, ϕ0 ) dϕ0                                                          cos θobs = k · kobs .               (31)
                                                 !
                       1        S 12
                    =    1 + PL      cos 2(ϕ − γ) ,            (25)     Because 0 ≤ θobs ≤ π, the cosine unambiguously determines the
                      2π        S 11                                    angle.
where the ratio S 12 /S 11 depends on θ. This can again be done              To derive the azimuthal angle ϕobs , we recall (Fig. 2) that it
through numerical inversion, by solving the equation                    is the angle between the normal to the previous scattering plane,
                                                                        n, and the normal to the peel-off scattering plane, nobs . The latter
                 Z ϕ
                                                                        can be obtained through the cross product of the incoming and
            X=         Φθ (ϕ0 ) dϕ0                         (26)        outgoing directions,
                   0
                                                        !
                  1              S 12                                                                          k × kobs
               =       ϕ + PL         sin ϕ cos(ϕ − 2γ)     (27)                                    nobs =                 .            (32)
                 2π              S 11                                                                        ||k × kobs ||
for ϕ, with X being a new uniform deviate.                              We need both cosine and sine to unambiguously determine ϕobs
                                                                        in its 2π range. We easily have
3.5. Updating the photon package                                                                    cos ϕobs = n · nobs .               (33)
After randomly selecting both angles θ and ϕ, we can use                Because k is perpendicular to both n and nobs , the following re-
Eq. (15) to adjust the main photon package’s Stokes vector. We          lation holds,
can also calculate the outgoing propagation direction knew and                              sin ϕobs k = n × nobs ,                 (34)
the new reference normal nnew from the incoming propagation
direction k and the previous reference normal n (see Fig. 2). We        or, after projecting both sides of the equation on k,
                                                                                                 sin ϕobs = (n × nobs ) · k.            (35)

                                                                                                                                           5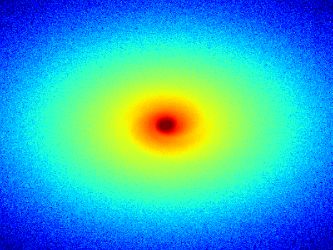
C. Peest et al.: Polarization in RT simulations

This derivation of ϕobs breaks down for a photon package that                        y                                     slab
                                                                                                             (0,1,0)
happens to be lined up with the direction toward the observer
before the peel-off event. Indeed, in this special case of perfect                                   TC2                          θ
forward or backward peel-off scattering, Eq. (32) is undefined.                                x    source
However, because the scattering plane does not change, it is jus-                z                                           ℓ
tified to simply set ϕobs = 0 instead.                                                                                            ℓ    θ
     We insert the calculated θobs and ϕobs values into Eq. (15) to                      (-1,0,0)
adjust the peel-off photon packages Stokes vector, and we also
update the reference normal to nobs . When the photon package’s                                     TC3/4
                                                                                     slab           source        TC1                 (1,0,0)
polarization state is recorded at the observer, its Stokes vector                                                source
reference direction must be parallel to the north direction, kN , in                                     ℓ
the observer frame. This is equivalent to orienting the reference
normal along the east direction, kE = kobs × kN . The angle, αobs ,                                 θ
between nobs and kE can be determined using a similar reasoning
as for ϕobs , so that                                                                                                  (0,-1,0)

                        cos αobs = nobs · kE                      (36)
and                                                                                                                                             2
                    sin αobs = (nobs × kE ) · kobs .

                                                                                                                                                    Flux [arb. unit]
                                                                  (37)
                                                                                                                                                1
The final adjustment to the Stokes vector is thus a rotation (see
Eqs. 6 and 7) with the matrix R(αobs ). The Stokes vector is indif-                                                                             0
ferent to rotations by π. Using kW = −kE yields the same result.

3.7. Reference direction for new photon packages                           Fig. 3. Top: Geometry used in the analytical test cases. The z-
We now return to the issue of selecting a reference direction,             axis is toward the reader. For test case 1, a central point source
or more precisely, a reference normal, for newly emitted photon            illuminates thin slabs of electrons that are slanted by 45◦ toward
packages. We stated at the end of Sect. 3.2 that we can pick any           the observer. The central source is replaced by a small blob of
direction perpendicular to the propagation direction, because we           electrons for the other test cases. The blob is illuminated by a
assume our sources to emit unpolarized radiation. Indeed, it is            collimated beam from within the xy plane for test case 2 and
easily seen from Eq. (25) that the probability distribution for the        from below the xy plane for test cases 3 and 4. Bottom: Intensity
azimuthal angle ϕ becomes uniform for unpolarized incoming                 map of test case 1 as seen from the observer.
radiation, that is, with PL,in = 0. Consequently, our choice of
reference normal in the plane perpendicular to the propagation             rotated by 45◦ relative to the line of sight and are spatially re-
direction will be completely randomized after the application of           solved by the observer’s instrument. To simplify the calculations
the scattering transformation (Eq. (15)).                                  we only consider radiation detected close to the xy plane, es-
    We determine the reference normal, n = (n x , ny , nz ), perpen-       sentially reducing the geometry to two dimensions. Because of
dicular to the propagation direction, k = (k x , ky , kz ), using          the low scattering probability in the slabs, the path with the least
                                    q                                     number of scattering events will greatly dominate the polariza-
                       n x = −k x kz 1 − kz2                      (38)     tion state at each instrument position. This allows us to deduce
                                    q                                     the dominating scattering angle, θ, corresponding to each instru-
                       ny = −ky kz 1 − kz2                        (39)     ment position along the x-axis. Referring to Fig. 3, geometrical
                            q                                              reasoning leads to
                       nz = 1 − kz2 .                             (40)
                                                                                                    π
                                                                                                                        !
                                                                                                                  1
                                                                                                θ = ± arctan         −1 ,                  (41)
When k is very closely aligned with the Z-axis, the root in these                                   2            |x|
equations vanishes, and we instead select n = (1, 0, 0) as the
reference direction.                                                       with the plus sign for x > 0 and the minus sign for x < 0. In com-
                                                                           bination with analytical scattering properties for the slab mate-
                                                                           rial, it then becomes possible to derive a closed-form expression
4. Validation                                                              for the components of the Stokes vector at each position.
                                                                                Because the observer is considered to be at ‘infinite’ dis-
4.1. Test setup                                                            tance, we can use parallel projection, and the distance from the
In order to confirm the validity of our method and its implemen-           slabs to the observer does not vary with x. However, we do need
tation in SKIRT, we develop four test cases for which the results          to take into account the variations in the path length ` from the
can be calculated analytically. The analytical results are obtained        central source to the slabs because it affects the amount of radia-
solely using the formalisms of Sect. 2, so that taken together,            tion arriving at the slabs as a function of x. Geometrical reason-
the test cases verify most aspects of the procedures presented in          ing in Fig. 3 again leads to
Sect. 3.                                                                                               p
    The overall setup for the test cases is illustrated in Fig. 3.                                 ` = x2 + (1 − |x|)2 .                  (42)
A central source illuminates two physically and optically thin
slabs of material, which scatter part of the radiation to a dis-               The scattering properties of the slabs and the makeup of
tant observer. The slabs are arranged on the sides of a square             the central source vary between the test cases. For test cases

6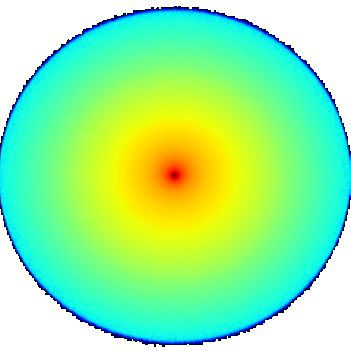
C. Peest et al.: Polarization in RT simulations

                 Intensity (arb. units)       2                                    1.5                                       1.0

                                                                                   1.0
                                              1                                                                              0.5
                                                                                   0.5

                                              0                                    0.0                                       0.0
                                           0.05                                   0.05                                      0.05
                                          −0.05                                  −0.05                                  −0.05
                                                                     ±5%rel.                                ±5%rel.                                  ±5%rel.

                                            100                                   100                                        100
          Linear polarization

                                             80                                    80                                         80
                                             60                                    60                                         60
              degree (%)

                                             40                                    40                                         40
                                             20                                    20                                         20
                                              0                                     0                                          0
                                           0.05                                   0.2                                        0.5
                                                                                  0.0                                       −0.5
                                          −0.05                                  −0.2
                                                                     ±0.1%rel.                              ±0.2%rel.       −1.5                     ±1%rel.

                                           0.03                                   0.03                                       180
                                                                                                                             160
        Polarization angle

                                           0.02                                   0.02                                       140
          from north (◦ )

                                           0.01                                   0.01                                       120
                                                                                                                             100
                                           0.00                                   0.00                                        80
                                          −0.01                                  −0.01                                        60
                                                                                                                               1
                                          −0.02                                  −0.02                                       −1
                                                                                                                                                     ±0.5%rel.
                                          −0.03                                  −0.03
                                              −1.0    −0.5 0.0       0.5       1.0   −1.0    −0.5 0.0       0.5       1.0     −1.0    −0.5 0.0       0.5       1.0
                                                     Test case 1: x extent                  Test case 2: x extent                    Test case 3: x extent

Fig. 4. Intensity (top row), linear polarization degree (middle row), and polarization angle (bottom row) of the observed radiation
in test cases 1 through 3 (left to right columns). The top section in each panel shows the analytical solution (black) and the model
results (dashed orange). The bottom section in each panel shows the absolute differences (blue) and relative differences (shaded
area) of the analytic solution and the model. The green lines are calculated using twice the resolution of the θ scattering angle.

1 through 3, the slabs contain electrons, with scattering ma-                                         tor in the observer plane has a resolution of 201 pixels along the
trix MTh given by Eq. (11). We study the observed intensity,                                          x-axis. We use 1010 photon packages for each test case to min-
I, the degree of linear polarization, PL , and the linear polariza-                                   imize the stochastic noise characteristic of Monte Carlo codes.
tion angle, γ, of these test cases in Sect. 4.2. Scattering by elec-                                  SKIRT uses precomputed tables of various quantities with a res-
trons never causes circular polarization. Therefore in Sect. 4.3                                      olution of 1◦ in θ and ϕ, to help perform the numerical inversions
we introduce slabs that contain synthetic particles with custom-                                      in Eqs. (23) and (27).
designed scattering properties (test case 4). This allows us to
study the observed circular polarization.
                                                                                                      4.2. Linear polarization
     Test case 1 has a central point source. For the remaining test
cases, the central source is replaced by a small blob of electrons                                    Test case 1 is designed to test the peel-off procedure described
illuminated by a collimated beam positioned at varying angles,                                        in Sect. 3.6. The slabs contain electrons, and the central point
so that the center becomes the site of first scattering.                                              source emits unpolarized photon packages. When a photon pack-
     A numerical implementation of the test cases will always dis-                                    age’s direction is toward one of the slabs, the forced interaction
cretize certain aspects of the theoretical test setup. For our imple-                                 algorithm of SKIRT initiates a scattering event at the slab and a
mentation in SKIRT, we made the following choices. The spatial                                        peel-off photon package is sent toward the observer. Because the
domain of the setup is divided into 601 × 601 × 61 cuboidal grid                                      slabs are optically thin, the luminosity of the scattered original
cells lined up with the coordinate axes (we use odd numbers to                                        photon package is small. It is subsequently deleted and a new
ensure that the origin lies in the center of a cell). The cells over-                                 photon package is launched.
lapping the slabs (and where applicable, the central blob) con-                                           As a result, the Stokes vector of the observed photon pack-
tain electrons, the other cells represent empty space. The edges                                      ages can be written as
of the cells and slabs are not aligned. Each detector pixel pro-                                                                  π
vides averages over multiple cells, and the slabs are optically                                                     STC1 = `−2 R       MTh (θ) (1, 0, 0, 0)T ,      (43)
thin (τ = 10−3 along their depth). The length of the slabs is                                                                      2
1.141, their depth is 0.006, and their height is 2×10⁻⁵ . The detec-                                  reflecting from right to left a scattering transformation starting
                                                                                                      from an unpolarized state (and thus ϕ = 0), a rotation to align

                                                                                                                                                                      7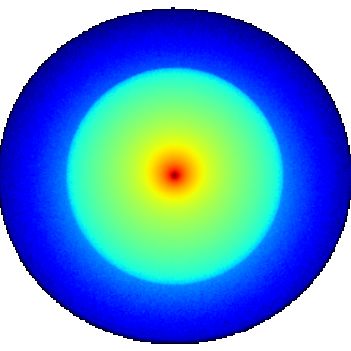
C. Peest et al.: Polarization in RT simulations
(arb. units) vector of the observed photon packages can thus be written as
1
z extent
π
0
STC2 = `−2 R MTh (θ) MTh (θ1 ) (1, 0, 0, 0)T . (47)
−1 2
+30.0%
10−3 10−2 Flux (Jy) The intensity and linear polarization degree for test case 2 are
30
12x4 − 28|x|3 + 29x2 − 14|x| + 3
I TC2 = ,
Circular polarization V /I (%)
20 (48)
4(2x2 − 2|x| + 1)3
10
4x4 − 4|x|3 + 3x2 − 2|x| + 1
0 PTC2 = . (49)
L
12x4 − 28|x|3 + 29x2 − 14|x| + 3
−10
The orientation of the polarization is north/south.
0.6 In the third test√case we move √ the collimated source below
0.2 the xy-plane to (− 3, −1, −4 − 2 3), so that we can test the
−0.2
rotation of the Stokes vector reference direction between scat-
tering events. The source is now placed at an inclination of 165◦
−0.6 (relative to the z-axis) and an azimuthal angle of 30◦ (clockwise
±2%rel.
from the x-axis). It still points toward the central electron blob,
−1.0 −0.5 0.0 0.5 1.0
that is, toward the top right and out of the page in Fig. 3. As a
x extent (arb. units)
result, the normal of the first scattering plane is tilted, while the
normal of the peel-off scattering plane remains aligned with the
Fig. 5. Fraction of circular polarization, V/I, of the observed ra- z-axis. With some trigonometry, we arrive at expressions for the
diation in test case 4. The top panel shows the observed surface angles involved in the first (main) and second (peel-off) scatter-
brightness overlaid with arrows indicating the handedness. The ing events,
arrow length scales linearly with the magnitude. The middle and
bottom panels compare the analytical solution with the model
√ √
−1 + 3 + (4 − 2 3)|x|
results, as in Fig. 4. θ1 = arccos ± , (50)
4 2 − 4|x| + 4x2
p
√ p
2(1 + 3) 1 − 2|x| + 2x2
the reference direction with the observer frame, and the depen- ϕ1 = ± arctan √ , (51)
dency on the path length from the source to the slab. We can 3 − 3 − 2|x|
now substitute Eqs. (7), (11), (41), and (42) into this equation. θ2 = π/2 ± arctan(1/|x| − 1), (52)
Because the arctangent of Eq. (41) is used as an argument for
ϕ2 = π/2, (53)
the cosine in Eq. (11), the final equations for the intensity and
the linear polarization degree reduce to polynomials, with the plus sign for x > 0 and the minus sign for x < 0. The
expression provided in Eq. (51) for ϕ1 is simplified and shifted
3x − 4|x| + 2
2
I TC1 = , (44) by ±π for some x. The Stokes vector is invariant under rotations
2(2x2 − 2|x| + 1)2 by π.
x2 The Stokes vector of the observed photon packages can now
PTC1 = 2 . (45) be written as
L
3x − 4|x| + 2
The orientation of the polarization is perpendicular to the scatter- STC3 = `−2 R(ϕ2 ) MTh (θ2 ) R(ϕ1 ) MTh (θ1 ) (1, 0, 0, 0)T . (54)
ing plane, that is, north/south or along the y-axis in the observer
frame. To limit the complexity of presentation, we provide expressions
In test case 2 we add a scattering event to verify part of the for the Stokes parameters from which the linear polarization de-
procedures for scattering the main photon package. To this end, gree and angle can be calculated using Eqs. (3) and (4),
we replace the central point source with a small blob of electrons 1 h √ √
at the same location, and illuminate this electron blob with a I TC3 = 6
(62 − 16 3)x4 − (150 − 30 3)|x|3
collimated beam positioned at (−1, 1, 0) and oriented parallel to 32` (55)
√ √ √ i
the slabs toward the bottom right (see Fig. 3). In this setup, a +(156 − 25 3)x2 − (78 − 8 3)|x| + 18 − 3 ,
photon package emitted by the collimated source can reach the 1 h √ √
slabs only after being scattered by the electrons in the central QTC3 = (2 − 16 3)x4 + (22 + 34 3)|x|3
32`6 (56)
blob. This effectively adds a forced first scattering event to all √ √ √ i
photon packages reaching the observer, with a scattering angle −(28 + 39 3)x2 + (14 + 24 3)|x| − (2 + 7 3) ,
that can be deduced from the geometry. The peel-off scattering 1 h √ √ √ i
angle is still given by Eq. (41). The scattering angle for the first U TC3 = 4 (1 + 3)x2 − (1 + 2 3)|x| + 3 , (57)
8`
scattering event in the central electron blob is
V TC3 = 0. (58)
π
θ1 = θ ± − , (46) Figure 4 compares the analytical solutions and SKIRT re-
4
sults for the observed intensity, linear polarization degree, and
again with the plus sign for x > 0 and the minus sign for x < 0. polarization angle for these three test cases. The intensity curves
Because all components of the setup are in the same plane, the show a relative noise level of on average about 3%. The linear
scattering plane is always the same (the xy-plane). The Stokes polarization degrees are identical to below 0.1% absolute for test
8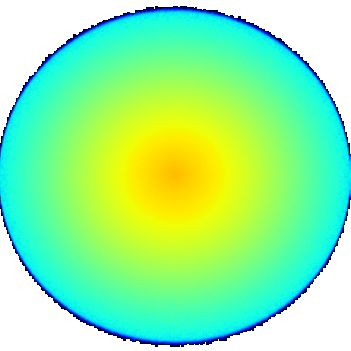
C. Peest et al.: Polarization in RT simulations
cases 1 and 2 and below 1% absolute for test case 3. The polar- the observed photon packages become
ization angles from north are correct to below 0.05◦ for test cases
1 and 2 and below 1◦ for test case 3. While the linear polariza- I TC4 =I TC3 , (60)
tion degree and position angle can be determined from a simula- Q TC4
=Q ,
TC3
(61)
tion with relatively few photon packages, reducing the noise in √ √
±1 h
the intensity requires significantly more photon packages. This U TC4 = 5 (1 + 3)|x|3 − (2 + 3 3)x2
is because the number of photon packages arriving at each pixel 8` (62)
√ √ i
is subject to Poisson noise, whereas the path that each photon +(1 + 3 3)|x| − 3 ,
package takes to the same pixel is defined within tight bound- 1 h √ √ √ i
aries. The intensity curve depends on the number of photons. V TC4 = 5 −(1 + 3)|x|3 + (1 + 2 3)x2 − 3|x| . (63)
The linear polarization degree and angle are independent of the 8`
number of photon packages. Their noise is due to the size of the In Eq. (62) the plus sign is again for x > 0 and the minus sign
pixels. Slightly different paths and scattering angles might con- for x < 0.
tribute to the same pixel. Figure 5 shows the (relative) circular polarization, V/I, for
The polarization angle for test case 1 shows an intriguing this test case, again comparing the analytical solutions with the
spike near x = 0. As we can see in the linear polarization de- SKIRT results. The relative differences between the analytical
gree curve and from Eq. (45), the radiation arriving at x = 0 is and simulated results for |x| < 0.7 are below one percent. The
unpolarized. This implies that both the Q and U components of larger discrepancies for |x| > 0.7 are again due to the limited
the Stokes vector are zero and the polarization angle becomes resolution in the SKIRT calculations related to θ. The pale green
undefined (see Eq. 4). This in turn causes small numerical in- line again shows the residuals when calculating with 0.5◦ resolu-
accuracies in the calculations for photon packages arriving very tion and has a significantly smaller residual curve. Disregarding
close to x = 0. the outer part, the circular polarization is correct to 0.1% abso-
The relative differences for the other quantities are generally lute.
smaller than a fraction of a percent. In the results of test case 3
the residuals of the linear polarization degree and polarization
angle contain spikes that are resolved by multiple pixels each 5. Benchmark tests
and symmetric with respect to x = 0. The residual of the inten-
5.1. Disk galaxy
sity curve shows a similar effect. It tends to be lower than ex-
pected in the outer regions and higher than expected in the inner We compare results of our code to Bianchi et al. (1996) as a first
region. These orderly deviations indicate a systematic difference test of our implication of dust scattering polarization (rather than
rather than noise. In fact, these discrepancies are caused by res- just Thompson scattering). Bianchi and collaborators describe
olution effects in the SKIRT implementation of our method (see the polarization effects of scattering by spherical dust grains in
Sect. 4.1 for a description of our discretization choices). For ex- monochromatic MCRT simulations of 2D galaxy models at the
ample, consider the interval 0.6 < x < 0.7 for test case 3, which B band (0.44 µm) and I band (0.9 µm). The models include a
is resolved by 10 pixels along the x-axis of the detector in the stellar bulge, a stellar disk, and a dust disk. The stellar bulge
observer frame. The corresponding interval for scattering angle is described by Jaffe (1983) (scale radius 1.86 kpc, truncated at
θ1 (see Eq. 50) is 75.0◦ < θ1 < 75.1◦ , that is, only a fraction 14.8 kpc), and the stellar disk is a double-exponential disk (scale
of the 1◦ resolution in the SKIRT calculations related to θ. It is length 4 kpc, truncated at 24 kpc; scale height 0.35 kpc, trun-
obvious that this lack of angular resolution relative to the output cated at 2.1 kpc). The relative strength of the stellar components
resolution will cause inaccuracies. We calculated the residuals and the stellar sources is varied. In all models, the dust is as-
in the polarization degree and angle from north using twice the sumed to be homogeneously distributed in a double-exponential
θ resolution and show them in pale green in Fig. 4. They con- disk embedded in the stellar disk, with the same horizontal pa-
firm that increasing the θ resolution in the calculations indeed rameters as the stellar disk, but much thinner vertically (scale
reduces the discrepancies accordingly. height 0.14 kpc, truncated at 0.84 kpc). The central face-on opti-
cal depth of the dust disk τV is a free parameter. The properties
4.3. Circular polarization
of the dust are taken from the MRN dust model (Mathis et al.
1977), which includes graphite grains and astronomical silicates
To include circular polarization in test case 4, we use synthetic with a size distribution n(a) ∝ a−3.5 , 0.005 µm < a < 0.25 µm.
particles similar to electrons, but with a scattering matrix that Polycyclic aromatic hydrocarbons (PAHs) and very small grains
mixes the U and V components of the Stokes vector: are not included.
Figure 6 displays our results, which correspond to the
cos θ + 1 cos2 θ − 1
2
0 0 Bianchi et al. (1996) model shown in their Figure 8. We use
1 cos2 θ − 1 cos2 θ + 1
0 0
the same geometry, described above, and the same bulge-to-total
Msyn (θ) = .
2 0 0 2 cos2 θ −2 cos θ sin θ ratio (B/T=0.5), wavelength (λ = 0.44 µm), and optical depth
0 0 2 cos θ sin θ 2 cos2 θ (τV = 10). We use a different dust model. It includes a wider
(59) range of graphite and silicate grain sizes following the Zubko
We use the same geometry as for test case 3, replacing the elec- et al. (2004) size distribution, in addition to a small fraction of
trons in the two slabs and in the central blob by particles de- PAHs as described in Camps et al. (2015). The differences be-
scribed by Eq. (59). The angles are still described by Eqs. (50) tween the dust models do not affect the qualitative results at op-
through (53), Eq. (54) still holds, and the Stokes parameters of tical wavelengths, but do prevent a quantitative comparison.
Surface brightness maps (color scale) overlaid with a linear
polarization maps (line segments) are shown in Fig. 6. The in-
clinations range from nearly face-on (20◦ , left) to edge-on (90◦ ,
right). The top and middle rows show models from which the
9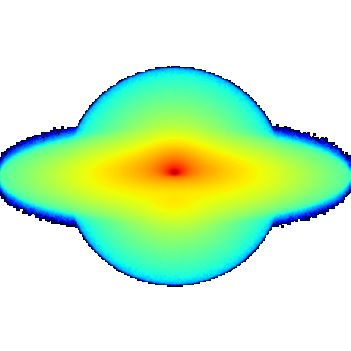
C. Peest et al.: Polarization in RT simulations
24
20 ◦ 75 ◦ 90 ◦
12
Extent (kpc)
0
100
−12
30% 30% 30% 10-1
−24
24
Surface brightness (arb. units)
20 ◦ 75 ◦ 90 ◦
10-2
12
Extent (kpc)
0 10-3
−12
10-4
−24 1% 1% 1%
24
20 ◦ 75 ◦ 90 ◦ 10-5
12
Extent (kpc)
10-6
0
−12
−24 1% 1% 1%
−24 −12 0 12 24 −24 −12 0 12 24 −24 −12 0 12 24
Extent (kpc) Extent (kpc) Extent (kpc)
Fig. 6. B-band surface brightness maps (color scale) overlaid with linear polarization maps (line segments) for inclinations of
20◦ (left), 75◦ (middle), and 90◦ (right column). The top row shows a model with only a stellar bulge, the middle row a model with
only a stellar disk, and the bottom row a model with both stellar bulge and disk with a ratio of bulge to total luminosity of B/T=0.5.
The dust disk is the same in the three cases and has a central face-on V-band optical depth of 10.
stellar disk and the stellar bulge, respectively, was removed. The 5.2. Dusty disk around star
bottom row shows the B/T=0.5 model, that is to say, the model
including both stellar bulge and stellar disk. The dust disk is To test the performance of our code on a problem of a different
identical for the three models. scale, we compute polarization results of Pinte et al. (2009). In
Overall, our results are compatible with those reported by it, a thick dusty disk surrounds a central star. The star extends
Bianchi et al. (1996). The largest polarization degrees are ob- out to 2 AU and has a temperature of 4000 K. The dust consists
served near the major axis. For pure disks, the face-on view of spherical grains with a radius of 1 µm, and the light has a
shows very little polarization. The polarization degree increases wavelength of 1 µm as well. The dust density distribution ρ is
with inclination to a maximum near an inclination of about 80◦ cylindrical,
and slightly decreases again when approaching 90◦ . The polar- !−5/2
1 z 2 R −9/4
! !
3Σ0 R
ization degree averaged over all pixels is below 1% for all in- ρ(R, z) = exp − , (64)
clinations. For pure bulges, the maximum polarization degree is 2R0 R0 2 h0 R0
largely independent of the inclination. In the outer regions of the
dust disk, the linear polarization degree is 22%. In the mixed with a surface density Σ0 , scale radius R0 = 100 AU, radial dis-
B/T=0.5 model, the polarization degrees are drastically reduced. tance from the center R, vertical distance from the midplane z,
We find values up to 1.6%, comparable to the results of Bianchi and scale height h0 = 10 AU. The disk is truncated at Rmin =
et al. (1996), who find 1 to 1.5%. 0.1 AU and Rmax = 400 AU. The surface density depends on the
We also test the corresponding model for the I band (λ = total dust mass m = 3 × 10−5 M by
0.9 µm) with a color-adjusted bulge luminosity (B − I = 1 mag), " #
12
again confirming overall agreement Bianchi et al. (1996). Σ0 = m/ (2π) h0 R0 (Rmin /R0 ) − (Rmax /R0 )
3/2 5/8 5/8
(65)
5
and the albedo of the dust is 0.6475 and the opacity 4752 cm2 /g
at 1 µm. We adopt the scattering matrix as provided by Pinte
10C. Peest et al.: Polarization in RT simulations
100%
1 2 3
80%
Polarization degree
60%
3 1 40%
20%
2 0%
0.10
0.05
i =69.5°
Difference
0.00
SKIRT
Pinball 0.05
MCMax
MCFOST 0.10
100%
TORUS 4 5 6
80%
Polarization degree
60%
6 40%
4 20%
5 0%
0.10
0.05
Difference
i =87.1° 0.00
0.05
0% 25% 50% 75% 100%
Polarization degree 0.10
400 200 0 200 400 400 200 0 200 400 400 200 0 200 400
Extent [AU] Extent [AU] Extent [AU]
Fig. 7. Polarization degree maps for two inclinations of a disk with high optical density (τ = 106 ). On the left are the linear
polarization degree maps we calculated using SKIRT. The dust grain size is the same as the wavelength (1 µm), creating the intricate
pattern of the polarization degree. On the right are cuts 1–6 through the maps along with results of various codes. Pinball (Watson &
Henney 2001) in green, MCMax (Min et al. 2009) in black, MCFOST (Pinte et al. 2006) in blue, TORUS (Harries 2000) in dashed
orange, and SKIRT in red. The data of the other codes were taken from the official website.
et al. (2009).3 The system is resolved at a distance of 140 pc by code (Harries 2000) is not included in calculating the averages
a detector with 251 × 251 pixels covering 900 × 900 AU2 . because its signal-to-noise ratio is too low. In the central area the
Figure 7 shows the linear polarization maps calculated by codes agree within 10% of absolute polarization, but as the true
our code for inclinations of 69.5◦ and 87.1◦ . The flux difference result is unknown, a quantitative analysis of the results of this
from the borders to the center area is about 17 orders of mag- benchmark is difficult. In general, the results of the SKIRT code
nitude. The maps are displayed in gray outside the truncation are close to the average result, and SKIRT seems to agree par-
radius, where no flux was recorded. The intricate pattern of the ticularly well with the Pinball code (Watson & Henney 2001).
polarization degree is a result of the uniform grain radius being Pinball employs some of the same optimization techniques that
equal to the wavelength. The phase function therefore contains SKIRT uses (e.g., forced interaction and peel-off, named “forced
resonances and steep gradients for small changes of the scat- escape” in their paper).
tering angle. We compare our results to the results of the four
polarization capable codes in Pinte et al. (2009) along six cuts
through the maps. The first and third row show the polarization 6. Application: spiral galaxy models
degree along the cuts, and the second and fourth row show the We study the polarization properties of a 3D galaxy model in-
difference of the codes to the average of all results. The TORUS cluding spiral arms to investigate how the spiral arm structure is
3
http://ipag.osug.fr/ pintec/benchmark/
imprinted in the polarization structure. We also study this in the
11C. Peest et al.: Polarization in RT simulations
10
5
Face-on view (kpc)
102
0
−5
−10
2% 2% 2%
8
Inclined view (kpc)
4 101
Surface brightness (MJy/sr)
0
−4
−8
2% 2% 2%
6
Edge-on view (kpc)
3
0 100
−3
−6 2% 2% 2%
0.7
Edge-on polarization degree (%)
0.6
0.5
0.4
0.3 10-1
0.2
0.1
0.0
−10 −5 0 5 10 −10 −5 0 5 10 −10 −5 0 5 10
Dusty spiral: x extent (kpc) Rotated dusty spiral: x extent (kpc) Stellar Disk: x extent (kpc)
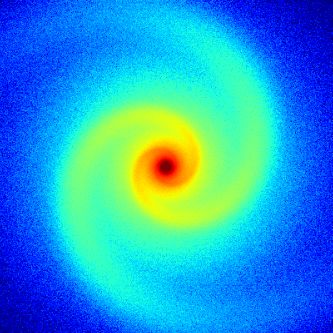
Fig. 8. Spiral galaxy model described in Sect. 6 and Table 2 observed at a wavelength of 1 µm. Rows from top to bottom: face-on,
inclined (53◦ ), and edge-on surface brightness (color scale) overlaid with linear polarization degree and orientation (line segments);
linear polarization degree of the edge-on view, averaged over the vertical axis. Columns from left to right: the reference model; the
same model observed from a different azimuth angle (rotated clockwise by 120◦ ); a model without the spiral arm perturbations in
the stellar disks, with the rotated orientation.
edge-on view when the structure is not easily characterized from population and in the dust disk by varying the spiral arm phase
the intensity alone. zero-points. The emission of the stellar populations is modeled
We still assume a homogeneous distribution for the stellar as blackbody spectra at the indicated temperatures. We use the
sources and the dust. The model includes a stellar bulge and dust model of Sect. 5.1 (Camps et al. 2015). The total dust mass
disk with an older star population, a second stellar disk with a is given in Table 2, the central face-on B-band optical depth of
younger star population, and a dust disk. The relevant parameters the dust disk is τV ≈ 1.3.
are listed in Table 2. The bulge is modeled by a spheroidal den- Figure 8 shows surface brightness maps (color scale) over-
sity distribution obtained by flattening a spherical Sérsic profile laid with linear polarization maps (line segments). The leftmost
(Sérsic 1963), as implemented by Baes & Camps (2015). The column is for this model at 1 µm. The top row shows the model
distributions of the two stellar and the dust disks are truncated face-on, the second row inclined (53◦ ), and the third row edge-
double-exponential disks. The spiral arm structure is introduced on. The polarization degree is up to 1% around the central part
by adding a perturbation to the overall density profile, as pre- of the models and over the whole map the average polariza-
sented by Baes & Camps (2015). We have made the spiral arms tion degree is similar to the average polarization degree from the
in the older stellar population ‘lead’ those in the younger stellar B/T=0.5 model from before. As in the B/T=0.5 model, the ori-
12C. Peest et al.: Polarization in RT simulations
Table 2. Parameters for our spiral galaxy model, including the
blackbody temperature and the bolometric luminosity of the stel-
lar components, and the total dust mass in the dust component.
Sérsic profile Bulge
Sérsic index 3
Effective radius 1.6 kpc
Flattening parameter 0.6
Temperature 3500 K
Luminosity 3 × 10¹⁰ L
Exponential disks Old stars Young stars Dust
Scale length 4 kpc 4 kpc 4 kpc
Horizontal cutoff 20 kpc 20 kpc 20 kpc
Scale height 0.35 kpc 0.2 kpc 0.2 kpc
Vertical cutoff 1.75 kpc 1 kpc 1 kpc
Number of arms 2 2 2
Pitch angle 20◦ 20◦ 20◦
Radius zero-point 4 kpc 4 kpc 4 kpc
Phase zero-point 0◦ 20◦ 20◦
Perturbation weight 0.25 0.75 0.75
Arm-interarm size ratio 5 5 5
Temperature 3500 K 10000 K
Fig. 9. Linear polarization degree, averaged over the vertical Luminosity / mass 4 × 10¹⁰ L 1 × 10¹⁰ L 2 × 10⁷ M
axis, of the rotated model (column B of Fig. 8) observed at 1 µm,
for inclinations ranging from edge-on (i=90◦ ) to face-on (i=0◦ ).
edge-on view, averaged over the vertical axis. This average is
obtained by summing each individual component of the Stokes
vector and calculating the polarization degree from these totals.
Regions with higher linear polarization (up to 2%) clearly trace
the spiral arms and are prominent at all inclinations, including
the edge-on view. The maxima in the polarization signature of
the edge-on view match the positions of the spiral arms along
the line of sight.
To verify this, the middle column of Fig. 8 shows the same
model from a different azimuth angle. The peaks in the polar-
ization signature align with the tangent points of the spiral arms,
which are now farther out from the center of the galaxy.
In the rightmost column of Fig. 8 we remove the spiral arms
perturbations from the stellar disks in the model. The polariza-
tion signature remains essentially unchanged; the maxima are
slightly higher (by a factor of up to 1.2), but the structure is
the same. The signature could also be produced by the different
phase zero-points of the old stars and the dust (see Table 2). We
calculated results using the same phase zero-point for all compo-
nents (not shown here). The outer maxima are lower (by a factor
Fig. 10. Averaged linear polarization degree for one side of the of 0.8), while the inner maxima are unchanged. This confirms
edge-on view of the rotated model, observed at optical and near- that the polarization signature is created by the distribution of
infrared wavelengths from 0.28 µm to 2.84 µm. The red vertical the dust and not by the distribution of the sources.
bands correspond to the bands in Fig. 9 and trace the tangent In Fig. 9 we further study the effect of inclination on the ob-
points of the dust spiral arms. served polarization signature for the reference model. In the cen-
tral region (r . 2 kpc), the bulge emission masks most polariza-
tion at inclinations above 40◦ . Outside this region, however, the
entation of the polarization is circular around the central bulge, form of the curves is very similar for all inclinations. Although
and for the inclined view the polarization degree left and right the polarization degree generally decreases toward lower incli-
of the center increases, while it decreases behind and in front nations, the peaks remain at the spiral arm tangent points, and
of it. In contrast to the azimuthally uniform model, there is a the ratio between the maximum and minimum polarization de-
spiral structure in the polarization map. The linear polarization gree remains roughly stable at a factor of about 2.
degree is higher in the arm regions and disappears in the inter- In Fig. 10 we compare the edge-on polarization signature of
arm region. The maximum polarization degree is slightly inward our reference model for various optical and near-infrared wave-
from the regions of the arms with the highest flux. The panel lengths. The polarization peaks remain prominent over the wave-
in the bottom row plots the linear polarization degree for the length range 0.5 µm . λ . 2 µm. At shorter wavelengths the
general polarization degree is higher and the signature is re-
13You can also read