Policy recommendations - For eU sustainable mobility concepts based on ciVitas experience - Civitas.eu
←
→
Page content transcription
If your browser does not render page correctly, please read the page content below

policy
recommendations
For EU Sustainable Mobility Concepts
based on CIVITAS Experience
ISBN-978-80-86502-77-9

policy
recommendations
For EU Sustainable Mobility Concepts
based on CIVITAS Experience

About this publication
This publication presents the main findings arising from the evaluation of the CIVITAS
Plus Collaborative Projects (CPs), which ran from 2008-2012. It seeks to identify
factors that can boost the effectiveness and consistency of future strategies, thereby
securing greater sustainability in urban mobility patterns. Policy makers are provided
with contemporary facts for debating purposes, and a number of conclusions and
recommendations based on lessons learnt from CIVITAS Plus are put forward.
About CIVITAS POINTER

  Running from 2008 to 2013, CIVITAS POINTER was a 54-month grant-based project of
  the European Commission’s Directorate-General for Mobility andTransport (DG-MOVE),
  as part of the CIVITAS Initiative.

  Funded under the Seventh Framework Programme for Research and Technological
  Development, CIVITAS POINTER focused on the evaluation and monitoring of results
  and experiences from the 25 cities and five projects participating in CIVITAS Plus.

  Publishers
  ICLEI – Local Governments for Sustainability, Freiburg, Germany. Executive Director
  Wolfgang Teubner (responsible) / Centrum dopravního výzkumu, v.v.i. (Transport
  Research Center), Brno, Czech Republic. Director Karel Pospíšil (responsible)

  Authors
  Simone Bosetti, Caterina Di Bartolo, Patrizia Malgieri, Alessio Sitran (TRT Trasporti e
  Territorio, Italy), Hana Brůhová-Foltýnová, Radomíra Jordová, Petr Kurfürst, Danuše
  Smutková, (CDV Centrum dopravniho výzkumu, Czech Republic)

  Editor
  Ciara Leonard (ICLEI Europe)

  Layout
  Stephan Köhler (ICLEI Europe)

  Acknowledgement
  This publication is produced under the auspices of CIVITAS VANGUARD and CIVITAS
  POINTER, which are respectively support actions for coordination and dissemination and
  evaluation and monitoring funded through the EC’s Seventh Framework Programme
  for Research and Technological Development.

  Legal Notice
  The views expressed in this publication are the sole responsibility of the authors named
  and do not necessarily reflect the views of the European Commission or the support
  actions CIVITAS POINTER or CIVITAS VANGUARD

  Copyright
  All articles and images in this publication can be replicated and built upon. However,
  they must be attributed to the CIVITAS Initiative.

  Printed on Recystar paper.

policy recommendations
policy recommendations

Table of contents
1. Introduction . . . . . . . . . . . . . . . . . . . . . . . . . . . . . . . . . . . . . . . . . . . . . . . . . . . . . . . . . . . . . . . . . . . . . . . . . . . . . . 9
.......................................................................
1.1 Guiding questions 9
1.2 Chapter guide ........................................................................... 9
2. Mobility patterns in European cities: characteristics and perspectives. . . . . . . . . . . . . . . 10
2.1 Characteristics of transport demand ...................................................... 10
2.2 Transport sector impacts ................................................................. 12
2.2.1 Environmental and health impacts .................................................... 13
2.2.2 Social and economic impacts ......................................................... 15
2.3 Perspectives on future development ..................................................... 16
2.3.1 Demographic aspects ................................................................ 16
......................................................................
2.3.2 Spatial structure 17
2.3.3 Values and lifestyles................................................................... 17
3. The CIVITAS Initiative: promoting smart measures for sustainable urban mobility . . 19
3.1 A closer look at the CIVITAS Initiative ...................................................... 19
3.2 CIVITAS thematic categories .............................................................. 20
3.3 Exploring measures in CIVITAS Plus ....................................................... 21
4. Evaluating for policy development: the CIVITAS Plus experience. . . . . . . . . . . . . . . . . . . . . 23
4.1 Clean fuels and vehicles .................................................................. 24
4.1.1 Vehicle modification or replacement .................................................. 24
......................................................................
4.1.2 Alternative fuels 25
4.2 Collective passenger transport ........................................................... 26
4.2.1 Information, ticketing and tariffs ...................................................... 26
4.2.2 Accessibility, infrastructure and network measures ..................................... 27
4.2.3 Public transport fleet management ................................................... 28
4.3 Demand management strategies ......................................................... 29
4.3.1 Parking and park-and-ride ............................................................ 29
4.3.2 Regulative measures (access and LTZs) ................................................ 30
4.3.3 Pricing (road charging, rewarding mechanisms and R&D) .............................. 30
4.3.4 Cycling infrastructure enhancement ................................................... 31
4.4 Mobility management ................................................................... 32
......................................................................
4.4.1 Mobility services 32
........................................................................
4.4.2 Mobility plans 33
4.4.3 Mobility marketing ................................................................... 34
...........................................................................
4.4.4 Eco-driving 34
.......................................................................
4.5 Safety and security 35
4.5.1 Pedestrians and cyclists ............................................................... 35
......................................................................
4.5.2 Public transport 36
4.5.3 Traffic management .................................................................. 36
4.6 Car-independent lifestyles ................................................................ 37
...........................................................................
4.6.1 Car-sharing 37
4.6.2 Carpooling........................................................................... 38
4.6.3 Cycling services (bike-sharing, integration cycles and buses) ........................... 38
4.7 Urban freight logistics ................................................................... 39
4.7.1 New distribution schemes ............................................................ 39
4.7.2 Access restriction and control ......................................................... 39
4.7.3 Freight partnership schemes and driver support ....................................... 41
4.8 Transport telematics..................................................................... 42
4.8.1 Traffic management and control ...................................................... 42
4.8.2 PT fleet management ................................................................. 43
4.8.3 Parking guidance systems ............................................................. 44
6 policy recommendations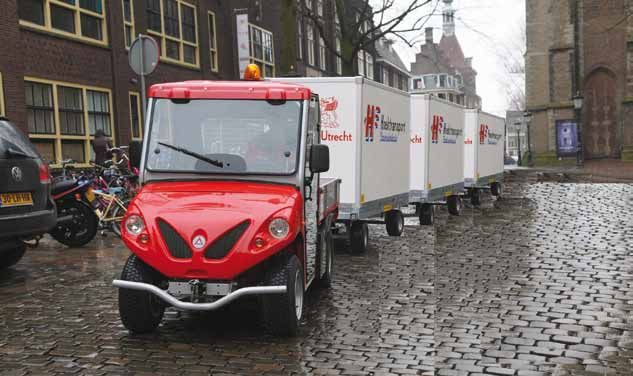
5. Recommendations for sustainable urban mobility. . . . . . . . . . . . . . . . . . . . . . . . . . . . . . . . . . . .                                                        45
  5.1 CIVITAS Plus policy measures: main dimensions                                 ...........................................                                                 45
                     .........................................................................
    5.1.1 Sustainability                                                                                                                                                        45
                 ............................................................................
    5.1.2 Timescale                                                                                                                                                             48
                       ........................................................................
    5.1.3 Territorial area                                                                                                                                                      49
                     .........................................................................
    5.1.4 Stakeholders                                                                                                                                                          49
  5.2 Policy areas..............................................................................                                                                                51
    5.2.1 Lessons learnt from the CIVITAS Plus experience                                   .......................................                                             51
    5.2.2 Future research.......................................................................                                                                                57
6. Policy making for better mobility: Some conclusions                                                ..................................                                        58
  6.1 The CIVITAS legacy: lessons for future editions                            ............................................                                                   61
    6.1.1 Context. . . . . . . . . . . . . . . . . . . . . . . . . . . . . . . . . . . . . . . . . . . . . . . . . . . . . . . . . . . . . . . . . . . . . . . . . . . . . .    59
    6.1.2 Teamwork............................................................................                                                                                  59
                     .........................................................................
    6.1.3 Target groups                                                                                                                                                         59
    6.1.4 Tools and methodologies             .............................................................                                                                     60
  6.2 The way forward.........................................................................                                                                                  60
    6.2.1 Cultural innovation     ...................................................................                                                                           60
    6.2.2 Smart planning .......................................................................                                                                                61
    6.2.3 Roles of decision makers          ..............................................................                                                                      62
    6.2.4 Intervention priorities     .................................................................                                                                         62
7. References . . . . . . . . . . . . . . . . . . . . . . . . . . . . . . . . . . . . . . . . . . . . . . . . . . . . . . . . . . . . . . . . . . . . . . . . . . . . . . . .   64

                                                                                             policy recommendations                                                                  7
List of abbreviations

BaP				 Benzo(a)pyrene
CBA			Cost-benefit analysis
CH4				Methane
CIVITAS PAC		CIVITAS Political Advisory Committee
CIVINET			CIVITAS National Networks
CIVITAS			City-Vitality-Sustainability
CNG			Compressed natural gas
CO				Carbon oxide
CO2				Carbon dioxide
CPs				Collaborative Projects
dB 				Decibel
EC				European Commission
EEA				European Environment Agency
EEV				Enhanced Environmentally Friendly Vehicles
EU				European Union
EU-12 			Member States that joined the EU in 2004 and 2007
EU-15			Member States of the EU prior to EU enlargement in 2004 and 2007
EU-27 			European Union of 27 Member States (prior to Croatia’s accession in 2013)
FQP			 Freight Quality Partnership
GDP 			 Gross domestic product
GHG			 Greenhouse gas emissions
GPS				 Global positioning system
ICTs			Information and communication technologies
ITS				Intelligent transport system
LNG			Liquefied natural gas
Lnight			Night-time noise indicator
LPG				Liquefied petroleum gas
LTZ				Limited traffic zone
MS				Member State
N2O			Nitrous oxide
NH3				Ammonia
NMS			New Member State
NMVOCs 		Non-methane volatile organic compounds
NO2			Nitrogen dioxide
NOX			Nitrogen oxide
O3				Ozone
P+R			Park-and-Ride
P2W			Powered two-wheelers
Pkm			Passenger kilometre
PM				Particulate matter
PM10			Particulate matter with particles with a diameter of 10 micrometres or less
PM2.5			Particulate matter with particles with a diameter of 2.5 micrometres or less
PT				Public transport
R&D			Research and development
RTPI			Real-Time passenger information
SMS			Short messaging service
SOX				Sulphur oxide
Tkm 			Tonne kilometre
UK				 United Kingdom
WHO			 World Health Organization
Wi-Fi			 Wireless fidelity

       8                             policy recommendations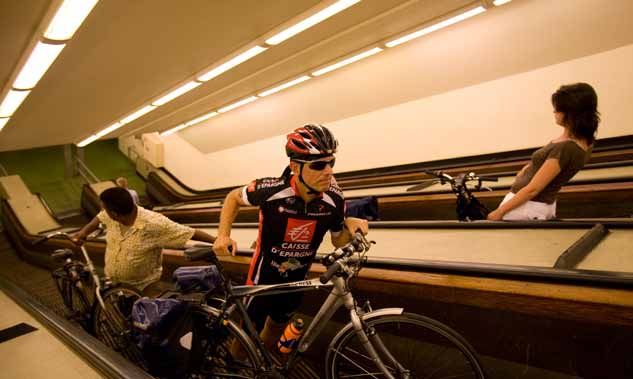
1. Introduction
                                                                                             these recommendations address the
                                                                                             need to develop a mix of policies and
Transport has become one of the major           European-level policy recommendations        measures that operate at different levels
issues affecting sustainability in European     that have the potential for being            and are capable of creating synergies
cities. While cities are powerhouses for        embraced by all European cities — not        that enhance positive impacts while
economic growth and development,                just those which make up the CIVITAS         mitigating negative ones.
generating around 85 percent of the EU’s        community.
GDP, in more and more cities transport
systems have been strained to the                                                            1.2 Chapter guide
breaking point. More than 72 percent of         1.1 Guiding questions
Europe’s population lives in urban areas                                                     Following this introduction, the report is
and urban road traffic is responsible for       These policy recommendations seek            divided into five chapters.
40 percent of total CO2 emissions and 70        to build a solid conceptual framework
percent of emissions of other pollutants.       that allows for a thorough analysis of the   Chapter 2 introduces key aspects and
It is estimated that traffic congestion         elements needed to drive a successful        perspectives that characterise current
costs reach about 1 percent of EU GDP.          shift towards sustainable urban mobility.    and future mobility patterns in Europe.
In terms of the human cost, one of three
fatal accidents occurs in urban areas,          This conceptual framework consists of        Chapter 3 briefly summarises the
mostly affecting vulnerable road users,         three main components:                       keystones of the CIVITAS Initiative since
such as pedestrians and cyclists.                                                            its first phase (CIVITAS I) was launched.
                                                •	An investigation of current mobility       It also describes the evolution that has
Over the last 10 years, the focus of the          patterns in European cities and key        taken place with respect to the thematic
CIVITAS Initiative has been to enhance            drivers for future development of the      categories of measures for sustainable
the sustainability of transport activities        transport sector;                          urban mobility that have been
in urban areas, while coping with the           • Results that have been achieved            implemented within the CIVITAS Initiative.
emergence of new mobility needs and               through CIVITAS Plus actions; and
requirements. As an initiative, CIVITAS         • Recommendations that, if                   Chapter 4 recaps the experiences
aims to achieve a breakthrough by                 implemented, can create a good             of CIVITAS Plus, which is the most
helping European cities to create clean           policy environment and encourage           comprehensive and thematically broad
and energy-efficient urban transport              sustainable mobility measures.             phase of CIVITAS. This chapter details the
systems, and at the same time encourage                                                      results of the evaluation process carried
citizens to make more sustainable modal         These steps can be translated into a         out in each demonstration city with
choices. What makes CIVITAS unique is           number of questions, such as:                further support from the CIVITAS POINTER
its flexibility and cooperative approach,                                                    project.
which facilitates knowledge acquisition         • “Bearing in mind that the demand
and transferability.                              for urban transport is expected to         The evaluation results lend support to
                                                  grow, which policy actions are best        a number of recommendations, which
This publication was written under the            for supporting cleaner and better          are set out in Chapter 5 and structured
auspices of the CIVITAS POINTER project,          transport in cities?”                      according to the most relevant policy
which supported five collaborative              • What can cities do to support a shift      aspects.
projects (CPs) implemented within                 towards sustainable mobility?”
the framework of CIVITAS in the years           • “At which levels - local, national, EU -   Chapter 6 summarises conclusions on the
between 2008 and 2012.                            should such measures be planned?”          main aspects, including the main lessons
                                                • “How can the EU contribute to these        learnt in CIVITAS Plus policy making and
Evaluation and monitoring were the                measures?”                                 the roles of policy actors at different levels.
keystones of CIVITAS POINTER. Drawing
from first-hand, corroborated statistical       Based on the research undertaken in          The last section lists all the references
evidence gathered from participating            the compilation of this report and the       upon which this report is based. For the
cities, this publication presents the results   results arrived at, recommendations are      sake of brevity, only references different
of the CIVITAS Plus cross-site evaluation       presented that can be used by policy         from CIVITAS Plus deliverables (the main
and policy assessment. These findings           makers keen to take independent              sources used for the analysis) are also
support the development of clear                action. It is equally important that         mentioned in the text.

                                                        policy recommendations                                                  9
2. Mobility patterns in
European cities:
characteristics and perspectives
With approximately 74 percent of its            those factors and drivers which are likely    before falling again as a consequence
population of 350 million living and            to shape mobility patterns in future.         of the economic downturn. As for
working in cities of more than 50,000                                                         passenger transport, this has been rising
inhabitants, Europe is one of the                                                             continuously since 1995, with only a small
world’s most densely urbanised areas,           2.1 Characteristics of                        slowdown after 2007.
according to the United Nations (UN             transport demand
World Urbanization Prospects, 2011). The                                                      Globally, passenger cars remain the
share of urban population is expected to        Transport is a core component of              predominant mode of transport by far,
increase even further, up to 82 percent,        the European economy. Since 1995              as the evidence presented in this report
by 2050.                                        this sector has been experiencing             on modal splits and motorisation rates
                                                continuous growth (measured in tonnes         bears out. Public transport still accounts
Generating about 85 percent of the EU’s         and passenger kilometres) in line with        for a rather small proportion of the overall
GDP, cities undoubtedly are powerhouses         developments in GDP (EU, 2013a). Freight      modal split, but still appears to be more
of economic growth and development.             transport reached its peak (a 40 percent      popular in countries of Central and
They are also places of connectivity,           increase in comparison with 1995)             Eastern Europe (CEE) than in the western
creativity and innovation, acting as            in the two-year period of 2007-2008,          EU Member States.
cultural, business and service centres (EC,
2011c). But urban development presents
many territorial challenges on different
levels - notably on the relationship
between cities and peripheral areas,
and the relationship between cities and
territorial development of the EU as a
whole (EC, 2011c).

Transport mobility reflects this duality
of advantages and disadvantages.
While population growth increases
pressure on supply of transport services,
transport services tend to be particularly
well developed and widespread where
population density is high.

Bearing this in mind, Chapter 2 starts
with an overview of the current state
of transport and mobility in Europe,
particularly in European (CIVITAS Plus)
cities. The chapter describes main trends
                                                                                                                                      Image: Paolo Margari / Flickr.com

in the modal split and motorisation
rate, and explains the major impacts of
transport activities. The chapter makes
an important contribution to recent
debates about the future development
of mobility, and provides insights into            Urban transport is a multi-faceted issue

        10                                    policy recommendations
Mobility patterns in european cities
Modal split Figure 1: Share of passenger transport in CIVITAS Plus cities
Passenger cars dominate the modal split
of all inland transport modes, accounting
100
for approximately 84 percent of passenger
kilometres (Pkm) for 2011. Powered two-
80
wheelers, buses and coaches follow
with a total share of 9 percent, while
Modal split (%)
60
the percentage for rail transport is just 7
percent (EU, 2013a). Other
40
Cycle
Walk
On average, the share of passenger cars
20 PT
in the modal split has never fallen below
Cars
60 percent in any EU-27 country1 during
0
the period 2000-2010. This holds true
Funchal
Porto
Aalborg
Skopje
Monza
Coimbra
Utrecht
Brno
Iasi
Perugia
Bath
Zagreb
Gent
Craiova
Ústí nad Labem
Bologna
Brescia
Tallinn
Szczecinek
Gorna Oryahovitsa
Donostia - San Sebastian
Ljubljana
Brighton & Hove
Gdansk
Vitoria-Gasteiz
for both the EU-15 and EU-12 Member
States; although, in 2000, the share of
passenger cars in EU-15 countries (with
the exceptions of Austria, Denmark and
Greece) was higher than 80 percent,
which was not the case for the EU-12 Note: Data sources differ among cities Source: CIVITAS POINTER
Member States. Ten years later, in 2010, (based on interviews with representatives from cities)
the scenario has changed considerably,
and EU-12 Member States are represented
at both ends of the spectrum: Lithuania,
Poland and Slovenia rank highest, percent), Skopje (33 percent) and Zagreb 203 (in 2011). Despite these increases,
whereas the proportion of Pkm for (30 percent). motorisation rates in the EU-12 remain
passenger cars is lowest in Hungary and significantly lower compared to the
the Czech Republic (EU, 2013a). Motorisation rate EU-15.
Automobiles are also dominant at city A high level of passenger car ownership However, motorisation rates in urban
level (see Figure 1). As for CIVITAS Plus (the motorisation rate equals the number areas are usually higher than the national
cities, the share of cars ranges from 13 of cars per thousand inhabitants) is average because of high concentrations
percent in Iasi to 76 percent in Monza. generally indicative of widespread use of people and cars. CIVITAS Plus cities
Cars also represent more than 40 percent of individual motor transport. Among with car ownership rates above the
of the modal split in 14 of 25 CIVITAS Plus the EU-27 Member States2, the countries EU-15 average are Perugia, Brescia,
cities. with the highest motorisation rates are Monza, Bologna and Ljubljana. Rates
Luxembourg (658 passenger cars/1,000 higher than the EU-27 average were also
Public transport shares of greater than inhabitants in 2011) and Italy (610 in recorded in Funchal, Gorna Oryahovitsa
40 percent have been reported in Brno, 2011). Seven more EU Member States and Donostia-San Sebastian. Most of the
Gdansk, Tallinn, Zagreb and Usti nad (Austria, Cyprus, Finland, Germany, cities reported motorisation rates higher
Labem. This finding corresponds to the Lithuania, Malta, Slovenia and Lithuania) than the EU-12 average: Porto, Craiova,
general trend that the share of public had rates of over 500 (at least one car per Skopje and Iasi were the exceptions.
transport is higher in post-communist two inhabitants) in 2011. The lowest rate
countries than in western EU Member in 2011 (203) was in Romania - just over
States. one car per five inhabitants.
The highest shares of cycling in the modal Motorisation rates have been increasing
split are in Utrecht (21 percent), Ghent (20 since 1990, especially in the EU-12. The
percent), Szczecinek (19 percent), Iasi (19 highest increase has been in Poland,
percent) and Aalborg (15 percent). The where the number of passenger cars
highest shares of walking in the modal per 1,000 inhabitants grew from 261
split are found in Gorna Oryahovitsa (60 in 2000 to 470 in 2011 (an 80 percent
1 Data for Cyprus, Malta, Estonia, Latvia
percent), Vitoria-Gasteiz (54 percent), Iasi increase). Romania followed with a 64 and Lithuania are not available for
(49 percent), Donostia-San Sebastian (43 percent increase, from 124 (in 2000) to 2000.
policy recommendations 11Mobility patterns in european cities
2.2 Transport sector Figure 2: Car ownership rates in CIVITAS Plus cities
impacts
700
The transport sector has a clear and direct
600
impact on sustainability because:
500
cars/1 000 inh.
400
• transport (excluding maritime
300
transport and pipelines) absorbs
200
approximately one-third of total
energy consumption in the EU, and 100
transport energy consumption grew 0
Ljubljana
EU15
EU27
EU12
Monza
Brno
Funchal
Utrecht
Coimbra
Zagreb
Gdansk
Porto
Skopje
Iasi
Gorna-Oryahovitsa
Perugia
Bath
Aalborg
Bologna
San Sebastian
Brighton & Hove
Tallinn
Gent
Craiova
Ústí nad Labem
Brescia
Vitoria-Gasteiz
Szczecinek
continuously between 1990 and 2007;
• transport modes are still heavily
dependent (97 percent) on fossil
fuels such as gasoline and diesel
for their energy needs, while only a
Note: Data for Brighton & Hove, Coimbra, Donostia-San Sebastian and Iasi are
minor proportion relies on biofuels
available only at the national level (i.e. UK, Portugal, Spain and Romania).
and electrical energy (1 percent and Source: CIVITAS POINTER Interviews with representatives from cities
2 percent respectively); 84 percent (valid for years between 2007 and 2011)
of fossil fuels are imported, and the
energy bill for fossil fuels amounted
to EUR 1 billion per day in 2011 (EC,
2013a); It therefore comes as no surprise that the The European Commission’s White
• passenger and freight transport decarbonisation of transport activities Paper 2011 also stresses the importance
accounts for about 70 percent of the and subsequent reduction in their of addressing oil dependence while
final demand for oil and oil-derived adverse environmental impacts has securing competitiveness of the EU
products in the EU; attracted growing interest and is now a economy. Although transport has
• a significant proportion of total top-ranking political priority. The ultimate become cleaner in the last few years, oil
greenhouse gas (GHG) emissions goal of policy makers is to mitigate the consumption has increased because of
in the EU-27 originates from the negative impacts of motorised transport greater transport volumes.
transport sector: transport is without decreasing overall mobility in the
responsible for up to 24 percent of face of growing demand.
total GHG emissions (CO2, CH4, NO2),
including international aviation and
maritime transport and excluding Figure 3: Number of days when ozone (O3) exceeds 120µg/m3 in CIVITAS Plus cities
land-use change and forestry activities, Number of days when ozone (O3) concentration exceeds 120 µg/m³ in
CIVITAS Plus cities
which can eliminate or reduce GHG
45
emissions; and 40
35
• the road transport sector is the largest 30
energy consumer, accounting for 82 25
20
percent of total energy consumed by 15
10
transport in 2009: energy used for air, 5
0
rail and inland navigation accounts for
18 percent.
Source: Urban Audit
2 EUROSTAT 2012a
12 policy recommendationsMobility patterns in european cities
2.2.1 Environmental and health Figure 4: Health impacts of air pollution
impacts
Climate change, GHG emissions, air
pollution, noise, energy supply security
and oil dependence are regarded as
the most crucial areas of environmental
intervention. Climate change and GHG
emissions together with increasing oil
dependence and energy consumption,
threaten the world’s natural environment
on different levels and on a large scale.
The health of the world’s population is
affected as well. At the local level, rising
levels of pollutants are damaging air
quality, giving rise to health concerns in
urban areas.
Climate change
Source: EEA, 2013a
In compliance with the Kyoto Protocol on
climate change, the EU agreed to reduce
its GHG emissions by 8 percent from 1990 Alongside the negative effects on The impacts of air pollution on the
levels by 2012. Comparing the base year human health, air pollution also damages environment depend not only on air
set by the Kyoto Protocol and the year ecosystems. It is estimated that two-thirds pollutant emission rates but also on the
2010, GHG emissions in the EU-15 have of the protected sites in the EU Natura location and conditions of such emissions.
fallen by approximately 15 percent in all 2000 network are currently under severe
sectors except transport over these 10 threat from air pollution (EEA, 2013).
years.Transport emissions increased by 20
percent and accounted for more than 20
percent of all GHG emissions. This means Figure 5: Annual average concentrations of NO2 in CIVITAS Plus cities
that transport is the second biggest Annual average concentration of NO2 (μg m-3)
GHG-emitting sector (after energy) and 60
the only major sector from which GHG 50
emissions are still rising.
40
30
Urban transport is responsible for one-
20
quarter of all GHG emissions from
transport. Only in the last few years has 10
the amount of transport GHGs stagnated. 0
Air pollution
Motorised traffic is responsible for Source: Urban Audit
emitting various harmful substances,
such as particulate matter (PM10, PM2.5),
acidifying substances (NOX and NMVOCs)
and ozone precursors (NO2, SOX, and
NH3). In Europe, particulate matter
(PM), ground-level ozone (O3), benzo(a)
pyrene (BaP) and nitrogen dioxide (NO2)
are of particular concern. Transport is a
dominant source of urban emissions that
contribute to negative health impacts,
which are summarised in Figure 4 below.
policy recommendations 13Mobility patterns in european cities
European emissions of PM10 and PM2.5
THE AIR QUALITY DIRECTIVES
dropped by 14 percent and 16 percent
respectively between 2002 and 2011.
The Air Quality Directives 2008/50/EC and 2004/107/ EC set legally binding
Figure 5 shows the most polluted
limits for ground-level concentrations of outdoor air pollutants. Key
European cities, which are located in elements of the EU air quality legislation are described below.
Bulgaria, Poland, Romania and Italy.
• EU limit values are legally binding concentration thresholds that must not
Analogously, a downward trend is visible be exceeded. Limit values are set for individual pollutants and comprise:
over the same period for emissions of a concentration limit, an ‘averaging’ time over which a pollutant is to be
SOX and NOX, which have declined by measured or estimated, the number of times (if any) per year that a limit
50 percent and 27 percent respectively. may be exceeded, and a date by which the limit value must be achieved.
Emissions of NH3 have fallen at a slower Some pollutants have more than one limit value covering different
pace, decreasing by only 7 percent. endpoints or averaging times. Limit values are legally binding in EU
Member States.
Technological advances, improved
exhaust gas treatment of road vehicles • Target values are to be attained where possible by taking all necessary
(brought about by the introduction measures not entailing disproportionate costs. Target values are not
of EU standards) and improved fuel legally binding.
quality - reduced sulphur concentration • Exposure reduction obligation: concentrations are to be reduced by
in particular - are the main reasons for a given percentage depending on the mean triennial PM2.5 urban
substantial reductions in air pollutants. background concentrations from 2008-2010 to 2018-2020.
Most of the cities where ozone (O3)
emission limits are exceeded are
located in Italy. The highest annual Figure 6: PM10 annual average (2011)
mean concentrations of NO2 have been
observed in Italy, Romania and Greece.
Among the CIVITAS Plus cities, Porto,
Coimbra and Brescia are the most
polluted in terms of PM10, while Monza,
Brno and Ljubljana have the highest
ozone emission values.
Among CIVITAS Plus cities, annual average
concentrations of NO2 are highest in the
Italian cities (Brescia, Bologna and Monza).
Source: European Environment Agency
www.eea.europa.eu/legal/copyright
14 policy recommendationsMobility patterns in european cities
Noise and released in March 2013 indicates
that road deaths in 2012 fell by 9 percent
Motorised traffic (together with airports) (equivalent to 2,661 deaths) compared to
is the most significant source of noise 2011. In 2011, road fatalities were down 2
pollution that affects people living in percent from 2010.
urban and metropolitan areas. Almost 70
Image: Jeni Rodger / Flickr.com
million people living in agglomerations The steepest drop in the number of
with more than 250,000 inhabitants aggregate road deaths in the EU-12
are exposed to road traffic noise levels Member States came after 2004 (-11
in excess of 55 dB during the daytime, percent), while there was a 9 percent
while approximately 50 million people decrease in the number of road fatalities
are exposed to road traffic noise above in the EU-15 (ETSC, 2013).
50 dB Lnight during night time.
Looking more closely at urban areas, To improve the safety of pedestrians and
The World Health Organization’s ‘Night road safety depends on a combination cyclists, the EU is taking the following
Noise Guidelines for Europe’ (WHO, of factors, including growing transport actions: 1) promoting regulative measures
2009) describes levels above 55 dB at demand, the integration of transport into aimed at defining compulsory safety
night as “increasingly dangerous for residential areas, and space crowding in standards for vehicles; 2) supporting
public health. Adverse health effects city centres (TRIP, 2013a). Almost 50 research projects to test innovative
occur frequently.” Higher noise levels percent of all fatal accidents involve road designs to improve safety; and
can impede performance, disturb sleep, pedestrians or cyclists. 3) increasing awareness through
lead to stress, cause cardiovascular and information campaigns.
psycho-physiological problems, and The number of fatalities due to road
provoke anti-social behaviour. accidents per million of inhabitants Congestion costs
differs substantially from city to city.
2.2.2 Social and economic impacts Six CIVITAS Plus cities have numbers of From an economic perspective, the main
fatalities per million inhabitants that are negative impact of transport lies in the
Road safety higher than the EU-27 average. These costs caused by congestion. Congestion
are Craiova, Bath, Brescia, Coimbra, Usti is the principal transport concern in urban
In 2012, 27,700 people died and nearly nad Labem and Skopje. In contrast, the areas because:
313,000 were seriously injured in the lowest numbers of fatalities per million
EU-27 Member States as a consequence inhabitants are reported by Porto, • it contributes to GHG emissions,
of road accidents. Statistical evidence Tallinn, Brighton & Hove, Utrecht and local air pollution, noise and traffic
collected by the European Commission Aalborg. accidents;
• it hampers accessibility; and
• it adversely affects economic
Figure 7: Road fatalities competitiveness, social cohesion and
Road safety - fatalities sustainable growth.
120
While urban congestion is closely related
100
to car ownership levels, urban sprawl,
ffatalities/mil. inh.
80 the availability of PT alternatives and
60 interurban network congestion, each of
these phenomena results from growing
40
freight demand across specific corridors
20 at points of intersection with links serving
0
local traffic.
EU27
Ljubljana
Funchal
Monza
Brno
Porto
Skopje
Perugia
Gdansk
Aalborg
Utrecht
Coimbra
Brighton & Hove
Bath
Bologna
Gent
Tallinn
Craiova
Brescia
Vitoria-Gasteiz
Ústí nad Labem
At present, congestion is now responsible
for a loss of 1 percent of European GDP. If
effective countervailing measures, such
as road pricing, are not taken, congestion
Note: Data for Donostia-San Sebastian, Szczecinek, Iasi, Zagreb and Gorna costs are projected to increase by about
Oryahovitsa are not available. 50 percent by 2050 (to nearly EUR 200
Source: CIVITAS POINTER (valid for the period 2008-2010) billion annually).
policy recommendations 15Mobility patterns in european cities
Energy supply security and oil
dependence
Motorised transport has negative impacts
not only on climate, public health and the
environment, but also on the economy.
This is because EU transport relies on
oil for 94 percent of its energy needs.
According to COM(2013)17,‘Clean Power
forTransport: A European alternative fuels
strategy’, Europe imported 84 percent of
its oil in 2011, paying up to EUR 1 billion
per day and resulting in an EU trade
balance deficit of around 2.5 percent of
GDP.
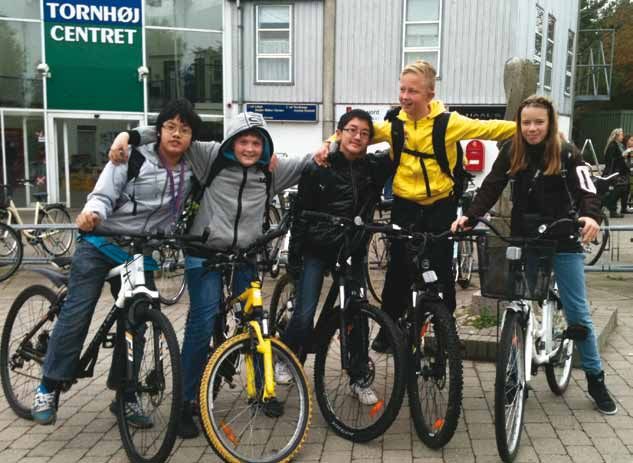
Image: crabchick / flickr.com
As is stated in the ‘Roadmap to a Single
European Transport Area: Towards a
competitive and resource-efficient demographic changes, spatial structure needs in the coming decades. According
transport system’, the failure to address and behavioural developments. to available statistics, women lead men
oil dependence will have a severe impact in terms of adopting mobility patterns
on people’s ability to travel, which would 2.3.1 Demographic aspects that are more sustainable, such as taking
in turn reap dire consequences on shorter journeys, and making more
inflation, the trade balance and overall Future projections of demographic trends frequent use of public transport, cycling
competitiveness of the EU economy. form the basis for any realistic forecasts and walking. This does not, however,
Although technology is improving of future transport demand. The most imply that women prefer to travel in
and transport has become cleaner, oil important trends on which to focus are: more sustainable ways. Differences in
consumption is also on the rise because age, migration flows, gender, household mobility choices are more likely the
of swelling transport volumes — i.e. composition and the labour market. consequence of gender differences in
increased car ownership and vehicle the labour market and in the division of
kilometres (EC, 2011c). Europe’s ageing population is the result of household tasks. Women are still over-
differentdemographicfactors:decreasing represented in lower-paid sectors and
birth rates, increased life expectancy due under-represented in decision-making
2.3 Perspectives on future to medical progress, and also migration positions. Parenthood keeps down
development dynamics and related policies. The overall female employment rates, and women
size of the population is projected to be continue to work more unpaid hours at
Several factors combine to determine only slightly larger in 50 years’ time, but home than men.
transport behaviour and choice of will be much older than it is now. By 2060,
transport modes. These factors evolve the median age of Europeans is projected According to an Edinburgh study (Ryley,
over time, and both influence and reflect to be more than seven years higher than 2005), households with children exhibit
significant changes in lifestyles and it is today, and the number of people distinct travel behaviours: they are highly
working patterns, as well as profound aged 65 or more is expected to comprise dependent on cars as the primary means
demographic shifts and their subsequent 30 percent of the population, as opposed of travel; they own but do not often use
impact on mobility behaviour. Changes in to 17 percent today3. bicycles; and they favour, by a fair margin,
mobility behaviour will largely shape the cycling for leisure rather than for travelling
emergence of new mobility needs and Where mobility is concerned, transport to work. Households consisting of
requirements, while generating a need supply will need to be adapted to meet students, unemployed people and part-
for adequate and accessible policies that the needs of elderly people, especially in timers without children are most likely to
offer equal mobility opportunities to all terms of accessibility, availability of public use non-motorised forms of transport.
citizens. transport, user-friendliness of payment Conversely, families consisting of retirees
systems, safety and security. and high earners are least likely to use
There is a substantial body of academic non-motorised forms of transport.
literature on these issues, and in this Gender and household composition are
section we present an overview of other demographic components that will
the most important points — namely, play prominent roles in shaping mobility 3 EC, 2008
16 policy recommendationsMobility patterns in european cities
With so many demographic changes there is little or no population pressure 2.3.3 Values and lifestyles
afoot — shifting household and in EU Member States, a variety of other
parenting models, new developments factors are driving the development Mobility patterns are also heavily affected
on the labour market, increased labour of the modern city, such as individual by changes in values and lifestyle, but it is
market participation on the part of housing preferences, increased mobility, difficult to make predictions about future
women, as well as an ageing population commercial investment decisions, and levels and distribution of demand.
and new technologies — the variety of the coherence and effectiveness of land-
mobility patterns is likely to increase. use policies at all levels (EEA, 2006). Rates of everyday mobility might fall,
Looking forward, what is required are as more people now work from home
appropriate transport policies that are Recent studies show that urban sprawl, and new technologies provide more
capable of meeting changing needs a dominant trend in the post-war era, options for home-based entertainment.
while staying focused on sustainability. is not likely to disappear in the coming Technological developments in general
years. However, land scarcity, rising costs are affecting almost every aspect of our
2.3.2 Spatial structure and increased appreciation of city life life (labour, travel, leisure, health etc.), and
could cause rates of urban sprawl to have started to change our daily habits in
Another key development behind drop. As inner city areas are becoming significant ways.The leading role is played
current mobility trends is spatial more attractive to new target groups (e.g. by information and communication
distribution of housing. Urban sprawl is high-income households, small families technologies (ICTs). ICTs, in fact, have
the main challenge for urban transport, and the elderly), urban sprawl may have a great potential to weaken, or even
as it entails a greater need for individual already peaked in some cities. eliminate, the conventional constraints
transport modes and thereby generates of time and space, which are the two
congestion, causes environmental Inhabitants of urban areas that are physical dimensions that give rise to the
problems and increases land-take for generally congested and have well- need for travel.
roads and parking areas (EEA, 2010). developed PT services are able to
re-think their mobility behaviour and Today, many different kinds of activities
In the past, the growth of European cities abandon car use. It is therefore expected can be undertaken via the World Wide
reflected general increases in urban that urbanisation might be a driver for a Web, such as e shopping, e-banking,
population. Nowadays, even where reduction in car ownership levels. e-booking of different services etc. These
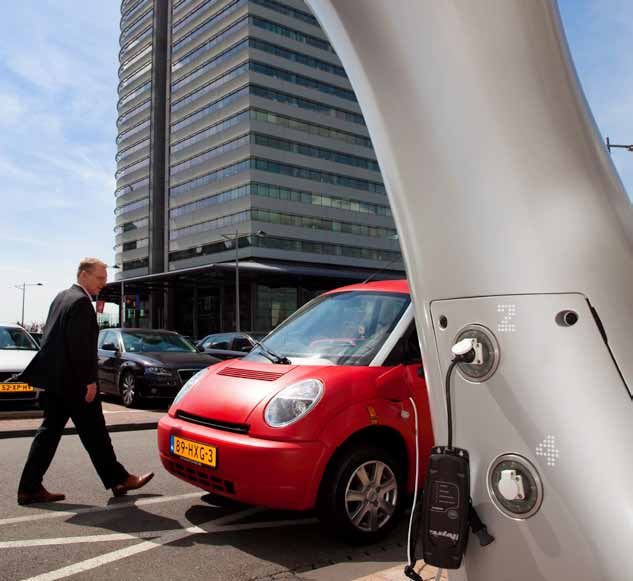
Image: Harry Schiffer / eltis.org
policy recommendations 17Mobility patterns in european cities
options are likely to become more and Factors like the high cost of fuel balanced with the increased importance
more common in future and attract and insurance premiums, youth of sustainability.
an ever-increasing number of users as unemployment and increasing job
digital illiteracy rates continue to fall. insecurity certainly play roles in making Analysis of these variables has revealed
The diffusion of immersive networking cars less attractive to young people, or that all of them could play an important
technology, especially among young forcing young people to postpone the role in reframing future mobility. Every
people, could lead to the development use or purchase of cars. Nevertheless, the domain has relevant driving forces, either
of different sets of mobility preferences changes are profound, and social media on its own or in combination with others.
of future generations who are likely is providing young people with access Predicting the intensity and timing of
to spend more time in virtual spaces. to new lifestyles and identities that are such impacts is challenging, and this in
Beyond this, further potential impacts of simply inaccessible by car. turn makes it difficult to plan and develop
ICTs on lifestyles and travel demands are future transport systems.
hard to predict. Strong arguments are being made that
more widespread use of new ICTs is Managing these paradigm changes will
The younger generation is also both initiating and accompanying the require taking a more holistic approach
undergoing some more subtle cultural emergence of new leisure and working - one which should be broad enough
and lifestyle changes. Not long ago, the lifestyles. in scope to consider system complexity
private car was the paramount symbol and all possible interactions within the
of youth culture, and was viewed as To sum up, this chapter has explored domain of human activities.
the ultimate passport to freedom and some of the variables that could influence
independence. While they remain the future development of urban mobility
important among young people today, trends and travel patterns. New transport
cars are respected more for their utility environments will be highly complex
as appliances and less so in terms of and more demanding, and a wide
symbolic prestige. range of mobility needs will have to be
Image: Tornhøjskolen
18 policy recommendations3. The CIVITAS Initiative:
promoting smart measures
for sustainable urban mobility
As the previous chapter has clearly 3.1. A closer look at the To date, more than 60 European cities
elaborated, transport is one of the major CIVITAS Initiative have been granted funding to implement
issues affecting sustainability in European innovative measures in the area of clean
cities. The intensity of related impacts is The CIVITAS Initiative (‘City-Vitality- urban transport with an EU-funded
of particular concern at urban level, and Sustainability’, or ‘Cleaner and Better investment of EUR 120 million. More than
especially so as Europe becomes even Transport in Cities’) was launched in 800 innovative urban mobility measures
more urbanised. 2000 by the European Commission as have been designed, implemented and
part of the 5th EU Framework Research evaluated under this Initiative.4
The improvement of urban sustainability Programme.
has therefore become a primary objective,
and more action is being taken at different
government levels (local, national and Figure 8: CIVITAS demonstration cities co-financed by the EU since 2002
European) to implement measures that
facilitate greater awareness and changes
in travel behaviour.
At EU level, policy efforts and financial
support led to implementation of the
CIVITAS Initiative in 2002. The Initiative
helps participating European cities to
design, establish and manage innovative
and smart measures aimed at greater
sustainability of the urban mobility
environment.
The purpose of this chapter is to trace the
CIVITAS Initiative’s history and to outline
how measures evolved across different
phases of the Initiative.
Source: www.civitas.eu
4 Science View Newsletter, September
2013
policy recommendations 19The CIVITAS Initiative
3.2. CIVITAS thematic Table 1: Overview of the CIVITAS Programme
categories
CIVITAS Edition Projects Cities
From its early stages, the CIVITAS Initiative MIRACLES Barcelona, Cork, Winchester, Roma
has structured and promoted its actions CIVITAS I TELLUS Berlin, Gdynia, Gothenburg, Rotterdam
around eight thematic categories, as
2002-2006 TRENDSETTER Lille, Prague, Graz, Stockholm, Pecs
illustrated below. The table summarises
programme evolution from 2002 when VIVALDI Nantes, Bristol, Bremen, Kaunas, Aalborg
CIVITAS I became operational. CARAVEL Genoa, Cracow, Burgos, Stuttgart
Toulouse, Debrecen, Venice, Odense,
While thematic content remained mostly
CIVITAS II MOBILIS Ljubljana
constant over the first two CIVITAS
editions, CIVITAS PLUS placed a greater 2005-2009 SMILE
Norwich, Suceava, Potenza, Malmo,
Tallinn
emphasis on the issue of energy saving
while still upholding the general CIVITAS SUCCESS Preston, La Rochelle, Ploiesti
framework. Energy saving spans all eight Aalborg, Brighton & Hove, Donostia-San
ARCHIMEDES Sebastian, Iasi, Monza, Usti nad Labem
CIVITAS themes, including in particular:
clean vehicles and alternative fuels, ELAN Ljubljana, Ghent, Zagreb, Porto, Brno
energy-efficient collective transport, CIVITAS
PLUS Bologna, Funchal, Utrecht, Gdansk,
car-independent lifestyles, and efficient MIMOSA Tallinn
goods distribution. 2008-2012
MODERN Craiova, Brescia, Coimbra, Vitoria-Gasteiz
In the first CIVITAS edition, measures Perugia, Bath, Gorna Oryahovitsa,
RENAISSANCE Szczecinek, Skopje
largely focused on the development and
improvement of public transport, as well Aachen, Gdynia, Koprivnica,
CIVITAS DYN@MO
as on the promotion of clean vehicles. In Palma
PLUS II
CIVITAS II, most measures concentrated Stuttgart, Brno, Malaga,
2012-2016 2MOVE2 Tel Aviv-Yafo
on the development of innovative soft
measures aimed at managing transport
Table 2: Comparison of thematic categories from CIVITAS I, II and Plus programmes
CIVITAS I CIVITAS II CIVITAS Plus
Alternative fuels and clean vehicles,
Clean private and public fleets Clean vehicles and alternative fuels energy-efficient vehicles
(Clean fuels and vehicles)
High quality energy-efficient collective
Stimulation of PT modes Stimulation of PT modes passenger transport
(Collective passenger transport)
Integrated pricing strategies Integrated pricing strategies
Demand management strategies based
Access restriction Access management on economic (dis-)incentives
(Demand management strategies)
Mobility management, communication
Innovative soft measures Innovative soft measures and education
(Mobility management)
Safety and security
Mobility services for energy-efficient
New forms of vehicle use and
New forms of vehicle use and ownership vehicle use
ownership
(Car-independent lifestyles)
Energy-efficient freight distribution
New concepts of goods distribution New concepts of goods distribution
(Urban freight logistics)
Integration of traffic management Innovative transport telematics systems
Telematics
systems (Transport telematics)
20 policy recommendationsThe CIVITAS Initiative
Figure 9: Number of measures implemented in CIVITAS I, II and Plus programmes (by thematic category)
CIVITAS I CIVITAS II CIVITAS PLUS
52
47 49
42 41 42
38 37 38
33 33 32
27 25
23 24 23 23 23 22
21
18 18
8
Alternative fuels High quality energy Economic based Access restrictions Innovative soft Mobility services Energy efficient Innovative
and clean vehicles, efficient collective demand measures for energy efficient freight distribution transport telematics
energy efficient passenger management vehicle use
vehicles transport strategies
demand through the introduction of Figure 10: CIVITAS Plus measures across the eight thematic categories
integrated planning strategies. CIVITAS
Plus includes a large share of measures
relating to access restrictions and energy-
efficient freight distribution (see Figure
below).
The collected data point to a declining
trend for Intelligent Transport System
(ITS) measures, shares of which have
diminished over the course of the three
successive editions. Finally, it is worth
mentioning public transport in that
it broadly remains the main focus of Source: CIVITAS Pointer
intervention in all participating cities,
including the smaller ones.
Figure 11: CIVITAS Plus distribution of financial resources by thematic category
3.3 Exploring measures in
CIVITAS Plus
With regard to the CIVITAS Plus edition,
Figure 10 below shows that the vast
majority of measures focus on mobility
management by paying special attention
to information and awareness campaigns
(52 measures).These are followed by three
horizontal measures that are dedicated
to the promotion of clean vehicles and
alternative fuels (42 measures), efficient Source: CIVITAS Pointer
passenger transport (42 measures) and,
finally, efficient goods distribution (49
measures). Note that all of them have
‘energy efficiency’ as their main target.
policy recommendations 21The CIVITAS Initiative
Also of interest is the distribution
of resources spent per thematic
category. As illustrated in Figure 11, the
implementation of measures related
to alternative fuels and clean vehicles
— together with high-quality, energy-
efficient passenger transport — is quite
expensive.
This is due chiefly to two factors: the high
costs of exploring new technologies in
relation to vehicles and fuels, and the high
level of investment required to introduce
innovation into urban PT networks. These
two factors are widely applicable and
increasingly interrelated.
Over 300 innovative measures were
introduced in 25 cities during CIVITAS
Plus in the four years spanning 2008-
2012. They are briefly presented and
outlined in this section with reference to
the CIVITAS thematic categories, while the
main results and achievements following
their implementation are analysed in the
Image: CIVITAS
following chapter.
22 policy recommendations4. Evaluating for policy
development:
the CIVITAS Plus experience
Within the CIVITAS Initiative, the CIVITAS Evaluations conducted by local teams in which both the impact and process
Plus edition is the most broad and the demonstration cities, with support evaluations were built has ensured a
comprehensive. Over 300 measures have from CIVITAS POINTER over five years consistently high quality of cross-site
been implemented and evaluated by 25 of intense activity, are the basis of the outputs.
cities, with the aim of achieving vibrant, results presented here. CIVITAS Plus
sustainable urban environments while measures were evaluated in terms of their In this chapter, main findings of the
curbing the negative effects of motorised overall effectiveness, and the common evaluation process for each of the eight
transport. consolidated framework approach on CIVITAS thematic categories (and related
policy measures demonstrated within
CIVITAS Plus, see Table 3) have been
Table 3: CIVITAS Plus thematic categories and policy measures identified and presented in line with the
following considerations:
CIVITAS thematic categories CIVITAS Plus policy measures
Vehicle modification or replacement 1. The evaluation of results and
Clean fuels and vehicles
Alternative fuels success factors aims to identify the
Information, ticketing and tariffs contribution of each policy measure,
classified by thematic category, in
Collective passenger transport Accessibility, infrastructure and network
promoting a model of sustainable
Public transport fleet management mobility in urban areas.
Parking and park-and-ride 2. The identification of major drivers
Regulative measures (access and LTZs) and barriers that have occurred
Demand management at various phases of a measure’s
strategies Pricing (road charging, rewarding mechanisms
and R&D) implementation helps to explain
more clearly why measures succeed
Cycling infrastructure enhancements
or fail.
Mobility services 3. Reflection on further up-scaling
Mobility plans and transferability potentials helps
Mobility management
Mobility marketing with identifying key requirements
and opportunities for further
Eco-driving
local exploitation and cross-site
Pedestrians and cyclists dissemination.
Safety and security Public transport
Traffic management The outcome of this analysis forms
Car-sharing the basis for policy reflections and
recommendations.
Carpooling
Car-independent lifestyles
Cycling services (bike-sharing, integration cycles
and buses)
New distribution schemes
Urban freight logistics Access restrictions and control
Freight partnership schemes and driver support
Traffic management and control
Transport telematics PT fleet management
Parking guidance systems
policy recommendations 23Evaluating for policy development
4.1 Clean fuels and vehicles
CIVITAS Plus has implemented 37 measures under this thematic category. The majority of measures concern the replacement or
modification of PT fleet vehicles and/or municipal fleet vehicles, while those remaining deal with research on future provision of
alternative fuels, focusing on strategy and process optimisation, or on changing user attitudes towards alternative fuels.
Table 4: Clean fuels and vehicles
CIVITAS thematic category Policy measures Cities No. of measures
Ghent, Ljubljana, Zagreb, Porto, Aalborg, Donostia-
Vehicle
San Sebastian, Iasi, Monza, Bologna, Funchal, Bath,
modification or 24
Gorna Oryahovitsa, Perugia, Skopje, Szczecinek,
Clean fuels and vehicles replacement
Craiova, Coimbra, Brescia, Craiova
Ghent, Gdansk, Tallinn, Brighton & Hove, Bologna,
Alternative fuels 13
Funchal, Vitoria, Brno, Skopje, Coimbra, Brescia
Total 37
4.1.1 Vehicle modification or levels, and significant investment Drivers and barriers
replacement is required. The costs to introduce
and operate clean vehicles (hybrid Strong political will to support and
Results and success factors in particular) are significantly higher implement these measures is a major
than those for traditional vehicle types; driver, together with a set of organisational
Tests conducted on public fleets and clean vehicles (CNG vehicles, for factors aimed at smoothing the entire
using new vehicles are shown to have example) are only rarely found to justify process. Barriers are more diverse
had largely positive impacts on the the investment. In this context, hybrid and are concentrated especially in
environment, though the results differ vehicles are of particular interest, as they the planning and preparation phase,
greatly, depending on the technology have great potential to reduce fossil namely: technological gaps, absence of
being tested. An assessment of CNG fuel consumption and environmental legislation, lack of political support and
use in buses, for example, revealed emissions in the long term. In terms of insufficient planning.
a significant reduction in particulate cost, the retrofitting of buses to use dual-
emissions and slight decreases in CO2 fuel was found to be a cost-effective way From the technical side, much depends
and NOx emissions, but increased CO of extending the life of buses currently in on staff knowledge and experience
emissions. Results were slightly different service while, at the same time, lowering (or lack thereof ). The success of these
for buses using LPG: there was a marked emissions. measures essentially boils down to
increase in CO2 emissions, but lower
emissions of CO, NOx and PM.
The results support conclusions from
previous CIVITAS editions that the use
of alternative fuels has great potential
to reduce vehicle emissions and is
an attractive option for PT operators.
However, investment costs are generally
high, especially for those fuel types which
require the building of new refuelling
stations. The successful introduction
of alternative fuels depends on tax
rates, legislation and regulation, supply
reliability, and general technical and
operational competency.
From an economic perspective, further
efforts are needed to reap greater
Image: Pascaline Chombart
benefits while curbing expenditure
24 policy recommendationsYou can also read