Post-Watershed Restoration Stream Evaluation - December 3, 2015 - Lake Ripley ...
←
→
Page content transcription
If your browser does not render page correctly, please read the page content below
Post-Watershed Restoration
    Stream Evaluation

       December 3, 2015

                    Prepared by:

                    Lisa A. Griffin,
          Lake Ripley Management District

                Funding provided by:

     Small-scale Lake Planning Grant, SPL-340-14
     Wisconsin Department of Natural Resources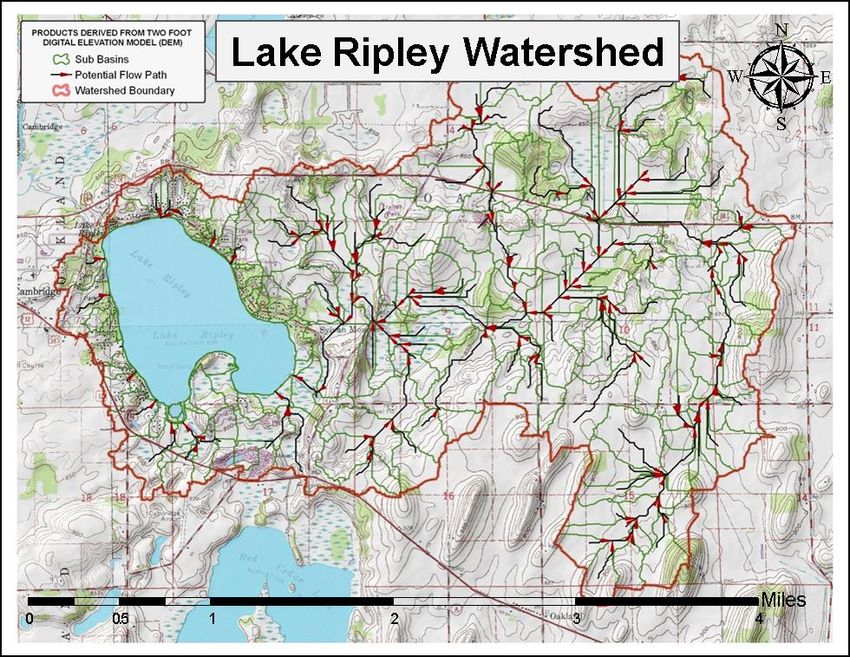
Contributors: David Marshall, Underwater Habitat Investigations LLC (consultant); Lisa Griffin, Lake
Ripley Management District; Patricia Cicero, Jefferson County Land and Water Conservation
Department; Kyle Whalley, Lake Ripley Management District; John Molinaro, Mike Sabella, Jane
Jacobsen-Brown, Georgia Gomez-Ibanez, Craig Kempel, Jimmy DeGidio, and Walt Christensen, Lake
Ripley Management District Board of Commissioners; and phosphorus analysis provided by the
Wisconsin State Lab of Hygiene. Financial support provided in part through a Lake Management
Planning Grant from the Wisconsin Department of Natural Resources.

                                               Abstract
 A 1993 Wisconsin Department of Natural Resources appraisal of Lake Ripley’s inlet tributary
found water quality to be in poor condition. Based on recommendations of the appraisal,
several practices were implemented to help enhance water quality. Approximately 167 acres
were removed from agricultural production and restored to natural ecosystems now called the
Lake District Preserve. Additional lands were taken out of sod production and returned to
wetlands, stream bank characteristics were improved to reduce erosion, and drainage ditches
were plugged to help restore wetland functions. To determine the effects of these watershed
practices, the Lake Ripley Management District conducted stream monitoring on three sections
of the inlet tributary to Lake Ripley from May through September of 2014 and collected water
samples to analyze phosphorus concentrations from May 2014 to April 2015. Phosphorus
samples were submitted to the Wisconsin State Lab of Hygiene for analysis of total phosphorus.
This document contains both information about the 2014 monitoring results and 2014/2015
phosphorus analysis of the stream that flows into Lake Ripley. This also provides a comparison
of water quality parameters found in the 1993 appraisal to this study. While some water
quality parameters seem to be improving such as dissolved oxygen and total phosphorus, the
concentration of phosphorus found in the tributary is still above the State’s water quality
criterion for streams (WisCALM, 2015). Rain events also cause or correlate with an increase in
sedimentation and nutrients in the stream that are delivered to the lake. Additional
management considerations should be sought to further reduce the phosphorus and sediment
loads found in the tributary. This project was funded through a small-scale lake planning grant
provided by the Wisconsin Department of Natural Resources.

                                            Introduction
A 1993 Water Resources Appraisal was performed by the Wisconsin Department of Natural
Resources (WDNR) to evaluate the condition of Lake Ripley and its inlet tributary system. Data
collected from stream monitoring in 1993 was utilized to determine stream quality and
classified the inlet to be in poor health largely due to the lack of oxygen in the water. The
stream was described as “dark and septic” with “heterotrophic periphyton (slime growths)”
that indicated very poor water quality (Wisconsin Department of Natural Resources, 1993).
According to the 1993 appraisal, high phosphorus levels in the stream were estimated to
contribute 72% of the lake’s total phosphorus load from June through September. At one
monitoring site, dissolved oxygen (D.O.) ranged from 0.8-1.8 mg/L during this timeframe.
Additionally, high phosphorus concentrations of stormwater from intensive development near
the lake, along with sediment and phosphorus runoff from agricultural land uses, are the main

                                                    1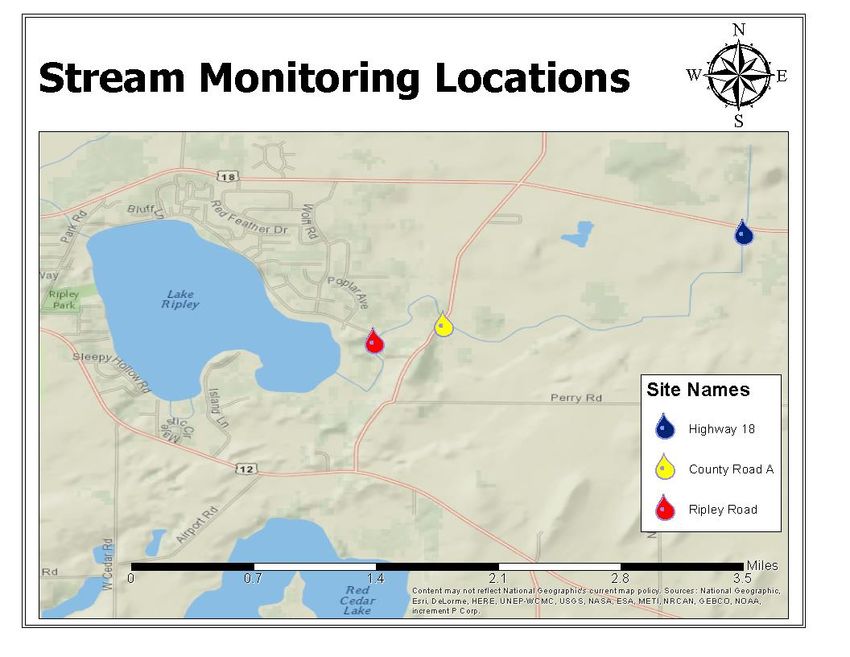
sources of sediment and phosphorus to Lake Ripley. A D.O. level of 5 milligrams per liter (mg/L)
is the minimum amount necessary to protect warm water fish and aquatic life communities
that inhabit Lake Ripley and its' inlet stream. The impacts of no or low oxygen in the stream
were evident based on the macroinvertebrate community that was dominated by pollution
tolerant species, such as red pigmented midges, and the absence of species that require higher
oxygen levels in the water. These characteristics are consistent with impacts associated with
runoff containing sediment and phosphorus.

Watershed best management practices to reduce nutrients and sediments were suggested as
part of the 1993 WDNR appraisal. Many projects were implemented beginning with the launch
of a 13-year Priority Lake Project in 1993 to restore natural habitat and reduce erosion. Lake
and stream recovery efforts following the 1993 appraisal also included the acquisition of a 167-
acre agricultural area that was restored to a natural area. The restoration efforts of the natural
area performed by the Lake District in partnership with the U.S. Fish and Wildlife Service
included plugging two farm drainage ditches and restoring wetland habitat that was present
before farming ditches were constructed. Now called the Lake District Preserve, this prior
agricultural property consists of restored wetlands, woodlands, and prairie that now help
absorb water and filter pollutants from farmland runoff. Ditch bank repair adjacent to a sod
farm located north of the Highway 18 stream monitoring site began in 1998 and was completed
in 2004. This property and the surrounding area are no longer farmed and are comprised of
relatively undisturbed marshland.

                                          Study Area
Stream monitoring was conducted at three sites along Lake Ripley’s only perennial inlet
tributary (Figure 1). Monitoring sites were located at State Hwy 18 (Hwy 18), County Road A
(CTH A) and Ripley Road (Ripley Rd.). The Hwy 18 and Ripley Road sites are located
downstream of the road crossings and the CTH A site is located upstream of the road crossing.
This tributary is 4.25 miles in length and is a first order stream. In 1993, monitoring stations
were established and used for the stream and lake quality analysis. Data obtained from these
sites during the study timeframe were also utilized for the 2014-2015 restoration analysis.

                                                2
Figure 1: Stream monitoring locations of the inlet tributary to Lake Ripley.
The Hwy 18 site is the furthest distance from Lake Ripley located 3.64 miles from the lake and is
just south of the road Hwy 18. Three culverts capable of transferring water from the drainage
ditches on the north side of Hwy 18 to the inlet tributary and are placed at different heights
along the road bank. Two out of the three culverts are known to actively transport water from
the north side of Hwy 18 to the south side. The lowest of the three culverts has water flowing
through it during all sampling events. This culvert enters the monitoring site at an angle and
downstream of the other two culverts (Figure 2). The next higher culvert had water flowing
during higher water conditions. The highest of the three culverts did not contributed to stream
flow during any sampling event. The higher two culverts run perpendicular to the road. This
portion of the tributary has been straightened by channeling both upstream and downstream
of this monitoring site. Monitoring was conducted approximately 3 feet downstream from the
bottom most culvert. A dense deposit of live and dead snails is found just downstream from
the bottom culvert. Monitoring at that site included discharges from all culverts.
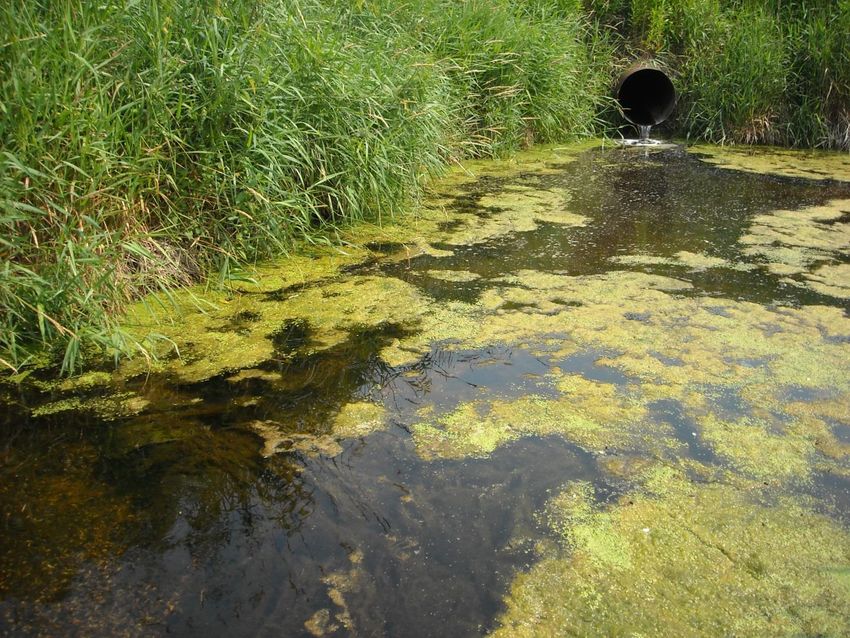
3Figure 2: Two culverts of the three culverts located at the Hwy 18 site. White arrows display the
presence of the two active culverts. The culvert on the left is under water and had a constant flow. A
deposit of snails is located below the arrow. The culvert on the right flows when water levels north of
the road reach that elevation. A third culvert is located to the right and approximately 2 feet higher in
elevation to the culvert shown on the right of the image but is not visible through the grass.
Downstream of Hwy 18, the stream runs along the border of the Lake District Preserve, through
wetlands owned by the Oakland Conservation Club, and then to the CTH A culvert. The CTH A
sampling site is located 1.47 miles upstream of the lake and obtains water contributions from
the Hwy 18 stream monitoring site and surrounding watershed. A staff gauge showing stream
height elevation that was placed during the 1993 appraisal is located at this site.
The closest monitoring site to Lake Ripley is located where Ripley Road intersects with the
tributary and is approximately 0.67 miles from the lake. Prior to reaching this site, the tributary
meanders through wetlands that are owned by the WDNR after leaving the CTH A site. This site
includes water from the previous monitoring sites and approximately two-thirds of the
watershed drains through this monitoring location. Drainage of the northern, eastern and
4southern portions of the watershed all flow into the inlet stream. This area is mainly comprised
of agricultural uses. Drainage of the western portions of the watershed and those located
north and south of Lake Ripley do not contribute flow to the inlet stream. Drainage patterns of
the watershed are shown in Figure 3.
Figure 3: Lake Ripley watershed sub-basin flow path map.
Methods
To evaluate the impacts of these large-scale watershed improvements, the Lake District
conducted a short follow-up stream monitoring program in 2013 leading to the need for
additional research in 2014-2015. Though not as rigorous as in the 1993 appraisal, the 2013
data revealed significant improvements to the overall stream conditions prompting for a more
extensive water quality analysis.
With the assistance of David Marshall of Underwater Habitat Investigations LLC., an in depth
stream health evaluation and phosphorus analysis was conducted in 2014-2015. The 2014-
2015 study included chemical and physical water quality surveys, bimonthly stream monitoring,
rain event sampling, fish and macroinvertebrate surveys, and phosphorus sampling. Stream
5monitoring and rain event sampling was conducted on a bimonthly basis from May through
September of 2014. Stream monitoring did not continue from November 2014 to April 2015
due to the challenges faced with ice conditions and the additional cost of consulting. Chemical
and physical water quality surveys were conducted on May 6, May 19, June 10, June 19 (rain
event), July 5, July 20, August 4, August 19, September 2 and September 4 (rain event). Fish
shocking surveys and macroinvertebrate sampling were conducted once during this timeframe
on May 19. All sampling events started at the furthest location from the lake at the Hwy 18 site
and moved downstream to CTH A and lastly Ripley Road. Finally, monthly water samples were
collected for a total phosphorus analysis on October 24, November 11, December 12, January
28, February 24, March 26, April 7, and April 10 (rain event). Data was not collected at the
Ripley Road site on July 5th.
In the 1993 appraisal, total phosphorus concentrations were collected at all three monitoring
sites. Dates of sampling events are referenced in Table 9. Some samples were collected at
each site on the same day.
A YSI Model 52 testing meter was used to measure D.O. and temperature, while a YSI Model 63
pH/conductivity meter was used to measure pH and specific conductance. A Swoffer Model
2100 velocity meter was used to gather flow measurements along with an existing staff gauge
located at the CTH A site. A rain gauge was installed on the staff meter to determine rain fall
between sampling events. Water clarity was measured with a 120 cm transparency Secchi
tube, and turbidity was measured with a Hach Model 2100P turbidimeter. A d-frame kick net
was used in macroinvertebrate collection, and a towed direct current (DC) electroshocker was
used to sample stream fish populations. Other equipment included compound and dissecting
microscopes, plastic collection bottles, and sulfuric acid preservative for phosphorus analysis.
Total phosphorus analysis was conducted by the Wisconsin State Lab of Hygiene.
Results
Dissolved oxygen (D.O.): At Hwy 18, the average D.O. was 5.3 mg/L. Sixty percent (6 out of
ten) of the water samples possess D.O. levels below 5 mg/L (the minimum amount necessary to
protect warm water fish and aquatic life communities), and two of those samples were below 2
mg/L. For the most part, Hwy 18 had lower D.O. concentrations compared to the other
locations. Concentrations as low as 1.2 mg/L were present approximately 1-3 feet downstream
of the lowest and most active culvert. The average D.O. level at the CTH A site was 6.3 mg/L.
Forty percent (4 out of 10) of the water samples possessed D.O. levels below 5 mg/L although
no water samples dropped below 2 mg/L. The Ripley Road average D.O. was 6.5 mg/L and
dropped below 5 mg/L 44% (4 out of 9) of the samples. Data was not collected during the July
5th monitoring event at the Ripley Road site leading to only 9 days of data collection. Dissolved
oxygen data are summarized in Figure 4 and Table 1.
6Table 1: 1993 and 2014 Dissolved Oxygen measurements at each sampling site. Yellow highlight
indicates rain events.
1993 Dissolved Oxygen (mg/L) 2014 Dissolved Oxygen (mg/L)
Date Hwy 18 CTH A Ripley Rd Date Hwy 18 CTH A Ripley Rd
4/26/1993 12.8 8.6 5/6/2014 11.6 12.5 10.0
7/12/1993 6.1 16.0 17.3 5/19/2014 14.6 9.9 14.6
7/27/1993 9.2 1.6 0.0 6/10/2014 5.0 6.7 6.5
8/10/1993 1.6 1.3 6/19/2014 2.7 2.5 2.7
9/1/1993 0.8 7/5/2014 2.0 4.3
10/6/1993 6.6 1.8 2.5 7/20/2014 8.5 8.2 8.3
10/19/1993 3.9 4.1 8/4/2014 3.7 6.3 4.7
11/22/1993 8.8 6.8 6.5 8/19/2014 1.3 3.7 3.1
12/14/1993 7.1 6.2 9/2/2014 1.2 5.2 5.2
9/4/2014 2.1 3.7 3.3
Average 8.7 4.9 5.8 Average 5.3 6.3 6.5
2014 Lake Ripley Inlet D.O. Concentrations
16.0
14.0
12.0
10.0
Hwy 18
mg/L 8.0
CTH A
6.0 Ripley Rd
4.0
2.0
0.0
4/21/2014 6/10/2014 7/30/2014 9/18/2014
Figure 4: 2014 Inlet dissolved oxygen concentrations.
Water clarity/turbidity: Average water clarity was highest at the Hwy 18 site at 106 cm and
lowest at the CTH A site at 81 cm. Ripley Road average clarity was 101 cm. Nephelometric
Turbidity Units (NTU) is a measure of the amount of light scattered by particles found in the
water column and is the primary unit of measurement to describe turbidity levels. Higher
amounts of particulate or sediment in a sample will scatter more light and will yield a higher
7NTU reading, whereas water samples with fewer particulates will result in a lower NTU reading.
Average turbidity at Hwy 18 was 10.6 NTU whereas CTH A yielded a higher average of 13.7 NTU.
Ripley Road was not analyzed for turbidity.
Water clarity and turbidity measurements were typically favorable during low flow periods. As
expected, water clarity declined during rain events while turbidity levels increased. The lowest
water clarity measurements and highest turbidity measurements occurred after a 3.5 inch rain
event on June 19, 2014.
Water clarity and turbidity data are presented in Tables 2 and 3 and Figures 5 through 7 with
Figure 7 establishing the relationship between these two measurements. A non-linear log
relationship between water clarity and turbidity likely reflects the truncated water clarity
measurements at 120 centimeters (cm) and other factors such as color increases as organic
compounds are released from wetland soils.
Table 2: 2014 Transparency measurements at each sampling site. Yellow highlight indicates rain events.
2014 Transparency (cm)
Date Hwy 18 CTH A Ripley Rd
5/6/2014 120 120 120
5/19/2014 120 117 120
6/10/2014 120 90 90
6/19/2014 14.6 18.5 45
7/5/2014 120 110
7/20/2014 120 120 120
8/4/2014 120 120 120
8/19/2014 120 40 120
9/2/2014 120 38 120
9/4/2014 89 36 57
Average 106 81 101
82014 Lake Ripley Inlet Transparency
140
120
100
80 Hwy 18
cm
60 CTH A
Ripley Rd
40
20
0
4/21/2014 6/10/2014 7/30/2014 9/18/2014
Figure 5: Lake Ripley transparency tube measurements.
Table 3: 2014 Turbidity measurements at sites Hwy 18 and CTH A. Yellow highlight indicates rain events.
2014 Turbidity (NTU)
Date Hwy 18 CTH A
5/6/2014 2.5
5/19/2014 2 7.1
6/10/2014 1.7 6.9
6/19/2014 66.3 39.7
7/5/2014 2 8
7/20/2014 2.1 3.5
8/4/2014 5 3.4
8/19/2014 4.2 19
9/2/2014 4.8 22.4
9/4/2014 7.5 24
Average 10.6 13.7
92014 Lake Ripley Inlet Turbidity
70
60
50
40
NTU Hwy 18
30
CTH A
20
10
0
4/21/2014 6/10/2014 7/30/2014 9/18/2014
Figure 6: Lake Ripley inlet turbidity measurements.
Figure 7: Lake Ripley inlet water clarity turbidity regression
Flow and Water Level Gage: At the CTH A site an original stage gage was erected in 1993 and
was also used to measure 2014 water levels. Generally, the higher elevation recorded on the
staff gauge corresponded to a larger amount of stream flow. Average flow measured in 2014
was 6.9 cubic feet per second (cfs) (Table 4). During the June 19th rain event, we can see a
dramatic increase in flow due to a 2 foot increase in water level height. The average staff height
10was 7.7 ft with a flow rate of 6.9 cfs included the June 19th rain event. However, when that
event is removed the average height is 7.5 ft. and the flow rate is reduced to 4.0 cfs. Flow data
was not collected at Hwy 18 because the capacity of the flow output is restricted to the size of
the lowest culvert during low flow conditions. Until water elevations on the north side of the
road reach the elevation of the next highest culvert, flows remain the same as the maximum
amount that would pass through the lowest culvert. Immediately downstream from the lowest
culvert are obstructions in the stream, also reducing the ability to accurately calculate flow.
Flow data was not collected at the Ripley Road site.
Flow measurements were paired with water level measurements to establish a flow rating
curve. A linear regression with an R squared value of 0.997 proved to be a good fit down to
about 2 cubic feet per second (cfs) of stream flow (Figure 8). The calculation shown in Equation
1 can be used to estimate streams flows from water levels of 7.27 feet or higher.
Equation 1:Measuring flow using stream elevation
y = 16.759x - 121.86 or
Flow = 16.759 x water level -121.86
Table 4: 1993 and 2014 Stage height and flow of the CTH A site. Yellow highlight indicates rain events.
1993 2014
CTH A Stage Flow CTH A Stage Flow
Date ft cfs Date ft cfs
5/27/1993 8 4.4 5/6/2014 7.5 3
6/29/1993 8.28 4.98 5/19/2014 7.58 4.1
7/12/1993 8.57 6.73 6/10/2014 7.4 2.2
7/27/1993 8.4 4.65 6/19/2014 9.04 29.9
8/10/1993 8.48 6.18 7/5/2014 7.95 7.8
9/1/1993 8.28 4.98 7/20/2014 7.62 5.6
Average 8.3 5.3 8/4/2014 7.42 2.2
8/19/2014 7.55 4.42
9/2/2014 7.3Figure 8: Flow and water level regression at CTH A.
Rain fall: A rain gauge was installed on the staff gauge located at the CTH A site. Rain totals
were recorded between sampling events. This information is useful when sampling events are
held close together and after rain events. However, during longer periods of time between
sampling events, these measurements may not be accurate due to possible water evaporation.
Rain fall data is found in Table 5. According to the rain gauge, seven inches of rain fell between
June 10 and June 19. Verifying precipitation rates from US Climate Data, rain fell in the city of
Jefferson on June 17 and June 19. Jefferson lies approximately 5 miles from Lake Ripley and
was the closest location with precipitation data. A LRMD Board member reported a 3.5 inch
rain fall shown from their personal rain gauge from over night of June 18 into the morning of
June 19.
Table 5: Rain fall observed in rain gauge at CTH A. Yellow highlight indicates rain events.
2014 Rain Fall (inches)
Date CTH A
6/10/2014 3.5
6/19/2014 7
8/19/2014 1.6
9/2/2014 1.95
9/4/2014 1.1
Water temperature: Water temperatures were recorded for each sampling site and found in
Table 6 and Figure 9. The Hwy 18 site had the highest water temperature average at 18.4 °C ,
followed by Ripley Road at 17.1°C and finally CTH A at 16.5 °C. The Hwy 18 site is very shallow
with slow moving water. The CTH A average is almost 2 degrees Celsius lower that Hwy 18.
This could be due to ground water contribution. The Ripley Road site is also lower than Hwy 18
which could also be due to ground water contribution. During monitoring events the Hwy 18
12site was routinely sampled first followed by CTH A and Ripley Road. It may be expected for
temperatures to increase as sampling occurred later in the day, but this was not shown to be
true at these sites.
Table 6: 1993 and 2014 temperature recorded for each sampling site. Yellow highlight indicates rain
events.
1993 Temperature (°C) 2014 Temperature (°C)
Ripley Ripley
Date Hwy 18 CTH A Rd Date Hwy 18 CTH A Rd
4/26/1993 13.0 12.5 5/6/2014 13.2 11.3 12.7
7/27/1993 25.4 21.3 27.8 5/19/2014 14.7 12.5 12.8
8/10/1993 16.5 18.2 6/10/2014 18.7 15.6 15.6
9/1/1993 18.0 6/19/2014 20.0 19.2 19.6
10/6/1993 11.5 10.0 10.6 7/5/2014 18.2 15.6
10/19/1993 11.2 11.1 7/20/2014 22.9 20.4 20.0
11/22/1993 3.8 2.5 2.0 8/4/2014 19.8 16.9 18.3
12/14/1993 2.0 0.5 8/19/2014 19.5 18.6 19.2
9/2/2014 17.2 16.3 17.0
9/4/2014 19.6 18.4 18.9
Average 13.4 11.6 11.8 Average 18.4 16.5 17.1
2014 Lake Ripley Inlet Temperatures
25.0
20.0
15.0 Hwy 18
°C
CTH A
10.0
Ripley Rd.
5.0
0.0
4/21/2014 6/10/2014 7/30/2014 9/18/2014
Figure 9: Temperature profile of Lake Ripley inlet stream.
pH: Measurements in 2014 show average pH is the same for Hwy 18 and CTH A at 7.5 with
slight increase to 7.7 at the Ripley Road site (Table 7). Ripley Road shows the highest average
of pH compared to the other two sites. The June 19th rain event sampling date shows the
lowest pH values for each site. pH values were higher in spring and reduced throughout the
summer.
13Table 7: 1993 and 2014 pH recorded for each monitoring site. Yellow highlight indicates rain
events.
1993 pH 2014 pH
Date CTH A Ripley Rd Date Hwy 18 CTH A Ripley Rd
3/11/1993 7.5 5/6/2014 8.0 7.5 8.0
7/12/1993 7.3 7.3 5/19/2014 8.3 8.0 8.3
7/27/1993 7.3 6/10/2014 7.7 7.6 7.5
8/10/1993 7.4 7.3 6/19/2014 6.4 6.5 6.8
9/1/1993 7.4 7/5/2014 7.3 7.3
10/19/1993 7.5 7.5 7/20/2014 7.2 7.6 7.9
8/4/2014 7.5 7.8 7.8
8/19/2014 7.3 7.3 7.5
9/2/2014 7.5 7.7 7.9
9/4/2014 7.3 7.5 7.5
Average 7.4 7.4 Average 7.5 7.5 7.7
Specific Conductance: Average specific conductance was 620 µohms/com at Hwy 18, 661
µohms/ cm at CTH A, and 665 µohms/cm at Ripley Road (Table 8). Specific conductance is
lower at the Hwy 18 site compared to CTH A and Ripley Road. Specific Conductance is a
measure of how well water can conduct an electrical current. It is highly dependent on the
amount of dissolved material in the water. This slight increase in downstream sites could be
due to a larger watershed area draining into those sites. The lowest values were found on June
19th rain event with values almost half the seasonal average.
Table 8: 2014 Specific Conductance of all three sites. Yellow highlight indicates rain events.
2014 Specific Conductance (µohms/cm)
Date Hwy 18 CTH A Ripley Rd
5/6/2014 686 650 715
5/19/2014 652 692 652
6/10/2014 643 714 719
6/19/2014 306 321 335
7/5/2014 655 667
7/20/2014 661 729 732
8/4/2014 673 735 743
8/19/2014 598 662 653
9/2/2014 698 751 753
9/4/2014 624 690 680
Average 620 661 665
14Total Phosphorus Concentrations: The total phosphorus average found in 2014 at the Hwy 18
site was 0.301 mg/L (Table 9). Two of the three samples for Hwy 18 were collected after rain
events. Highest phosphorus levels (0.395 mg/L) were detected during the 3.5 inch rain event on
June 19, 2014. Samples during the month of September decreased considerably with
concentrations of 0.226 and 0.179 mg/L. Areas draining to the Hwy 18 site appear to be major
sources for total phosphorus.
The 2014-2015 average total phosphorus for the CTH A site was 0.1435 mg/L. This average
included both rain and non-rain events. Average phosphorus concentration excluding the rain
events is 0.1205 mg/L. Average phosphorus concentrations for both sites are found in Table 9.
The Wisconsin water quality standard for phosphorus in the inlet stream is 0.075 mg/L (75
micrograms per liter (µg/L)). All samples taken at Hwy 18 were above the state water quality
standard suggesting that lands draining to the inlet stream may require additional restoration
efforts to reduce phosphorus loads. The phosphorus concentrations in this study exceeded
water quality standards in all but 2 samples (both at CTH A) of the Lake Ripley inlet stream.
Table 9: 1993 and 2014 Total phosphorus concentration at Hwy 18 and CTH A sites. Yellow highlight
indicate rain events.
1993 Phosphorus (mg/L) 2014 Phosphorus (mg/L)
Hwy 18 CTH A Ripley Rd Hwy 18 CTH A
3/11/1993 0.100 3/11/1993 0.150 4/12/1993 0.060 6/19/2014 0.395 5/19/2014 0.0828
3/25/1993 0.470 3/25/1993 0.400 4/26/1993 0.070 9/2/2014 0.226 6/10/2014 0.1490
4/12/1993 0.100 4/12/1993 0.070 5/27/1993 0.170 9/4/2014 0.281 6/19/2014 0.3280
4/26/2016 0.080 5/27/1993 0.110 6/10/1993 0.190 7/20/2014 0.0807
6/10/1993 0.240 6/10/1993 0.250 6/30/1993 0.550 8/4/2014 0.0888
6/29/1993 0.090 6/29/1993 0.180 7/12/1993 0.440 8/19/2014 0.2250
7/12/1993 0.170 7/12/1993 0.270 07/27/1993 0.560 9/2/2014 0.1830
7/27/1993 0.200 7/27/1993 0.300 8/10/1993 0.280 9/4/2014 0.2810
10/06/1993 0.180 8/10/1993 0.190 10/06/1993 0.070 10/24/2014 0.1280
11/22/1993 0.040 9/1/1993 0.270 10/19/1993 0.070 11/20/2014 0.1030
10/6/1993 0.080 11/22/1993 0.040 12/12/2014 0.0651
10/19/1993 0.080 12/14/1993 0.040 1/28/2015 0.0974
11/22/1993 0.040 2/24/2015 0.0917
12/14/1993 0.050 3/26/2015 0.0670
4/7/2015 0.0822
4/10/2015 0.2430
Average 0.167 Average 0.174 Average 0.208 Average 0.301 Average 0.1435
Similar to the 1993 appraisal, calculations were used to determine the amount of phosphorus
delivered via the inlet stream per day. To calculate the phosphorus load in terms of pounds per
day (lb/day P) the formula in Equation 2 was used. Multiply the total concentration of
phosphorus determined in the sample analyzed at the state lab by the rate of flow and by a
constant of 5.393 to get the total pounds per day phosphorus rate.
15Equation 2: Total phosphorus (lb/day).
Pound per day P = total P concentration (mg/L) X flow (cfs) X 5.393
Average phosphorus loading rates in 2014 of 9.94 lb/day P. However, in 2014, a peak flow of
29.9 cubic feet per second (cfs) was measured during a rain event. This rate was the highest
flow rate measured in 2014. High loading rates can be expected during major rain events
affecting the results when comparing both years. Excluding this rain event from the 2014 data
would significantly lower the mean loading rate to 2.78 lb/day P (Table 10).
Table 10: A 2014 and 1993 comparison of total phosphorus concentrations and loading rates from
surveys beginning in May and ending in September in each year (mean concentrations in bold). Data
from September 2, 2014 was not used as the flow rate was less than 2 cfs and therefore could not be
quantified and entered into Equation 2.
2014 2014 1993 1993
TP # P/day TP # P/day
mg/L mg/L
0.0828 1.8308 0.17 4
0.1490 1.7678 0.55 14.8
0.3280 52.890 0.44 16
0.0807 2.4372 0.56 14
0.0888 1.0535 0.28 9.3
0.2250 5.3633 0.27 7.3
0.2810 4.2432
Average 0.1765 9.9409 0.38 10.9
Average excluding
06/19/2014 event 0.1557 2.7826
Macroinvertebrates: The Hilsenhoff Biotic Index (HBI) characterizes water quality by the types
of macroinvertebrates present in the water (Hilsenhoff, 1998). Organisms are assigned a
pollution tolerance number based on their known sensitivity to pollution. Depending on what
organisms are found at the site and the number of those organisms, a Family Biotic Index can
be calculated. Table 11 shows the criterion and classification used to gauge water quality.
The Hwy 18 site had low species diversity. Immediately downstream from the culvert that is
located under water, a collection of live and dead snails was found which is shown in Figure 2
and are several inches thick. As indicated in Table 12, low numbers of only two species were
found in 2014. Due to low diversity and the number of organisms found, the HBI could not be
calculated.
The CTH A site shows improvement and is listed as good water quality with an HBI of 4.36. This
site had 5 different species found with multiple organisms of each species. Macroinvertebrates
collected at the CTH A site reflected better environmental conditions including limited riffle
16substrates and perhaps groundwater discharge via the neighboring wetlands. Otherwise, the
substrate in most stretches of the stream was dominated by soft organic sediment that does
not provide favorable conditions for most environmentally sensitive macroinvertebrates.
Macroinvertebrates collected at the Ripley Road site showed the water quality to be in poor
condition with an HBI of 7.0. This site had 3 species found but had a similar number of
organisms to those found at CTH A.
Table 12 shows the number of specimens in each macroinvertebrate family at each monitoring
site for both the 1993 and 2014 assessment and calculated HBI for each site.
Table 11: HBI criterion and classification.
Family Biotic Index Water Quality Degree of Organic Pollution
0.00-3.75 Excellent Organic pollution unlikely
3.76-4.25 Very Good Possible slight organic pollution
4.26-5.00 Good Some organic pollution probable
5.01-5.75 Fair Fairly substantial pollution likely
5.76-6.50 Fairly Poor Substantial pollution likely
6.51-7.25 Poor Very substantial pollution likely
7.26-10.00 Very Poor Severe organic pollution likely
Table 12: 2014 Lake Ripley inlet macroinvertebrate comparison of 1993 and 2014.
Number of Families at Location Number of Families at Location
(1993) (2014)
Family Name Hwy 18 CTH A Ripley Rd Hwy 18 CTH A Ripley Rd
Leptohyphidae 1
Hydropsychidae 18
Limephilidae 2
Chironomidae 7 32 23
Talitridae 63
Crangonyctidae 1
Gammaridae 45 19 2 9 47 12
Hyalellidae 59 149 45
Asellidae 5 2 4 2 10 20
HBI 6.33 7.56 7.02 N/A 4.36 7.0
Fairly Very
Water Quality Poor Poor Poor N/A Good Poor
Fish electroshocking survey: Two fish shocking surveys were performed on May 19, 2014 at
both CTH A and Ripley Road. At the CTH A site, approximately 55 feet was surveyed upstream
of the site. Deep organic sediments limited sampling further upstream. This small sample area
yielded 1 mud minnow and two bluegills. The second fish shocking survey was conducted at
17the Ripley Road site heading into the WDNR wetland areas. Muck substrates were also found
at this site, but allowed for a more expansive distance of 264 feet. Four species were found
during this survey with an increase in the amount of each species found, though none were
environmentally sensitive. Total electroshocking results were limited to just four species:
central mud minnow, northern pike, bluegill, and largemouth bass. Information on the fish
survey is found in Table 13.
Table 13: 2014 Lake Ripley inlet fish electroshocking survey results.
Fish Shocking: 150 V, 4 amps *
5/19/2014
Ripley
Rd CTH A
264' 55'
15 min. 4 min.
Species Number Number
Mud minnow 4 1
Northern Pike 3
Bluegill 11 2
Largemouth bass 3
Crayfish 1
* deep water - muck limited sampling
Discussion
During the 1993 Lake Ripley Water Resources Appraisal, D.O. levels at Hwy 18 were higher than
the two other sites (Table 1) . Average D.O. from April to December at Hwy 18 was 8.7 mg/L .
There was a decrease in D.O. levels found at the Hwy 18 site during the most recent analysis.
This could be due to stagnant water conditions by restricted flow on the east side of the road
via culverts placed at different elevations forming an impoundment. The active culverts at this
site may be draining the bottom of the confined water which may possess lower D.O.
CTH A averaged D.O. concentrations of 4.9 mg/L and Ripley Road averaged 5.8 mg/L for the
same time period in the 1993 appraisal. D.O. concentration fell extremely low (0.80 mg/L) at
the CTH A sampling site and Ripley Road concentrations dropped to 0.0 mg/L in July. These
anoxic and near anoxic conditions were optimal for filamentous algae growth in the stream and
phosphorus release from the bottom sediments. The oxic conditions found in 2014 did not
stimulate heterotrophic periphyton as were found in 1993.
Forage fish such as carp can withstand a minimum of 1 mg/L, but most aquatic life requires
higher D.O. concentrations to survive. When D.O. levels fall below 0.5 mg/L, phosphorus can be
released from stream sediments and will contribute to the nutrient load to the lake. According
to the 1993 appraisal D.O for this site ranged from 0.8-1.8 mg/L from June through September.
There is an increase in average D.O. concentrations found in the 2014 study at both CTH A and
Ripley Road compared to concentrations found in 1993. This increase in D.O. could be due to
18the best management practices implemented by property owners through cost-share efforts
with the district, coupled with other land management practices that have been developed and
the establishment of the Lake District Preserve.
Though D.O. levels fell below the criterion to protect warm water fish species and aquatic life
communities on numerous events, the increase in D.O. averages is consistent with the increase
of other water quality parameters.
Water clarity and turbidity were favorable during low flow events. When water flows increase
due to rain events, increased turbidity and nutrients in the inlet stream were found. As rain
events increase in intensity as is predicted by climate change models, a decline in clarity and
increase in turbidity is likely to occur due to increased erosion and sediment delivery to the
stream.
Average flow measured in 1993 at CTH A was 5.3 cfs compared to 4.0 cfs found in the recent
analysis. The reduction in flow found at CTH A could be due to seasonal weather conditions. It
was noted in the 1993 appraisal that the inlet was monitored during a year with unusually high
precipitation. Another factor could be the implementation of ditch plugs limiting direct flow to
the stream. At heights above 7.27 feet on the CTH A staff gauge, flow velocities can be
determined by using equation 1. By pairing flow data and water elevation levels on the staff
gauge, future monitors can calculate flow rates based on a quick look at the elevation of water
shown on the staff gauge and entering the data into the calculation. The LRMD does not have a
velocity meter therefore by using the equation listed along with water collected for total
phosphorus analysis, the LRMD can further calculate phosphorus loads per day in future
monitoring.
Water temperature measurements varied by each site. As seen in the 1993 assessment the
Hwy 18 site has higher water temperature then the other two sites by almost 2°C when
comparing temperature averages. Higher water temperatures at the Hwy 18 site could be due
to water impoundment. Lower water temperatures found at CTH A and Ripley Road could be
caused by ground water recharge and more shading of the water by trees and other vegetation.
Temperature can impact D.O. levels and should be included in future monitoring efforts at all
three sites.
Average pH found at CTH A and Ripley Road show similar results when compared to values
found in 1993. pH values show the inlet stream is slightly alkaline. Lakes in Wisconsin tend to
range from 4.5 in some acid lakes to 8.4 in hard water, marl lakes (Understanding Lake Data,
2004). Acid rain can enhance the acidity of water bodies. Lake Ripley typically exhibits alkaline
pH values and is somewhat buffered from acid rain impacts. Measurements were not collected
for the Hwy 18 site during the 1993 appraisal.
Specific conductance levels were lower at Hwy 18 but similar at CTH A and Ripley Road. A
reduction in specific conductance on 06/19/2014 show a dilution caused by the rain event.
Specific conductance increases the closer the site is to the lake or further down the watershed.
19This increase could be due to increased road areas or impervious surfaces. The 1993 appraisal
did not include specific conductance data. Data collected in 2014 can serve as a baseline for
future monitoring.
The 1993 appraisal shows the average total phosphorus concentration for Hwy 18 was 0.167
mg/L, 0.174 mg/L for CTH A, and 0.249 mg/L for Ripley Road (Table 9). The 2014 average for
CTH A was 0.1765 mg/L from May to September compared to 0.38 mg/L found in 1993 for the
same time period. Excluding the large rain event in June 2014, averages drop to 0.1557 mg/L.
Total phosphorus concentrations continue to be higher than the state water quality standard of
0.075 mg/L and are providing additional nutrients to Lake Ripley.
Phosphorus concentrations found in 1993 and 2014 along with flow velocities are used to
calculate phosphorus loads to Lake Ripley. Including the large rain event on 06/19/2014, a
slight reduction in the average Phosphorus loads was shown from 10.9 lb/day P in 1993 to 9.94
lb/day P in 2014 (Table 10). However, excluding the rain event, a large decrease in average
phosphorus concentration occurred from 10.9 lb/day P in 1993 to 2.7826 lb/day P in 2014. The
large rain event of approximately 7 inches over the preceding two days most likely transported
additional sediments and containments, leading to the large amount of total phosphorus
detected on that date. As the intensity of rainfall events increase an increase in phosphorus
loading could occur.
Consistent with 1993 findings, a low diversity of macroinvertebrates was found in the stream in
2014 at Ripley Road and Hwy 18 and is indicative of lower D.O. concentrations in the streams
that drain extensive wetlands of various conditions, even though our D.O data show the Ripley
Road site to have the highest D.O. average. At Hwy 18, 4 species of organisms were found in
1993 and only 2 species were found in 2014. Five species were found in 1993 at Ripley Road
but only 3 species were found in 2014. Macroinvertebrate surveys show better water quality
at the CTH A site than at the downstream Ripley Road site with 5 species found in 2014
compared to 4 found in 1993. The increase in riffle substrate, shading by trees, and decrease in
water temperature could be the reason for this difference.
Fish electroshocking surveys show similar results to other indices measured. While there is
some improvement to water quality, surveys showed only 4 species of fish found of which no
species is environmentally sensitive. Deep organic substrates limited access to the CTH A site
which may have yielded different results. The fish community of the inlet streams was not
surveyed as part of the 1993 appraisal. Data collected in the 2014 analysis can serve as a
baseline for future monitoring.
Recommendations
Reducing phosphorus concentrations in the inlet stream should continue as a top priority for
the District. Management practices should plan for increases in rain intensity when developing
phosphorus reduction goals. Additional monitoring could include analysis of both total and
20dissolved phosphorus. Dissolved phosphorus can be high in areas discharging from wetlands
and implemented conservation practices may not address this source.
As part of the District’s ongoing mission to collect stream monitoring data, monitoring could be
modified to sample on both sides of the inlet stream at the Hwy 18 site. Areas north of Hwy 18
should be investigated given the high turbidity and phosphorus loading associated with the rain
event in June, 2014. Persistent low D.O. at this location could be caused by the confinement of
water due to the Hwy 18 road grade. The active culverts at this site may be draining the
bottom of the confined water which may possess lower D.O. concentrations than water near
the surface, but this hypothesis requires further investigation. Elevated water temperatures
may also cause lower D.O. concentrations, but no data has been collected to measure water
temperatures on the north side of the road.
Water clarity and turbidity levels showed a reduction in water clarity at the CTH A site. Further
investigation is recommended to determine the source of sediments to this area. Additional
management action may be needed in the Lake District Preserve or elsewhere in areas that
drain to this area.
It may be useful for future monitoring efforts to include specific conductance during winter
months to possibly determine if road salt applications modify these levels. This parameter
should also be included with any chloride analysis of Lake Ripley.
Sampling the macroinvertebrates should continue through monitoring carried out by the
District interns. A lack of species at the Hwy 18 site and the poor classification of the Ripley
Road site should be noted and subsequent monitoring of species should occur to gauge
changes.
The District should seek coordination with local universities who may be available for additional
analysis of fish in the inlet. Specialized equipment and training is required to perform this
analysis and efforts could be included in ongoing student research.
Additional solutions to reduce the impact of high intensity rain or snow melt events should also
be explored. The 1993 appraisal noted that the inlet was monitored during a year with
increased precipitation. That may influence the data that was collected. However, with climate
change, rain intensity has increased even if the overall amount of rain is similar. The increase in
intensity of rain events could cause additional erosion, increasing phosphorus concentrations,
and lowering D.O levels.
Conclusions
Research findings of the 2014 water quality survey of the Lake Ripley inlet stream suggests
improved environmental conditions when compared to the surveys in 1993. Lack of anoxic
conditions in 2014 may reflect a number of factors including improved land use management,
particularly the establishment of the Lake District Preserve, ditch bank repair, and conversion of
agricultural lands to natural areas. However, large rain events show an increase amount of
21phosphorus and sediment detected. The intensity and frequency of seasonal rains should be
considered when developing practices to reduce nutrient and sediment loads. Time of year
may also play a factor in the amount of nutrients found. The exceedance of phosphorus water
quality standards continues to warrant additional efforts to reduce phosphorus loads.
Continued monitoring of the inlet stream should occur in the future and can remain a part of
LRMD internship responsibilities. Information not available in the 1993 appraisal but obtained
through these efforts can be used as a baseline for future monitoring efforts.
Acknowledgements
The LRMD Board of Directors would like to thank the WDNR for providing financial and
technical assistance, the Wisconsin State Lab of Hygiene for phosphorus analysis, Patricia Cicero
for technical assistance and David Marshall of Underwater Habitat Restorations LLC., for the
consulting work, access to equipment, and assessment of the results for this study.
References
Wisconsin Department of Natural Resources and Lake Ripley Management District. 1994. Lake
Ripley Water Resources Appraisal.
Wisconsin Department of Natural Resources. 2015. Wisconsin 2016 Consolidated Assessment
and Listing Methodology (WisCALM) for CWA Section 303(d) and 305 (b) integrated reporting.
Guidance # 3200-2015-01
Hilsenhoff, W.L. 1988. Rapid field assessment of organic pollution with a family level biotic
index. Journal of the North American Benthological Society 7(1):65-68.
University of Wisconsin-Extension. 2004. Understanding Lake Data. G3582.
US Climate Data. November 17, 2015. www.usclimatedata.com
22You can also read