Power Potential Final Showcase - Thursday 24 June 2021 - National ...
←
→
Page content transcription
If your browser does not render page correctly, please read the page content below

Power
    Potential
    Final Showcase
    Thursday 24 June 2021

1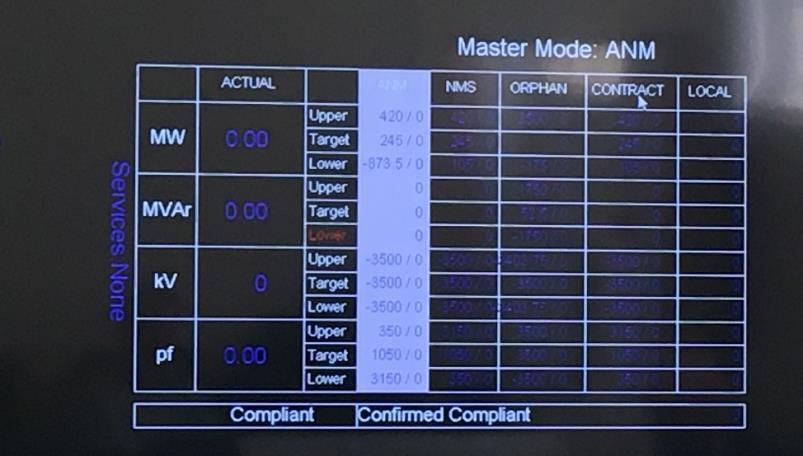
Agenda

12:30   Welcome                                     Julian Leslie and Barry Hatton

12:40   Reflections on Power Potential              Dame Fiona Woolf

12:45   Power Potential learning and insights
               •    Why Power Potential (5 min)     Dr Biljana Stojkovska
               •    Recap of the project (5 min)    Dr Rita Shaw
               •    Key Learnings
                        o     Technical (10 min)    Dr Rita Shaw and Dr Biljana Stojkovska
                        o     Commercial (10 min)   David Preston and Dr Biljana Stojkovska
                        o     System (10 min)       Dr Rita Shaw

13:30   Q&A                                         Project team

14:00   Looking forward                             Dr Biljana Stojkovska, Dr Rita Shaw

14:10   Conclusion                                  Project team

14:15   Event close

2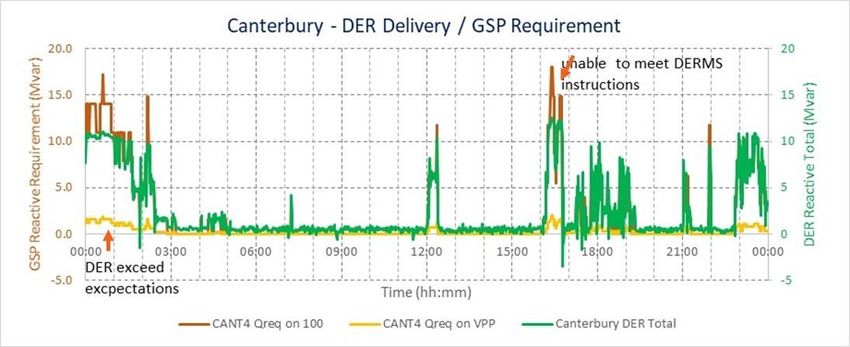
Welcome

        Chair
   Julian Leslie            Barry Hatton                Dame Fiona Woolf
   Head of Networks    Director of Asset Management     Chair of Power Potential’s
   National Grid ESO        UK Power Networks         Regional Market Advisory Panel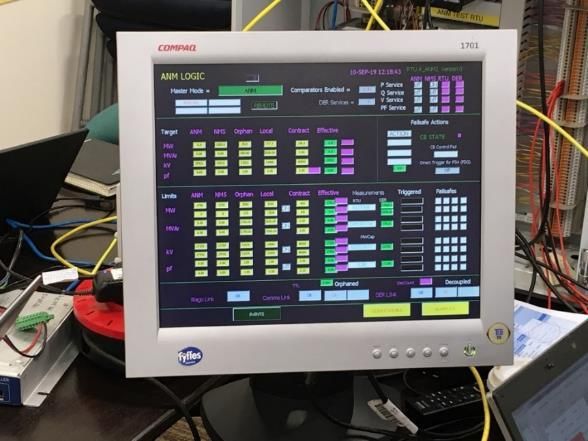
Reflections on
Power Potential

Dame Fiona Woolf DBE, DL

The “Trilemma” of electricity market design

                The “Trilemma”                           Achieving the “Nirvana”
             Simultaneously juggling                      of market objectives
           three competing objectives:

                   Reliability

               Decarbonisation

                  Affordability

                                   The Journey

                                                 Trade off v keeping all balls in the air
5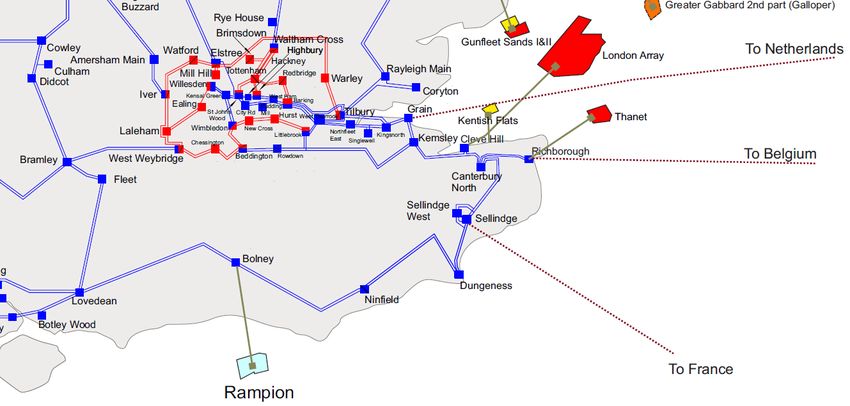
The long and winding road to Nirvana in England & Wales

    Clean flexible assets and      Culture change from redundancy
     behaviours create the              in assets to intelligence
             Nirvana
                                                 Eroded margins ->
                                                 Capacity and CfD
                Complexity –                   mechanisms introduced
               opportunities for
                  gaming                        Success in renewables and
                                                DER despite 10+ years of
                                                    policy uncertainty
               “Gross” pool
                introduced                     Bilateral contract market
                                                with balancing and A/S
                                                        markets
            Performance and
                efficiency
               challenges                  Unclear investment signals
6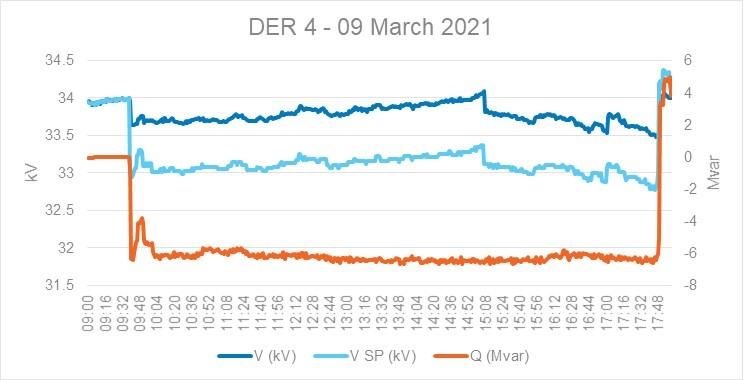
Power Potential Unwrapped
•   The Power Potential project was a world first trial in using Distributed Energy
    Resources (DER) in distribution networks to provide dynamic voltage control to the
    transmission system – a combined technical, commercial and business solution
•   Technical – it provides reactive power for system voltage support and active power
    support for constraint management and system balancing
•   Commercial – it creates a new regional reactive power market from DERs
•   Business – involves the creation of a Distribution System Operator (DSO) model
•   A whole-system approach can be beneficial for everyone from network operators to
    generators to end consumers – proof of concept trial
•   On the path to cleaner, smarter flexibility

7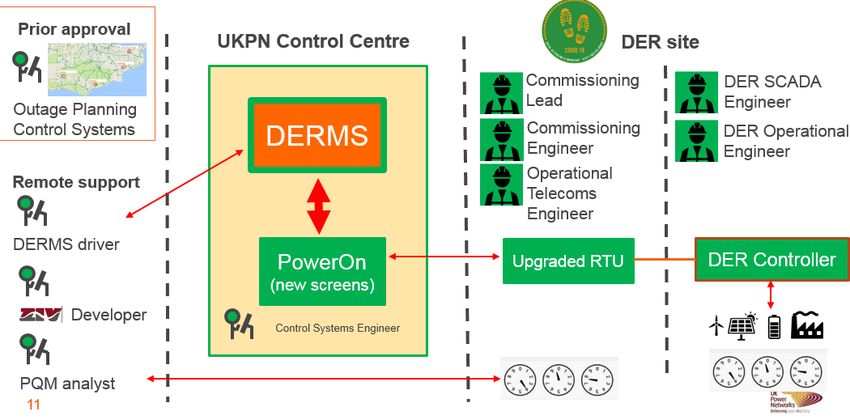
Culture change - lessons learned
    •   Collaboration between companies with different functions and backgrounds is key
    •   Each network is different
    •   Innovation has to be tempered with keeping the lights on
    •   Exploring the individual needs of potential participants is fundamental
    •   Software development can be a headache (issues such as cyber security, confidentiality
        and access to data are a hidden complexity)
    •   Network reinforcement may be deferred rather than avoided , but keeping the options
        open has value
    •   Trials of a market-based solution does not automatically guarantee success or its
        application to other aspects of the electricity supply chain but it is worth doing for the
        learning

8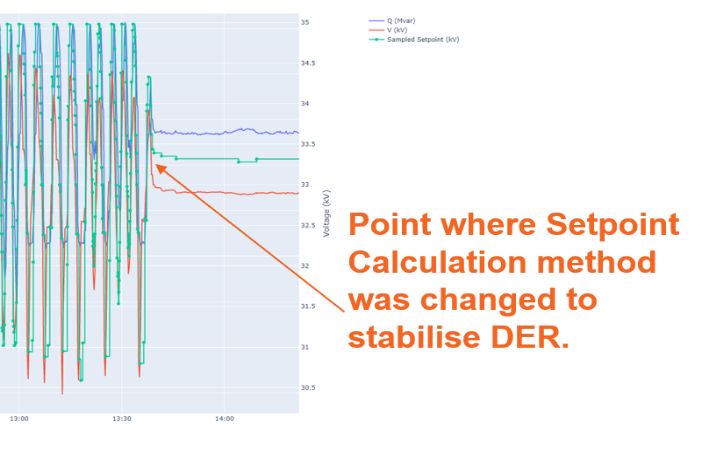
Using what is in the store cupboard

9
Collaboration is the name of the game

10
Why Power
Potential?

Dr Biljana Stojkovska
Power Potential Lead
National Grid ESO
Power Potential Unwrapped

     •   A world first trial to provide dynamic voltage control to transmission

     •   Identifying new and flexible resources

     •   A whole-system approach is beneficial for everyone

12
Power Potential Trial Region 13
Why Power Potential?

          Intact system     Contingency system
14
The How
1. Technical solution
• Dynamic voltage control from DER
• MW re-dispatch for constraint management and balancing
2. Commercial solution
• Establishing new reactive power market from DER
15Project Recap Dr Rita Shaw Power Potential Lead UK Power Networks
Power Potential to
                                                     Power Provided
                                                     •   Created a live DERMS
                                                     •   Integrated with DER and
                                                         operational Distribution and
                                                         Transmission
                                                     •   5 DER: 1 solar, 2 battery, 2 wind
                                                     •   30 users accessed DERMS
                                                     •   Reflected effectiveness at Grid
                                                         Supply Points
                                                     •   Kept distribution network secure

Distributed Energy Resources Management System (DERMS)
How DERMS manages each DER in voltage control
DERMS instructs a DER into voltage control mode, then issues voltage setpoints for service
Vsetpoint sent to DER
Measured Vlocal
Voltage difference
-> reactive power output at DER @4% of rating
DERMS’ request at DER based on ESO’s
request at the Grid Supply Point
18Live demonstration
Collective NGESO-UKPN-DER
Wave 1
Per DER Wave 2
Technical
Market trials
trials
Pre-requisites Demonstrated concept Applied Wave 1 learning
Enabled competitive bids
Commissioning
Ran end-to-end system, Daily auctions,
Capability Test 8 weeks 24/7 1772 hours
Mandatory Trial Response following Bids presented to ESO
change in measured reflecting DER effectiveness
transmission voltage and
set point
DER received fee based DER paid based on day-ahead
on number of hours accepted price and delivered
available service
19Power Potential
delivered
• Delivered by staged approach, • World-first regional reactive power market
commitment, flexibility
• Overcame significant
challenges and adapted, • Principles of T & D operators enabling
including COVID-19 DER to deliver dynamic voltage control for
restrictions
transmission, integrated operationally
• Identified route to Business As
Usual development and
application
• Co-ordinated DSO dispatch for ESO of
• Trial supported by NGESO,
UK Power Networks, DER
MW and Mvar from a DER
teams and ZIV AutomationTechnical Learning Dr Rita Shaw and Dr Biljana Stojkovska
DER commissioning – procedures created for site and Control

22
Control Engineer Visibility on PowerOn

                                   Remote Terminal Unit mimic
 23
Technical learning about enabling DER service
Project team
Integration, delivery, operation of the systems and processes
Participating DER
Operation in voltage droop control – changes to inverters, warranties with their suppliers
Adapting controllers for fast response – challenge to achieve Mvar range in 2-5s
Interfacing with distribution network control
Delivery alongside their other services, and active power service
24Examples of initial DER response then steady delivery 25
Calculation of expected reactive power delivery by VPP

26
Expected vs required reactive power delivery by VPP

27
Solutions to achieve a proportional response from DER
 •    Virtual Power Plant (VPP) reaches a maximum delivery for a very small 0.3% fall in GSP voltage
      rather than a 4% fall in GSP voltage
 •    Hence there is no capability left to secure a post-fault fall in system voltage and there is no
      proportional service response                    .
 •    The issue is that the current DERMS design assumes a nominal 100Mvar ‘Q’ base at the GSP, so
      the DER is unable to deliver for larger voltage changes
 •    Potential DERMS changes in post-trials:
     o Auto/manual function to allow for either manual configuration of the Q Base by the user or
     o Capability for DERMS to automatically calculate Q Base

28
Simultaneous Active and Reactive Power Dispatch
• DER can successfully simultaneously deliver active and reactive power
• 2 DER took part: difficult to draw wide conclusions
o Importance of configuration of the DER controller
o Expected Operating Level (EOL) could lead to unexpected delivery
o Reactive power service was prioritised over active power for one DER
o No significant conflicts with Firm Frequency Response (FFR) and
Enhanced Frequency Response (EFR) markets
29Commercial Learning David Preston and Dr Biljana Stojkovska National Grid ESO
Power Potential – Commercial trial
 Outlines the aims and objectives of the commercial trial (wave 2) with the key areas / elements and processes within

 Aims and Objectives          Competitive bidding among participants, to facilitate “price discovery” from DER, within the
                              limitations of the trial budget, allowing DER to freely bid both utilisation and availability prices.

 Duration & Participation     5th January – 28th March, with 4 participants (solar, battery, wind x 2), representing 3 VPPs
 levels                       (Bolney, Ninfield & Canterbury North). DER had opportunity to bid for and potentially provide a
                              service in a total of 1,772 operational market hours.
 DERMS                        DER utilise the DERMS Web Interface to submit their Power Potential bids be informed of
                              acceptance or rejection – with the reason why.

 Assessment and               Nominations for service provision were made with the aim of accepting the most economic
 Nomination                   VPPs whilst operating within the budgetary constraints.

 Service Delivery             Based on the results of the auction DER expected to make the unit available and respond to
                              voltage set point instructions.
 Market Reporting             Weekly report providing an aggregated view of data relevant for trial participants to support the
                              auction process.
 Settlements                  Monthly settlement process among NGESO – UK Power Networks and DER.

31
Wave 2 Trial Results – Summary Weekly accepted availability and utilisation prices across the 3 VPPs for the trial period and volumes utilised for each month. 32
Wave 2 Trial Results – Ninfield

                                  GSP 1 – Ninfield (Solar & Wind)
                                  • Average accepted availability
                                    price £1.18 /Mvar/h
                                  •   Average accepted utilisation
                                      price £4.17 /Mvarh
                                  •   Volume utilised 5453 Mvar
                                  •   Service hours accepted 1508
                                  •   Days not procured 10

33
Wave 2 Trial Results – Bolney
GSP 2 – Bolney (Battery)
• Average accepted availability
price £4.58 /Mvar/h
• Average utilisation price
£9.35 /Mvarh
• Volume utilised 1503 Mvar
• Service hours accepted 996
• Days not procured 29
34Wave 2 Trial Results – Canterbury North
GSP 3 – Canterbury North (Wind)
• Average accepted availability
price £1.47 /Mvar/h
• Average utilisation price £7.35
/Mvarh
• Volume utilised 4838 Mvar
• Service hours accepted 1566
• Days not procured 6.3
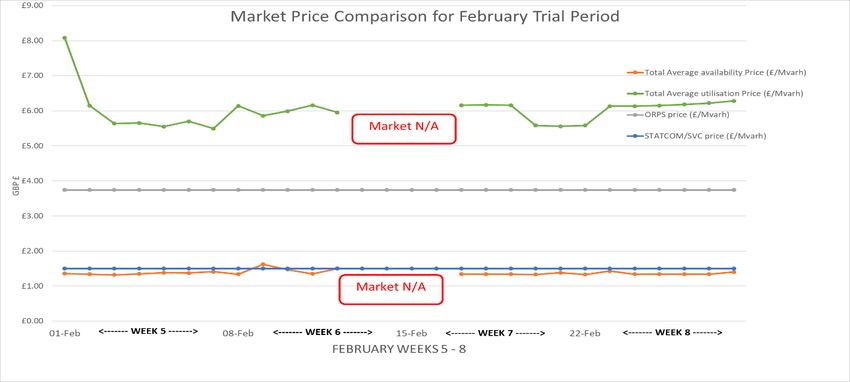
35Reactive Power Market Price Comparison 36
Key Areas for Improvement / Further Consideration
The project captured some key aspects of the current commercial arrangements, framework and
processes that require further consideration to support an enduring service.
require further consideration to support any transition to an enduring service.

                         DER utilisation               DER                 Nomination &
       Additional
                         vs alternative             Contractual            Assessment
      Market Data
                            sources                 Framework              Methodology

                                                                          Accommodation
     DNO roles and         Procurement               Conflict of
                                                                           of additional
     responsibilities      Timeframes                Services
                                                                               DER

37
Cost Benefit Analysis (CBA) - Cambridge University
• The CBA has been calculated using a Net Present Value methodology, compared
against the cost of building transmission connected STATCOMs
With DER only With DER & network optimisation
year %DER Participation year %DER Participation
25 % 50% 75% 100% 25 % 50% 75% 100%
(£m) (£m) (£m) (£m) (£m) (£m) (£m) (£m)
2020 1.0 1.0 1.3 2.5 2020 3.4 3.4 3.4 4.8
2030 3.9 6.6 8.3 9.0 2030 16.0 18.4 18.9 20.7
2040 6.4 10.6 12.3 14.2 2040 25.0 29.0 30.1 32.3
2050 8.7 14.1 17.0 19.5 2050 32.0 36.7 39.4 42.3
Based on average accepted availability price £1.46/Mvar/h and average accepted utilisation price of £4.8/Mvarh
38Cost Benefit Analysis - Replication Studies
• The replication studies demonstrate the expansion of the Power Potential project
could save energy consumers over £96m by 2050 when rolled out to 19 transmission
voltage zones within Great Britain and to £161m for DER sized above 100MW
With DER up to 100MW
% DER Participation
year 25% 50% 75% 100%
Benefit (£m) Benefit (£m) Benefit (£m) Benefit (£m)
2020 5.0 5.0 6.5 12.6
2030 20.2 34.1 42.9 46.5
2040 31.7 52.6 61.0 70.4
2050 43.1 69.9 84.3 96.7
With DER below and above 100 MW
% DER Participation
year 25% 50% 75% 100%
Benefit (£m) Benefit (£m) Benefit (£m) Benefit (£m)
2020 11.5 11.5 15.0 28.9
2030 40.5 68.6 86.3 93.5
2040 56.0 92.7 107.5 124.2
2050 72.1 116.9 140.9 161.7
39System Learning Dr Rita Shaw Dr Biljana Stojkovska
Live system demonstration

      DER operating in voltage control
      under DERMS instruction to form a
            VPP for transmission

                            Technical service and market solution
                          enabled by a DSO DERMS reflecting altered
                           DER connection agreements, new service
                            contracts and linked to NGESO systems

                                                               Day-ahead procurement for
                                                            delivery in 4hr service windows,
                                                                   settlement in arrears

41
Approach to system delivery
Design, build, test, DER
integrate system on-boarding
DER contract System
framework upgrades
Distributed Energy
Resources
Management System
DER (DERMS)
technical Live trials
framework
Customer
Settlements and
engagement and
reporting
communications
42Solution overview
PAS DERMS Settlement DERMS
DER UI
DER Substation
NGESO DER
SCADA data
PowerOn RTU
Control
UKPN Control
Centre
43Power Potential – learning from integrating 20+ elements
Web services
Azure + OData
PAS ESB DERMS Settlement DERMS
(PP part) DER UI
Azure hosted – penetration tested
Via PI
ICCP
DER Substation
NGESO
SGT SCADA ICCP PowerOn RTU DER
with DERMS with logic
data screens for 5 DER GPRS/ upgrade Cable, Controller
satellite DNP3
UKPN Control SCADA
Centre
44 Live and test systems, with redundant sitePQ operating envelope defined for each DER
• DER offers reactive range (Q, Mvar) at each active power level (P, MW)
• Operating range reviewed by UK Power Networks for safe network operation
• Implemented in contracts
• Wider range enabled by DERMS monitoring and control
Active power (P, MW)
Typically up to 0.95 lead
permitted before PP
Reactive (Q, Mvar)
45PQ operating envelope defined for each DER
• DER offers reactive range (Q, Mvar) at each active power level (P, MW)
• Operating range reviewed by UK Power Networks for safe network operation
• Implemented in contracts
• Wider range enabled by DERMS monitoring and control
Active power (P, MW)
Reactive (Q, Mvar)
Greater permitted range for trial
46System learning in trial
✓ Integration and technical function demonstrated end-to-end
✓ Revised active power limits / PQ envelopes agreed with customers
✓ In trials – delivered multiple DERMS, PAS, process improvements and defect fixes
• Reduced data traffic DERMS-DER – changed integration design, and log caches
• PAS-DERMS interaction – default to no acceptance, visibility of comms interruptions
• Improvements to reduce team’s manual support, and improve web interface
• Improved stability of the service delivery
❑ For a BAU transition - identified multiple DERMS, PAS and process improvements
• Scale of requested Q at GSP (delivering response proportional to GSP voltage delta)
• Improved end-to-end visibility of service availability during delivery – NGESO-UKPN-DER
• Nomination process improvements / end-to-end test
47Systems Learning – from Wave 1 trials applied to Wave 2
Reduce oscillations in service delivery
1) DERMS voltage set point calculation method 2) DERMS controller tuning per GSP
GAIN = 0.6 GAIN = 0.5
48PAS Key Learning and Improvements
Key learning:
• Visibility to NGESO control room of when DERMS is on outage, or when DER are out of
voltage control – and visibility to UK Power Networks when PAS is unavailable
• Full End to End testing of nomination process is required prior to the start of service
delivery
• Potential need of visibility of DER data to confirm the information presented in PAS
Improvements:
• To provide visibility to NGESO control room for service dispatch
• Wider access to Control Room planned outage scheduled
49Q&A Please raise your hand to ask a question, we will introduce you or add your question to the meeting chat
Looking
Forward

Dr Biljana Stojkovska
Dr Rita Shaw
Power Potential Next Steps

 DER feedback on next steps:
     • Maintain momentum, learnings have been valuable.
     • With some improvements the service can work. Liquidity is essential

Identify the interactions between Power Potential and other NGESO & UK Power Networks
projects:
     • Regional Development Programmes (RDP)
     • Reactive Market Reform
     • DSO role development

52
Power Potential Next Steps
Link to Regional Development Programmes (RDP)
• RDPs are initiatives that look at the complex interactions between distribution and
transmission networks in areas with large amounts of transmission connections and
distributed energy resources, which are leading to a capacity shortfall.
• The south-coast RDP between NGESO and UK Power Networks has been running for
five years, and is now developing new markets for transmission thermal constraint
management services in a similar geographic location to Power Potential.
• Agreement between UK Power Networks and NGESO to incorporate the Power Potential
services to potentially expand the future scope of the RDP
53Reactive Reform - Market Design Project
• To address the challenges, we are facing for system voltage control, the NGESO are
now exploring market-based solutions through a reactive market design project to
assess whether a market could be developed
• Enabling more across technologies and connection types to provide reactive power
services in the right locations to maintain system voltage security and drive down the
overall reactive costs to maximise consumer benefits.
• Three key focus areas for analysis and design work are:
Market Analysis:
Technical Analysis: Identification of Commercial Analysis: Procurement
Market Readiness and Technical &
System Need for procurement Strategy
Commercial Viability
• Project is currently in the stage of establishing the scope and detailed plan, and will
adopt the collaborative approach of co-creating the solution with industry and will share
the further engagement plan shortly
• Project will also consider the output from other projects includes power potential and
pathfinder etc to see if any learning could feed into the future market design work
54Building DSO and Power Potential capability for future
PP trial commercial framework
• Back-to-back contractual mechanism – NGESO-UKPN and UKPN-DER
• Pass-through of service payments NGESO->UKPN-> DER
• System delivery and support costs were provided by innovation project + partners
o This approach supported the trial learning objectives
To enable PP for BAU, new processes, contracts and system changes (T and D)
• Leverage project learning, to identify what from PP to progress in the new RDP systems
For UK Power Networks, PP/RDP are part of our Distribution System Operator roles
• Submitting plans to Ofgem for related allowances and performance incentives for 2023-28
• Creating the necessary technical and market functionalities for DSO products e.g.
o Enabling whole system solutions
o Coordination to resolve complexities, optimise dispatch and mitigate conflicts
o Facilitating participation of more DER
o Neutral market facilitation
55Next steps for DSO PLATFORM
UK Power Networks Distributed Energy Resources
Management System (DERMS)
A future suite of Embedded smart grid programmes
smart network
Flexible Flexibility RDP
products enabled by connections services services
our DERMS DSO
platform Innovation projects
Active Power Optimise
Response Potential PrimeProject outputs on the website
https://www.nationalgrideso.com/future-energy/projects/power-potential
• Project reports (SDRCs) – Design (9.1 and 9.2), Commercial
approach (9.3), Customer, system and process readiness
(9.4), CBA (9.5), Trials and BAU (9.6), DSO risk-reward (9.7)
& academic reports from Imperial College and Cambridge
University.
• Technical references: Initial DER technical characteristics
spreadsheet, DER technical requirements, DER test
specification, DER interface schedule, DNO commissioning
procedure, DNO Control procedure, Mandatory Trial
guidelines, Aggregator design study
• Commercial / contractual references: Market Procedures,
DER Framework Agreement, Variation to the Connection
Agreement, Reactive Power commercial procedures.
57WEBSITE
https://www.nationalgrideso.com/future- Thank you
energy/projects/power-potential
Slides are on the website
Feedback form, please complete
Final Showcase Event - Feedback form
Close down report will be on the
EMAIL website on 2 August 2021
box.PowerPotential1@nationalgrid.com
powerpotential@ukpowernetworks.co.ukPower
Potential
Final Showcase
Thursday 24 June 2021
59You can also read